10-Year Treasury Yield: Comprehensive Review and Outlook
In-depth 10-year Treasury yield analysis covering fundamentals, technicals, and sentiment. Structural forces favor higher yields toward 5.60-5.80%, but intervention risk and extreme positioning create near-term two-way volatility. Updated regularly.
✅ Last Reviewed: | 📝 Last Updated: | 📋 Full History →
10-Year Treasury Yield at a Glance
Directional Pressure on Yields:
Upward pressure dominant, intervention risk lurks
🌎 GLOBAL FACTORS & TERM PREMIUMForeign demand declining, fiat stress mounting
🧠 SENTIMENT & POSITIONINGExtreme underweights signal reversal vulnerability
📈 TECHNICAL STRUCTUREConsolidation within confirmed higher-rate regime
🎯 FINAL VERDICTStrategic (medium/long term)
Structural forces favor higher yields toward 5.60-5.80% driven by fiscal deficits, foreign diversification, and confirmed regime shift.
Tactical (near term)
Extreme positioning vulnerability versus potential dollar support create genuine two-way risk.
〰️ Forces Shaping the 10-Year Treasury Yield
The 10-year Treasury yield's trajectory in 2026 will be shaped by several competing forces operating within the current market regime. While the Fed's dovish bias and stable growth support lower yields, massive fiscal deficits and emerging signs of structural shifts in the global monetary system create persistent upward pressure. The resulting dynamic suggests yields will remain elevated relative to pre-pandemic norms, with volatility driven by the tension between these opposing forces.
| Component | Current Assessment |
|---|---|
| FISCAL DEFICITS |
Unprecedented peacetime deficits create persistent upward pressure
|
| INFLATION DYNAMICS |
Structurally higher inflation regime creates yield floor
|
| ECONOMIC GROWTH OUTLOOK |
Resilient growth reduces safe haven demand
|
| INTERVENTION RISK |
Growing possibility of direct market intervention could suppress yields
|
| GLOBAL DYNAMICS & RISK PREMIUM |
Geopolitical tensions fail to drive sustained safe haven flows
|
| FOREIGN CENTRAL BANK BEHAVIOR |
Structural shift away from U.S. Treasury accumulation underway
|
| CAPITAL WARS & MONETARY SYSTEM STRESS |
Emerging cracks in the fiat monetary order create uncertainty
|
🧠 Sentiment & Positioning
Current sentiment data presents a contrarian picture: investors are positioned at record bond underweights with minimal hedging, while economic news sentiment remains moderately optimistic. The extreme positioning suggests substantial downside risk for yields if sentiment shifts, though positive news flow provides modest near-term support for stable-to-higher rates.
| Component | Current Assessment |
|---|---|
| Bank of America Global Fund Manager Survey Jan 2026 |
Record bond underweights and hyper-bull sentiment create contrarian setup for Treasury rally
The January 2026 BofA Global Fund Manager Survey reveals extreme risk-on sentiment across global markets, with record bond underweights, minimal cash holdings, and hyper-bull positioning in equities and commodities. The key implications for Treasury bonds from a contrarian perspective:
|
| DAILY NEWS SENTIMENT INDEX (DNSI) |
DNSI readings moderately above historical median
|
📈 Technical Structure
Technical structure provides critical insight into whether the 10-year Treasury yield is consolidating within a durable trend or showing early signs of reversal. The following analysis examines monthly and weekly charts to distinguish between trend stability and trend breakdown.
| Technical Factor | Current Status | Structural Signal |
|---|---|---|
| SECULAR REGIME SHIFT | Multi-decade downtrend decisively broken in April 2022; yields sustained above former resistance |
Confirmed
Monthly close above the 1981-2020 downtrend line established a structural break from the disinflationary regime. Yields have consistently held above this former resistance, confirming acceptance of a higher-rate environment rather than rejection of the breakout. |
| TRIANGLE FORMATION | Symmetrical triangle forming since late 2023 with converging highs and lows |
Neutral digestion pattern
Triangle formation reflects consolidation within the new regime rather than distribution preceding reversal. Pattern can resolve in either direction, but its position above the broken downtrend suggests continuation bias. Breakout direction and follow-through will determine next structural leg. |
| CANDLESTICK BEHAVIOR | Responsive buying at triangle lows; no bearish exhaustion patterns at highs |
Rejection of extreme yields
Weekly chart shows consistent buying interest at lower triangle boundary (e.g., April 2025 reversal with long lower shadows), indicating demand prevents yield expansion beyond consolidation range. Absence of large-bodied bearish candles or momentum breakdowns at lows suggests buyers remain engaged. |
| VOLATILITY & MOMENTUM | Compressed volatility; no momentum breakdown or expansion |
Stable but directionally uncertain
Range compression and declining volatility characteristic of trend stabilization rather than pre-reversal distribution. However, lack of decisive directional momentum means structure could resolve either toward trend resumption (higher yields) or deeper correction within the triangle boundaries. |
Monthly Chart — Regime Shift and Consolidation
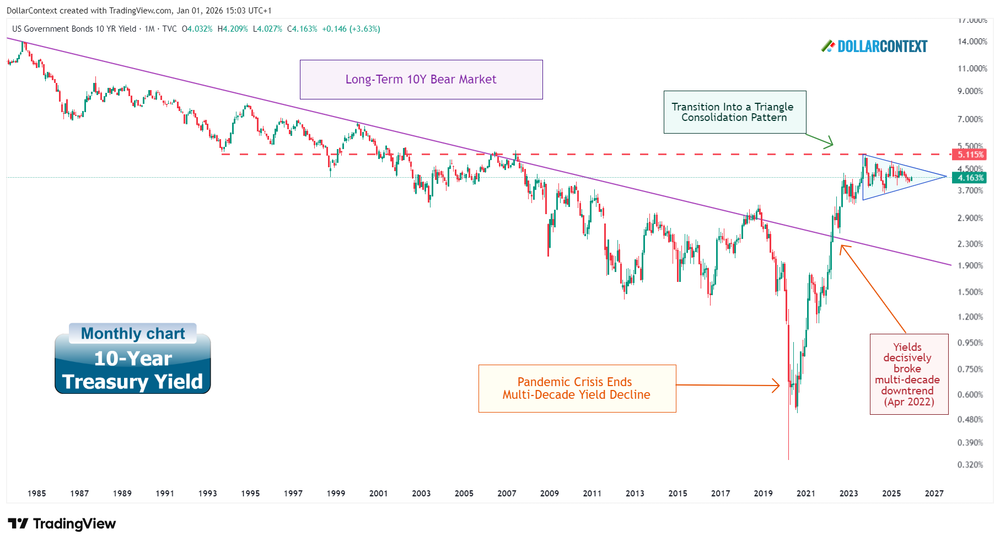
Viewed on a monthly logarithmic scale, the evolution of the 10-year U.S. Treasury yield can be divided into four structurally distinct phases.
Phase 1 — Long-term bear market in yields (1981—2020)
From the early 1980s through 2020, the 10-year Treasury yield followed a persistent and well-defined downward trend, commonly described as the secular bond bull market in price terms.
- This 39-year period reflected a disinflationary regime characterized by declining inflation expectations, falling real rates, and repeated monetary accommodation.
- On a monthly chart, this regime is clearly visible as a sustained sequence of lower highs and lower lows, reinforced by a multi-decade descending trendline.
The regime culminated during the 2020 pandemic shock, when aggressive monetary easing and crisis-driven risk aversion pushed Treasury prices to extremes and yields to historic lows.
Phase 2 — Structural inflection point (2020)
The year 2020 marked a structural inflection point rather than a cyclical fluctuation in yields.
- Extraordinary fiscal expansion combined with supply-side disruptions initiated a reversal in inflation dynamics.
- This shift was subsequently reinforced by a broad inflation cycle spanning 2021–2023.
Rather than a temporary spike, the post-2020 move represented the beginning of a new regime characterized by higher nominal rates and diminished disinflationary tailwinds.
Phase 3 — Trend confirmation (April 2022)
In April 2022, the 10-year yield decisively broke above its multi-decade downward trendline on a monthly closing basis, providing technical confirmation of the secular regime transition:
- This breakout ended the structural validity of the long-term disinflationary channel.
- It coincided with the market’s recognition that inflation pressures were not transitory.
From a structural perspective, this event marked the transition from a deflationary rate regime to an environment defined by structurally higher equilibrium yields.
Phase 4 — Consolidation within a higher-rate regime (October 2023—Present)
Since peaking in late 2023, yields have entered a consolidation phase rather than extending their prior advance. On the monthly chart, this has taken the form of a triangle consolidation pattern, where successive highs and lows converge toward a resolution point.
- The pattern reflects digestion of a rapid, multi-year repricing rather than trend exhaustion.
- Price action is compressing around a historically relevant resistance-turned-support zone.
Notably, this consolidation is occurring above the former multi-decade downtrend, suggesting acceptance of the new regime rather than rejection.
Key takeaway (monthly chart)
From a higher-timeframe perspective, the 10-year Treasury yield has transitioned from a completed multi-decade downtrend into a structurally higher-rate regime. The current consolidation represents stabilization and absorption of that shift, not evidence of a return to the pre-2020 disinflationary environment.
Weekly Chart — Triangle Formation Confirms Regime Stability
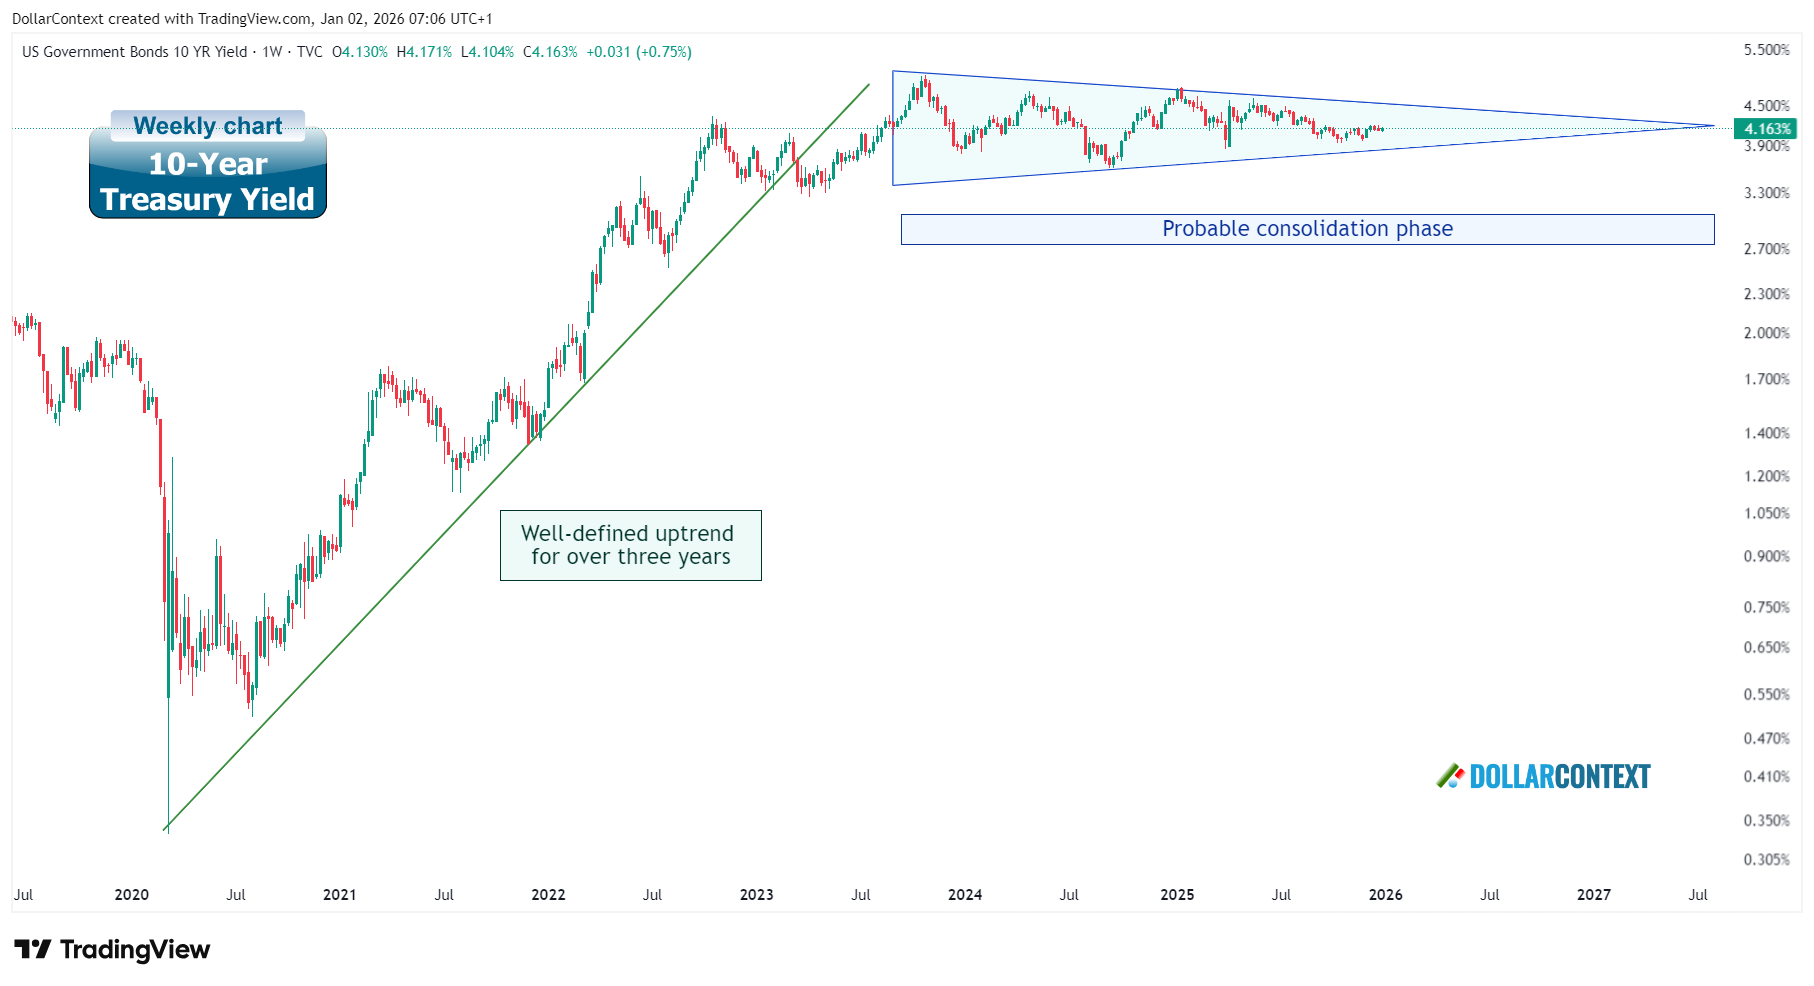
Triangle formation reflecting digestion, not distribution
On the weekly chart, the 10-year Treasury yield has shifted from impulsive repricing to a phase of range compression through a triangle formation:
- Following the sharp advance into late 2023, yields failed to extend higher but also avoided structural retracement.
- Price action has increasingly overlapped, with lower highs and higher lows forming a tightening range.
Importantly, downside attempts have lacked expansion or follow-through, suggesting that sellers are not regaining control.
This behavior is characteristic of consolidation after a regime shift, rather than early-stage trend failure.
Weekly candlestick behavior
Weekly candlestick structure further supports the interpretation of consolidation rather than breakdown.
- Downside tests have consistently been met with responsive buying, evidenced by long lower shadows, reversal formations, or strong bullish follow-through (e.g., April 2025), rather than sustained selling pressure.
- No sequence of large-bodied bearish candles has emerged to signal accelerating downside momentum.
- Volatility has compressed rather than expanded, consistent with regime stabilization.
From a candlestick perspective, the market continues to reject extremes rather than commit to a new directional leg.
Key takeaway (weekly chart)
The weekly chart reinforces the monthly message: the 10-year Treasury yield is consolidating within a structurally higher-rate regime. Price action reflects digestion and balance rather than distribution, with no technical evidence yet of a regime reversal.
Key Technical Levels
Confirmation of a secular regime shift
The long-standing downward trendline that defined yields from the early 1980s through 2020 was decisively broken in 2022. Maintaining sustained price action above this level is the key condition for confirming that a secular regime shift is firmly in place.
Triangle breakout mechanics
Triangle patterns typically break in the direction of the prior trend, with price targets estimated by projecting the pattern's widest range from the breakout point. Valid breakouts are confirmed by volume expansion and often retest the breakout level before continuing toward the target.
Confirmation of the multi-year uptrend
The resumption of the multi-year uptrend would require an upside breakout from the triangle, followed by a price advance that exceeds the projected target based on the triangle’s widest range. The final confirmation would come from the emergence of a sustained pattern of higher highs and higher lows on a monthly basis.
Key yield levels to monitor
Critical support converges near 3.94%—the triangle's lower boundary and the April 2025 bullish reversal low, where strong buying interest emerged. A sustained monthly close below this dual-support zone would question the regime shift. An upside breakout above the descending resistance (approaching 4.30-4.40%) would project toward 5.60-5.80% based on the triangle's measured range of approximately 1.3-1.4%.
The role and limitations of triangle chart formations
Triangle chart formations usually emerge during periods of consolidation within an established trend. They are often marked by pullbacks that attract strong buying interest. However, because triangle patterns can fail, these levels should not be treated as mechanical trading signals. Markets may produce false or even sustained breakouts against the prior trend, as consolidation patterns can resolve in either direction regardless of prior trend strength.
Technical Bottom Line
The 10-year Treasury yield appears to be consolidating within a structurally higher-rate regime, not reverting to pre-2020 disinflationary trends. Triangle formation reflects stabilization above the broken multi-decade downtrend, with the regime shift remaining valid unless yields sustain below 3.94% on a monthly closing basis. Directional resolution of the triangle will determine whether yields resume their uptrend toward 5.60-5.80% or correct deeper within the consolidation range.
🎯 Final Verdict
Our comprehensive analysis across four key dimensions—domestic drivers, global factors, sentiment and positioning, and technical structure—reveals a clear directional bias for the 10-year Treasury yield, though near-term dynamics create potential for volatility in both directions.
Medium/Long-Term Outlook
Domestic fundamentals favor structurally higher yields. Massive fiscal deficits, persistent inflation above the Fed's target, and resilient economic growth all create upward pressure on yields as investors demand compensation for duration risk and fiscal sustainability concerns. These persistent upward pressures are unlikely to dissipate quickly, supporting the post-2020 regime shift toward higher equilibrium rates.
Global dynamics reinforce the upward bias. Foreign central banks are diversifying away from U.S. Treasuries toward hard assets, geopolitical tensions are failing to drive traditional safe haven flows, as evidenced by the dollar's weakening safe-haven status. The emerging cracks in the fiat monetary order create long-term uncertainty that manifests as higher risk premiums across sovereign debt markets, maintaining upward pressure on yields.
Technical structure confirms regime shift. The 10-year yield has decisively broken its multi-decade downtrend and is consolidating within a structurally higher-rate regime through a triangle formation. While this pattern can resolve in either direction, its position above the broken secular downtrend favors eventual resumption of the uptrend toward 5.60-5.80%.
Intervention risk remains a tail scenario. The possibility of direct government intervention to suppress yields—whether through yield curve control, direct purchases, or financial repression—represents a potential countervailing force worth monitoring. However, absent clear policy signals suggesting imminent intervention, this remains a plausible tail risk rather than a base case assumption that should override fundamental analysis.
Near-Term Tactical View
Updated: February 5, 2026
Extreme positioning creates two-way volatility potential. Record bond underweights and hyper-bull equity positioning create a contrarian setup where minimal selling pressure remains in Treasuries but substantial buying power sits on the sidelines. Any macro shock, volatility spike, or shift in growth expectations could force rapid defensive repositioning into bonds, compressing yields sharply despite bearish fundamentals.
However, potential dollar strength may offset positioning risks. Recent technical signals (DXY hammer at ~96 confluence support), cross-asset developments (Bitcoin correlation breakdown, gold's violent reversal), and positioning dynamics suggest the dollar may rally toward 104-106 over the next 2-3 months. Dollar strength through interest rate differential dynamics could provide temporary support for yields, potentially triggering modest yield increases rather than the sharp corrections that extreme positioning might otherwise produce.
These competing near-term forces—extreme positioning vulnerability versus potential dollar support—create genuine two-way risk over the next 2-3 months. Key levels to monitor: dollar breakdown below 95.5 would remove the support dynamic and potentially accelerate the yield compression scenario, while sustained dollar strength above 102 would reinforce the yield support thesis.
📝 Update History
- February 5, 2026: Added Near-Term Tactical View section reflecting potential dollar rally dynamics
- February 1, 2026: Initial publication
This analysis reflects market conditions and information available at the time of publication. It is provided for informational and educational purposes only and does not constitute financial, investment, or legal advice.
The financial markets are inherently volatile, and past performance is never a guarantee of future results. Readers should conduct their own independent research or consult with a licensed professional before making any investment decisions. Any actions taken based on the content of this report are at the sole discretion and risk of the reader, and the author assumes no liability for any potential losses or damages.