10-Year Treasury Yield Deep Dive: Structural Shift, Regime Consolidation (January 2026 Analysis)
The 10-year U.S. Treasury yield has entered a structurally higher-rate regime after the post-2020 inflation shift. The key question now is whether consolidation reflects absorption—or the early signs of a deeper reassessment.
📊 DEEP DIVE ARCHIVE | Published: January 2, 2026
This is a comprehensive analysis from January 2026. For our current view on the 10-year Treasury yield:
→ 10-year Treasury Yield Hub Page
This archive piece remains valuable as a detailed framework reference and historical snapshot.
This post applies the regime-interpretation framework outlined in How Dollarcontext Interprets Markets to assess whether the macro regime identified in the recent S&P 500 outlook is being confirmed outside of equities.
Rather than introducing new assumptions, the analysis evaluates the behavior of the 10-year U.S. Treasury yield as a cross-asset validation tool. In a regime defined by structural inflation, policy patience, and fiscal constraints, interest rates should exhibit stability and consolidation rather than abrupt repricing. The focus is not on forecasting yield direction, but on assessing whether rate behavior remains consistent with regime continuity.
• Inflation is structurally higher than the pre-2020 norm
• Monetary policy prioritizes risk management over suppression
• Fiscal dynamics constrain extreme rate and currency outcomes
Executive Summary
-
🧭 Macro regime:
The post-2020 macro environment continues to support a structurally higher-rate regime, shaped by persistent inflation dynamics, fiscal constraints, and policy patience rather than aggressive tightening or rapid easing. -
🧠 Positioning & psychology:
Rate-market sentiment reflects acceptance without conviction—expectations have adjusted to higher yields, overall positioning remains flexible, and volatility remains episodic rather than disorderly. -
📈 Technical structure:
Higher-timeframe charts confirm a secular trend shift completed in 2022, with subsequent price action resolving through consolidation rather than reversal. -
⚖️ Structural context:
Following a rapid repricing phase, the market is now digesting higher yields through time, stabilizing above former secular resistance without signaling regime failure. -
🔎 What matters next:
The key question is not direction, but whether yields continue to hold above former multi-decade resistance zone as consolidation persists—or whether structural breaks force a reassessment of the current regime.
1. Macro Setup: Structural Inflation, Tactical Patience, and Rate Stability
Macro forces translated into direct implications for the 10-year U.S. Treasury yield, emphasizing constraints rather than narratives.
Within this framework, the prevailing macro environment continues to favor yield stability and range-bound behavior over directional repricing, consistent with a policy-patience regime.
1.1 Federal Reserve: Policy Patience, Not Policy Urgency
- The Federal Reserve currently exhibits policy patience, rather than urgency toward either tightening or easing.
- A dovish-leaning Fed leadership outlook reinforces expectations of inertia rather than directional commitment.
- Apparent labor-market softening may be demographic rather than cyclical:
- Aging workforce
- Lower net immigration
- Despite gradual cooling, labor conditions remain historically tight.
- Policy justification increasingly emphasizes risk management rather than inflation suppression.
10Y yield implication:
Policy patience reduces the likelihood of abrupt yield repricing, favoring consolidation within established ranges rather than trend acceleration.
1.2 Short-Horizon Inflation: Sticky, Tolerated, and Non-Accelerating
(Short-horizon ≠ temporary — this section addresses the Fed’s policy reaction window, not the long-term inflation regime.)
- Inflation remains above pre-2020 norms but is no longer accelerating sharply.
- The Fed tolerates inflation modestly above target as long as:
- Expectations remain anchored
- Financial conditions stay orderly
- This reflects a shift toward range-based tolerance rather than precision targeting.
10Y yield implication:
Sticky but stable inflation places a floor under yields, while policy tolerance limits upside repricing pressure.
1.3 Long-Term Inflation Cycle: A Structural Anchor for Yields
Beyond near-term policy tolerance, the post-2020 period likely marks a structural shift in the inflation regime.
- The end of the 40-year disinflation trend implies structurally higher equilibrium yields.
- Repeated expectations of a return to ultra-low rates have failed.
- 10-year yields have transitioned from trend behavior to range consolidation around higher levels.
Rates implication:
This regime anchors yields structurally above pre-pandemic norms, favoring stability over secular decline.
1.4 Fiscal Policy: A Volatility Dampener at the Long End
- Large and persistent deficits raise the political cost of sustained restrictive policy.
- Treasury issuance strategy increasingly emphasizes:
- Bill issuance
- Maturity smoothing
- Term-premium containment
- This creates implicit coordination without formal policy alignment.
10Y yield implication:
Fiscal dynamics act as a stabilizing force, reducing long-end volatility without requiring rate cuts.
1.5 Growth Backdrop: Supportive but Non-Inflationary
- Growth remains resilient, though increasingly uneven.
- Employment and consumption show signs of moderation rather than collapse.
- Markets increasingly discount sustainability rather than headline strength.
10Y yield implication:
Growth momentum supports yields against aggressive declines while limiting upside repricing.
Macro Bottom Line for the 10-Year U.S. Treasury Yield
Taken together, the macro environment favors rate stability within a higher structural range. Policy patience, fiscal constraints, and a non-accelerating inflation backdrop reinforce consolidation rather than regime transition.
2. Market Positioning & Psychology: Acceptance Without Capitulation
Positioning and sentiment indicators translated into behavioral signals within the U.S. Treasury market.
Current rate-market psychology reflects acceptance and recalibration rather than fear-driven repricing, consistent with regime continuity.
Taken together, these indicators suggest a rate market that has recalibrated expectations without capitulating. Positioning reflects acceptance of a higher-for-longer environment, but without the fear, disorder, or forced de-risking that typically accompanies regime transitions.
2.1 Repricing Pressure Has Eased — Without a Reversal
Rate-market psychology has shifted from aggressive repricing to measured reassessment.
- Large speculative short positions in Treasuries have been reduced rather than violently unwound.
- Market participants appear more focused on carry, roll-down, and range management than directional bets.
- The absence of sharp reversals suggests repricing pressure has diffused rather than inverted.
Psychology implication for the 10Y yield:
Cooling repricing pressure supports consolidation, indicating digestion of higher yields rather than a transition toward aggressive easing expectations.
2.2 Headline Risk Is Absorbed, Not Amplified
The rate market continues to face overlapping uncertainty catalysts:
- Fiscal sustainability debates
- Policy-path ambiguity
- Geopolitical risks affecting inflation expectations
Despite this backdrop, reactions have remained measured and proportional.
Why this hasn’t translated into stress
- Volatility spikes remain short-lived.
- Liquidity conditions have not deteriorated materially.
- There is no evidence of forced liquidation or funding stress.
Positioning implication for the 10Y yield:
Headline risk may generate short-term fluctuations, but the absence of panic suggests moves are more likely to be mean-reverting rather than regime-defining.
2.3 Yield Acceptance Reflects Adjustment, Not Fear
Investors appear to have accepted a structurally higher yield environment, adjusting expectations rather than resisting them.
- Higher yields are increasingly viewed as carry opportunities, not warning signals.
- Demand for Treasuries reflects portfolio rebalancing, not crisis hedging.
- There is little evidence of flight-to-quality behavior typical of recessionary shocks.
Rate-market psychology implication:
This acceptance reinforces stability, as markets price persistence rather than volatility expansion.
Market Positioning Bottom Line for the 10-Year U.S. Treasury Yield
Current rate-market psychology reflects acceptance without capitulation. Participants have adjusted to a higher structural yield environment, but without fear-driven positioning, liquidity stress, or disorderly repricing. This psychological backdrop reinforces macro stability rather than undermining it, supporting consolidation and range persistence over abrupt regime shifts.
3. Technical Structure & Candlestick Confirmation
Structural Validation Across Monthly and Weekly Timeframes
While positioning and sentiment suggest acceptance without conviction, higher-timeframe price structure provides the objective test: whether the post-2020 higher-rate regime is being absorbed through consolidation — or challenged through structural rejection.
3.1 Monthly Chart — Secular Regime Shift, Now Consolidating
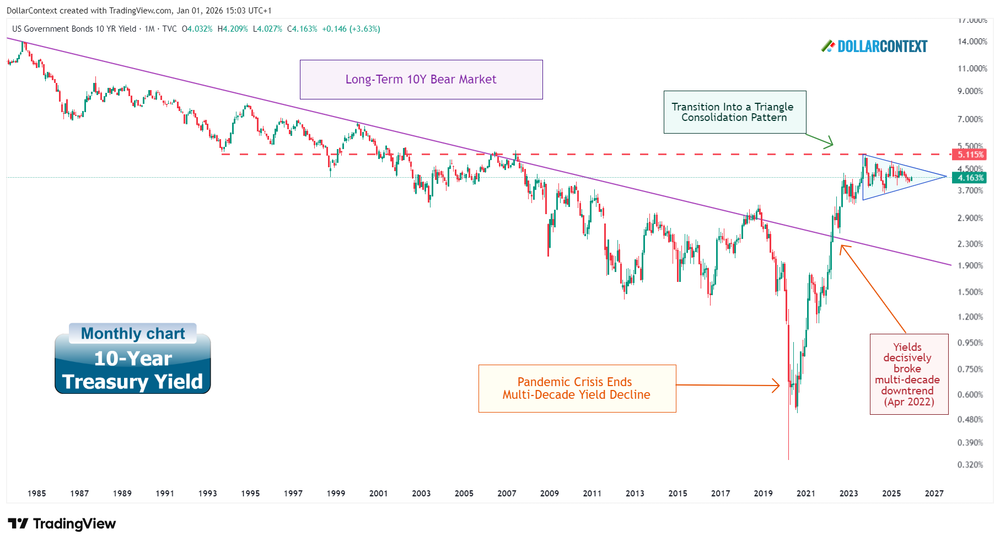
Viewed on a monthly logarithmic scale, the evolution of the 10-year U.S. Treasury yield can be divided into four structurally distinct phases, each reflecting a different macro regime rather than short-term rate cycles.
Phase 1 — Long-Term Bear Market in Yields (1981–2020)
From the early 1980s through 2020, the 10-year Treasury yield followed a persistent and well-defined downward trend, commonly described as the secular bond bull market in price terms.
- This 39-year period reflected a disinflationary regime characterized by declining inflation expectations, falling real rates, and repeated monetary accommodation.
- On a monthly chart, this regime is clearly visible as a sustained sequence of lower highs and lower lows, reinforced by a multi-decade descending trendline.
The regime culminated during the 2020 pandemic shock, when aggressive monetary easing and crisis-driven risk aversion pushed Treasury prices to extremes and yields to historic lows.
Phase 2 — Structural Inflection Point (2020)
The year 2020 marked a structural inflection point rather than a cyclical fluctuation in yields.
- Extraordinary fiscal expansion combined with supply-side disruptions initiated a reversal in inflation dynamics.
- This shift was subsequently reinforced by a broad inflation cycle spanning 2021–2023.
Rather than a temporary spike, the post-2020 move represented the beginning of a new regime characterized by higher nominal rates and diminished disinflationary tailwinds.
Phase 3 — Trend Confirmation (April 2022)
In April 2022, the 10-year yield decisively broke above its multi-decade downward trendline on a monthly closing basis, providing technical confirmation of the secular regime transition.
- This breakout ended the structural validity of the long-term disinflationary channel.
- It coincided with the market’s recognition that inflation pressures were not transitory.
From a structural perspective, this event marked the transition from a deflationary rate regime to an environment defined by structurally higher equilibrium yields.
Phase 4 — Consolidation Within a Higher-Rate Regime (October 2023–Present)
Since peaking in late 2023, yields have entered a consolidation phase rather than extending their prior advance. On the monthly chart, this has taken the form of a triangle consolidation pattern.
- The pattern reflects digestion of a rapid, multi-year repricing rather than trend exhaustion.
- Price action is compressing around a historically relevant resistance-turned-support zone.
Importantly, this consolidation is occurring above the former multi-decade downtrend, suggesting acceptance of the new regime rather than rejection.
From a higher-timeframe perspective, the 10-year Treasury yield has transitioned from a completed multi-decade downtrend into a structurally higher-rate regime. The current consolidation represents stabilization and absorption of that shift, not evidence of a return to the pre-2020 disinflationary environment.
3.2 Weekly Chart — Consolidation Behavior, Not Breakdown
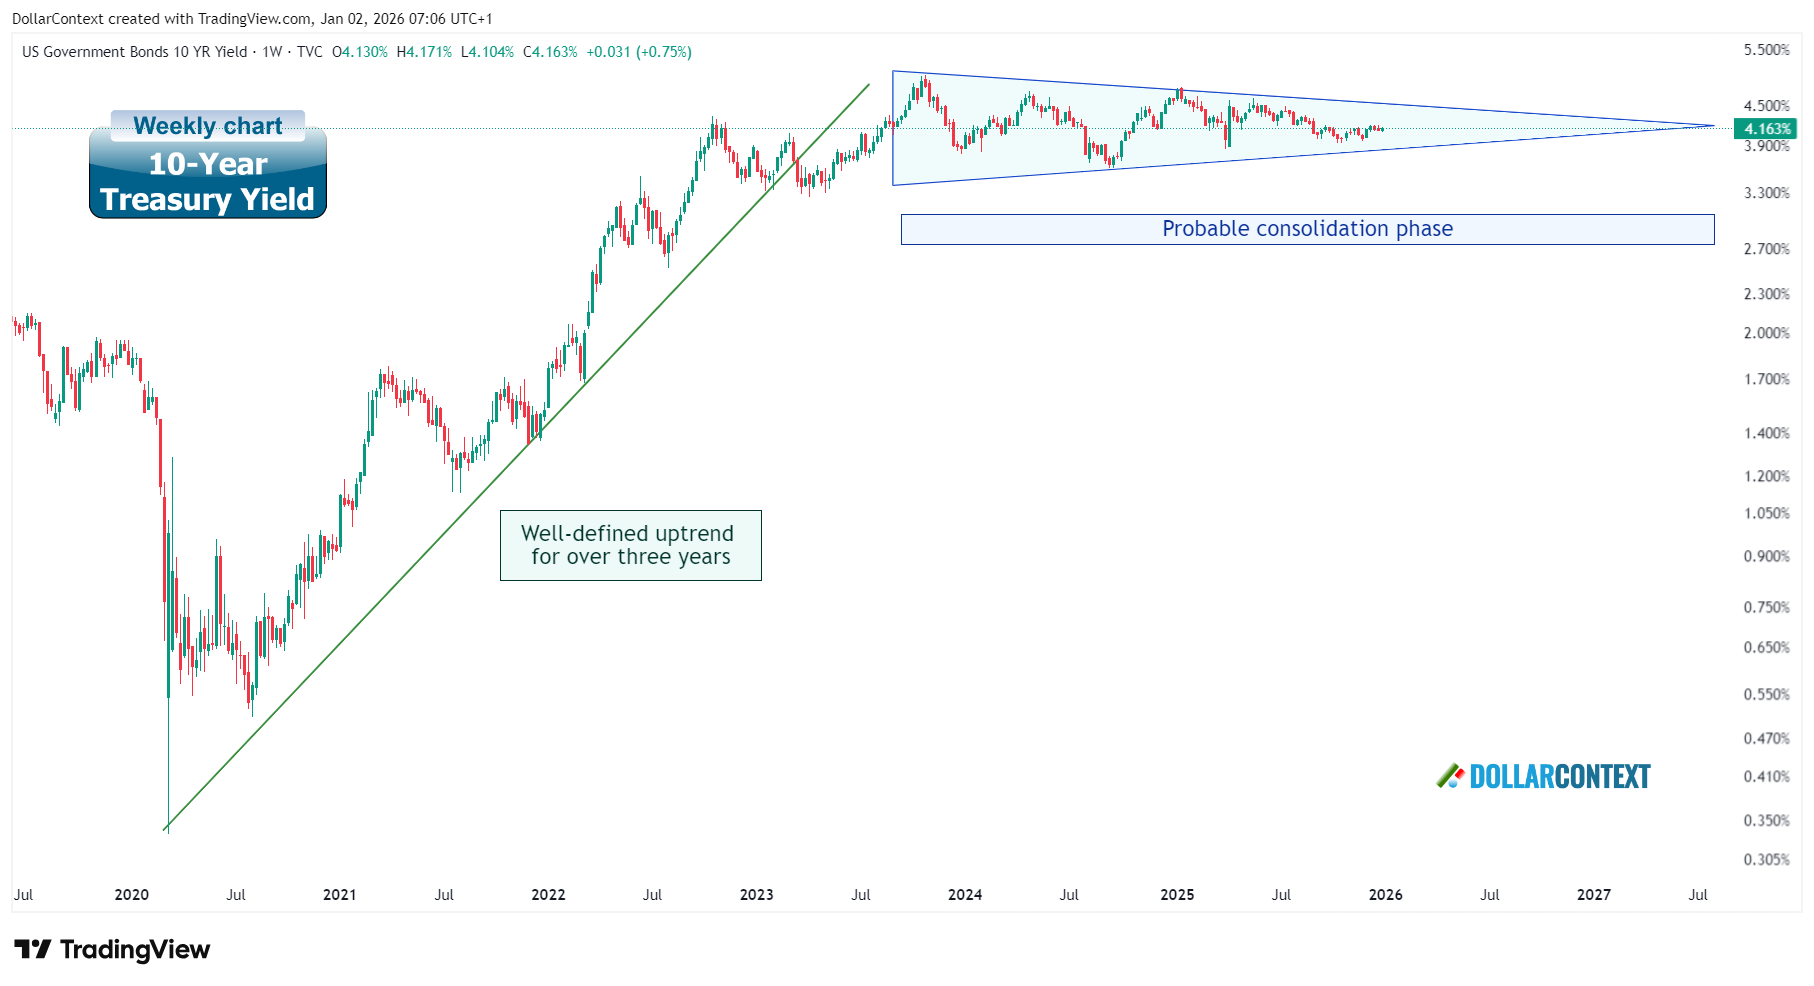
While the monthly chart establishes the secular regime shift, the weekly timeframe provides insight into how the market is currently absorbing that transition.
Weekly Structure Context
On the weekly chart, the 10-year Treasury yield has shifted from impulsive repricing to a phase of range compression and rotational price action.
- Following the sharp advance into late 2023, yields failed to extend higher but also avoided structural retracement.
- Price action has increasingly overlapped, with lower highs and higher lows forming a tightening range.
This behavior is characteristic of consolidation after a regime shift, rather than early-stage trend failure.
Triangle Formation — Digestion, Not Distribution
The developing triangle pattern on the weekly timeframe reflects indecision within acceptance, not a rejection of the higher-rate regime.
- Upper resistance has capped advances near prior cycle reference levels.
- Higher lows continue to form above the former long-term downtrend, reinforcing structural support.
Importantly, downside attempts have lacked downside expansion or follow-through, suggesting that sellers are not regaining control.
Weekly Candlestick Behavior
Weekly candlestick structure further supports the interpretation of consolidation rather than breakdown.
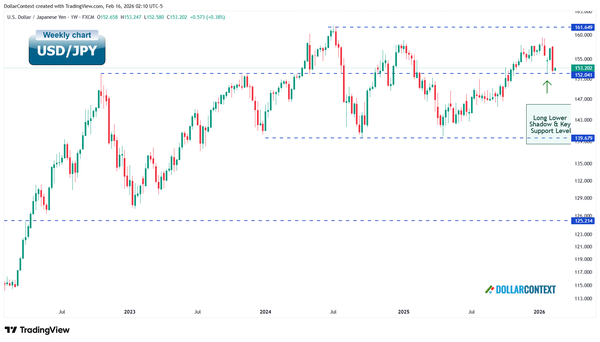
- Downside tests have consistently been met with responsive buying, evidenced by long lower shadows, reversal formations, or strong bullish follow-through (e.g., April 2025), rather than sustained downside expansion.
- No sequence of large-bodied bearish candles has emerged to signal accelerating downside momentum.
- Volatility has compressed rather than expanded, consistent with regime stabilization.
From a candlestick perspective, the market continues to reject extremes rather than commit to a new directional leg.
The weekly chart reinforces the monthly message: the 10-year Treasury yield is consolidating within a structurally higher-rate regime. Price action reflects digestion and balance rather than distribution, with no technical evidence yet of a regime reversal.
3.3 Key Structural Levels — Regime Validation, Not Trade Signals
After examining monthly and weekly structure, the technical picture of the 10-year Treasury yield resolves into a limited set of structural reference levels. These levels do not function as tactical triggers; their role is to define whether the current higher-rate regime remains intact or begins to deteriorate.
- Former multi-decade downtrend (now support): The downward trendline that governed yields from the early 1980s through 2020 was decisively broken in 2022. Sustained price action above this level remains the most important confirmation that the secular regime shift is intact.
- Upper consolidation boundary: The upper edge of the current triangle formation defines resistance within the consolidation. Interaction with this zone reflects digestion of higher yields rather than trend exhaustion.
- Lower consolidation boundary: Higher lows forming above the former downtrend define a critical structural floor. This zone has repeatedly absorbed downside pressure without triggering downside expansion.
From a regime perspective, invalidation would require more than volatility or temporary breaks. Specifically, a regime challenge would emerge only if:
- Sustained weekly and monthly closes occur below the former multi-decade downtrend, and
- Such breaks are accompanied by expanding real bodies and follow-through, rather than long lower shadows or compression.
As long as yields remain confined within these structural boundaries, price action should be interpreted as consolidation within a higher-rate regime, not as evidence of a return to the pre-2020 disinflationary environment.
Key levels in the 10-year Treasury yield define regime integrity rather than direction. Stability above former secular resistance, combined with contained consolidation, supports the view that the market is absorbing a structural shift rather than reversing it.
4. Scenarios & Regime Interpretation
Scenarios are interpretations, not forecasts — they define how to read structure under different conditions.
The 10-year Treasury yield is currently compressing within a higher-rate regime established after the post-2020 structural shift and the 2022 trendline break. The question is not what headlines will do next, but how this consolidation resolves structurally — and what that resolution implies about regime continuity.
4.1 Base Case — Consolidation as Regime Absorption
In the base case, yields continue to digest the prior repricing through time rather than price. The triangle persists as a stabilization phase, reflecting acceptance of the post-2020 higher-rate regime without forcing a directional repricing.
Defining characteristics:
- Compression persists with overlapping weekly candles and limited directional follow-through.
- Downside tests remain contained above key structural reference zones.
- Rate volatility remains elevated at times, but does not expand into sustained disorder.
Interpretation:
This outcome implies that markets are adjusting to structurally higher yields while maintaining balance between inflation persistence and policy patience. In regime terms, consolidation is not “indecision” — it is absorption of a structural shift.
4.2 Continuation Within a Higher-Rate Regime
A continuation outcome becomes likely only if consolidation resolves with acceptance, not merely a brief overshoot. This would represent extension within the same post-2020 regime rather than the start of a new structural phase.
What would define this outcome:
- A decisive resolution of the consolidation boundary on a weekly closing basis.
- Expanding weekly ranges with follow-through, indicating repricing rather than drift.
- Rate-market functioning remains orderly (no signs of liquidity stress or volatility regime change).
Interpretation:
This outcome would be consistent with sticky inflation expectations, an elevated term premium, and continued policy patience — a combination that allows yields to remain structurally higher even without renewed tightening urgency.
4.3 Structural Failure — Regime Reassessment Required
A bearish outcome requires more than volatility or temporary breaks. Structural failure would mean that the market is rejecting the post-2020 higher-rate regime — not simply retracing within it.
What would invalidate the current regime interpretation:
- Sustained weekly and monthly closes back below the former multi-decade downtrend that was broken in 2022.
- Downside expansion marked by large real bodies and follow-through, rather than long lower shadows or compression.
- Confirmation via a broader repricing of macro expectations (e.g., abrupt growth shock or forced policy shift).
Interpretation:
This scenario would signal a regime challenge — implying that the market is moving toward a lower-rate environment through structural repricing rather than normal consolidation. Until such conditions emerge, pullbacks and volatility should be interpreted as stress tests of structure, not proof of reversal.
Scenario Summary — What Matters Most
Across all scenarios, structure matters more than narratives:
- As long as consolidation remains contained above key structural zones, regime continuity is the default interpretation.
- Continuation requires acceptance and follow-through, not a single breakout week.
- Structural failure requires sustained breaks and downside expansion, not volatility spikes.
These scenarios translate the current consolidation into conditional paths. They do not predict direction; they define when the regime interpretation remains valid — and when it must be reassessed.
5. Practical Implications — How to Read Rates in the Current Regime
This section translates structure into interpretation, not trades.
The purpose of this section is to clarify how the macro, psychology, and technical conclusions of this analysis should inform the way the 10-year U.S. Treasury yield is interpreted within portfolios and macro narratives. It is not a guide for timing, positioning, or forecasting.
5.1 How to Interpret Yield Fluctuations
Within a structurally higher-rate regime, yield movements should be evaluated primarily as tests of acceptance, not as signals of imminent regime change.
- Moves occurring within the consolidation range reflect digestion of the post-2020 repricing.
- Volatility driven by headlines or data surprises should be interpreted as stress tests of structure, not as directional statements.
- Absent structural breaks, fluctuations are more likely to be mean-reverting than regime-defining.
Volatility without structural damage is information, not a warning.
5.2 How to Think About Rate Exposure
The current environment does not favor extreme duration positioning in either direction. Instead, it rewards regime awareness and disciplined expectation management.
- Assumptions anchored to a rapid return to pre-2020 yield levels are increasingly misaligned with structure.
- At the same time, the absence of trend acceleration argues against extrapolating higher yields mechanically.
- Exposure decisions should reflect acceptance of a higher equilibrium range rather than anticipation of a near-term directional resolution.
The regime favors stability over conviction and interpretation over prediction.
5.3 How to Use Technical Levels Going Forward
In this framework, technical levels function as regime checkpoints, not tactical triggers.
- As long as yields remain above former secular resistance, the higher-rate regime remains intact.
- Consolidation boundaries define balance, not opportunity.
- Only sustained structural breaks warrant reassessment of macro assumptions.
Levels define when to rethink the regime, not when to act.
5.4 What Would Force a Change in Interpretation
A shift from regime continuity to regime reassessment would require clear and persistent structural evidence.
- Repeated weekly and monthly closes back below former secular resistance.
- Downside expansion accompanied by volatility regime change.
- Macro developments forcing an abrupt repricing of growth or policy expectations.
Until such conditions emerge, the default interpretation remains unchanged.
Practical Bottom Line for the 10-Year U.S. Treasury Yield
The current environment calls for disciplined interpretation rather than directional conviction. The 10-year Treasury yield is consolidating within a structurally higher-rate regime, absorbing a multi-year repricing without signaling regime failure.
As long as structure holds, volatility should be treated as part of the adjustment process — not as evidence that the post-2020 regime is reversing.
Conclusion
The behavior of the 10-year U.S. Treasury yield provides a cross-asset confirmation of the macro regime outlined in the recent S&P 500 analysis. After a multi-decade disinflationary trend ended in 2020 and was technically confirmed in 2022, yields have transitioned into a structurally higher-rate environment. The subsequent consolidation reflects stabilization and absorption of that shift rather than rejection.
Market psychology reinforces this interpretation. Positioning and sentiment indicate acceptance and recalibration, not fear or forced de-risking. Volatility has been episodic and contained, and price behavior continues to reject extremes rather than accelerate toward a new regime.
From a structural perspective, higher-timeframe charts show no evidence that the post-2020 regime has failed. As long as yields remain above former secular resistance and consolidation persists without downside expansion, the dominant interpretation remains regime continuity.
Taken together, macro conditions, psychology, and technical structure argue against reactive interpretations of short-term fluctuations. The rate market is not signaling a return to the pre-2020 disinflationary environment, nor is it forcing an imminent directional resolution. Instead, it is digesting a structural transition.
Until price behavior provides clear evidence to the contrary, interpretation rather than prediction remains the appropriate lens — allowing structure, not narratives, to define when assumptions must be revisited.