CANDLESTICK
Case Study 0021: Spinning Tops, Dark Cloud Cover, and Long Red Real Body (AUD/USD)
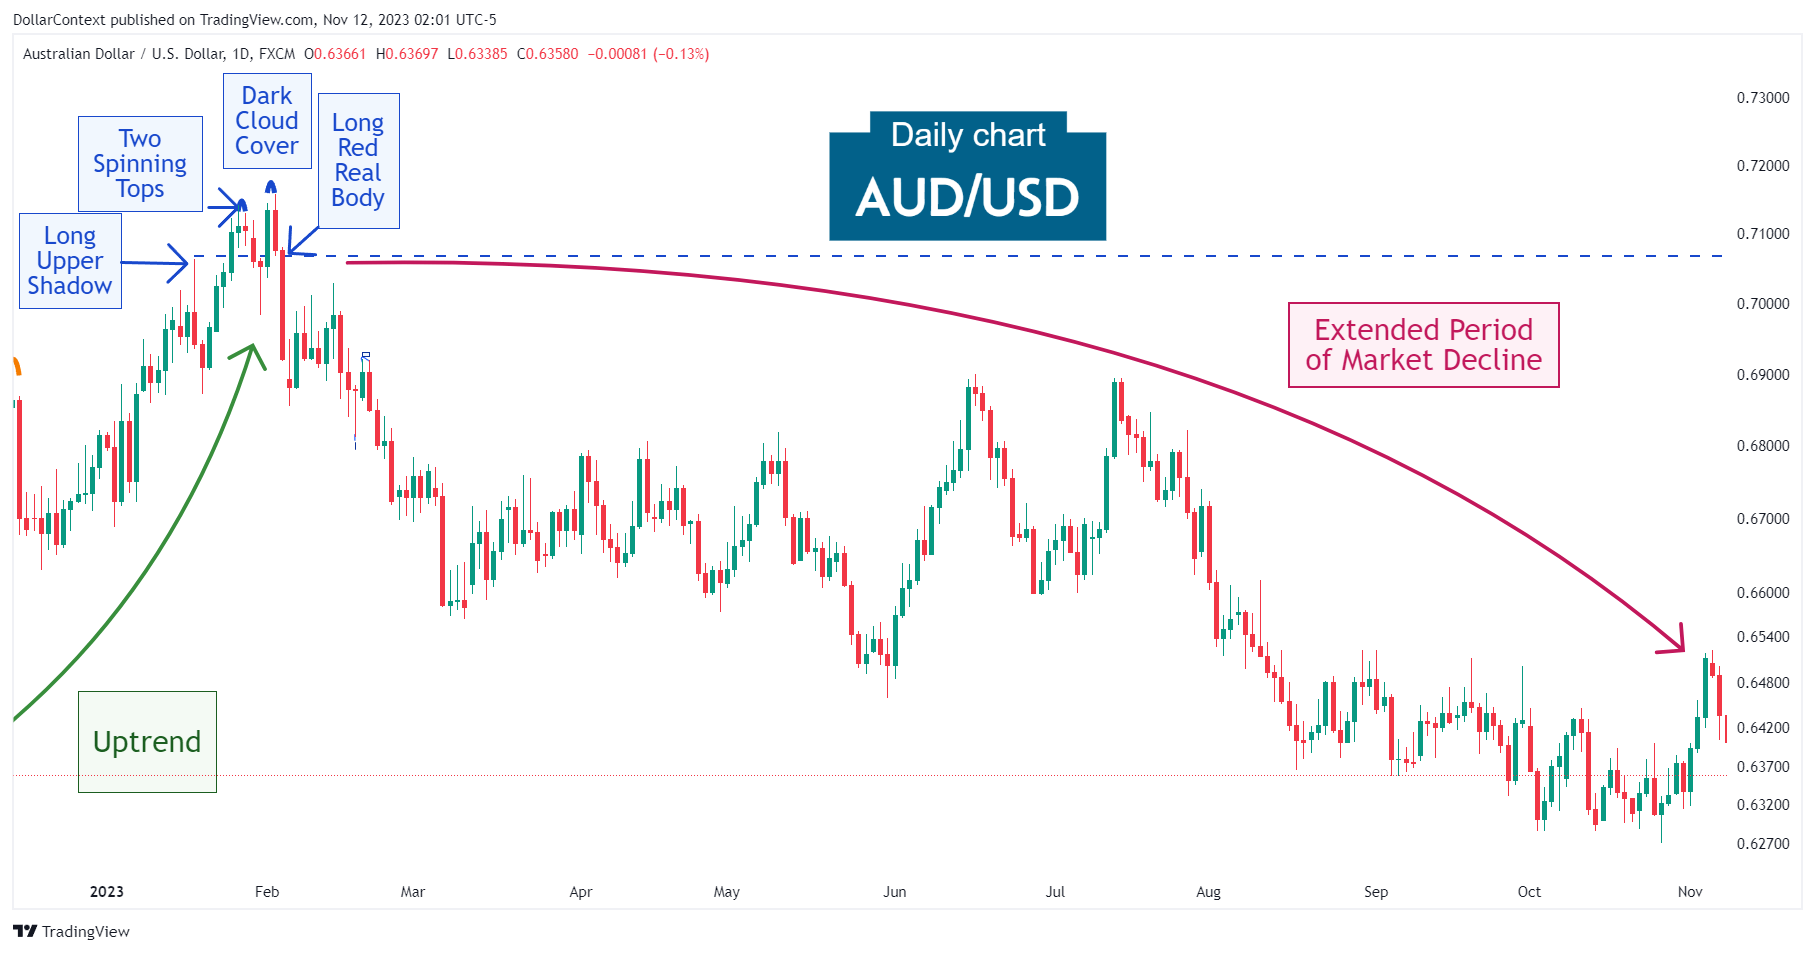
In this article, we will cover the performance of the AUD/USD after the emergence of a long upper shadow and a dark cloud cover.
CANDLESTICK
In this article, we will cover the performance of the AUD/USD after the emergence of a long upper shadow and a dark cloud cover.
CANDLESTICK
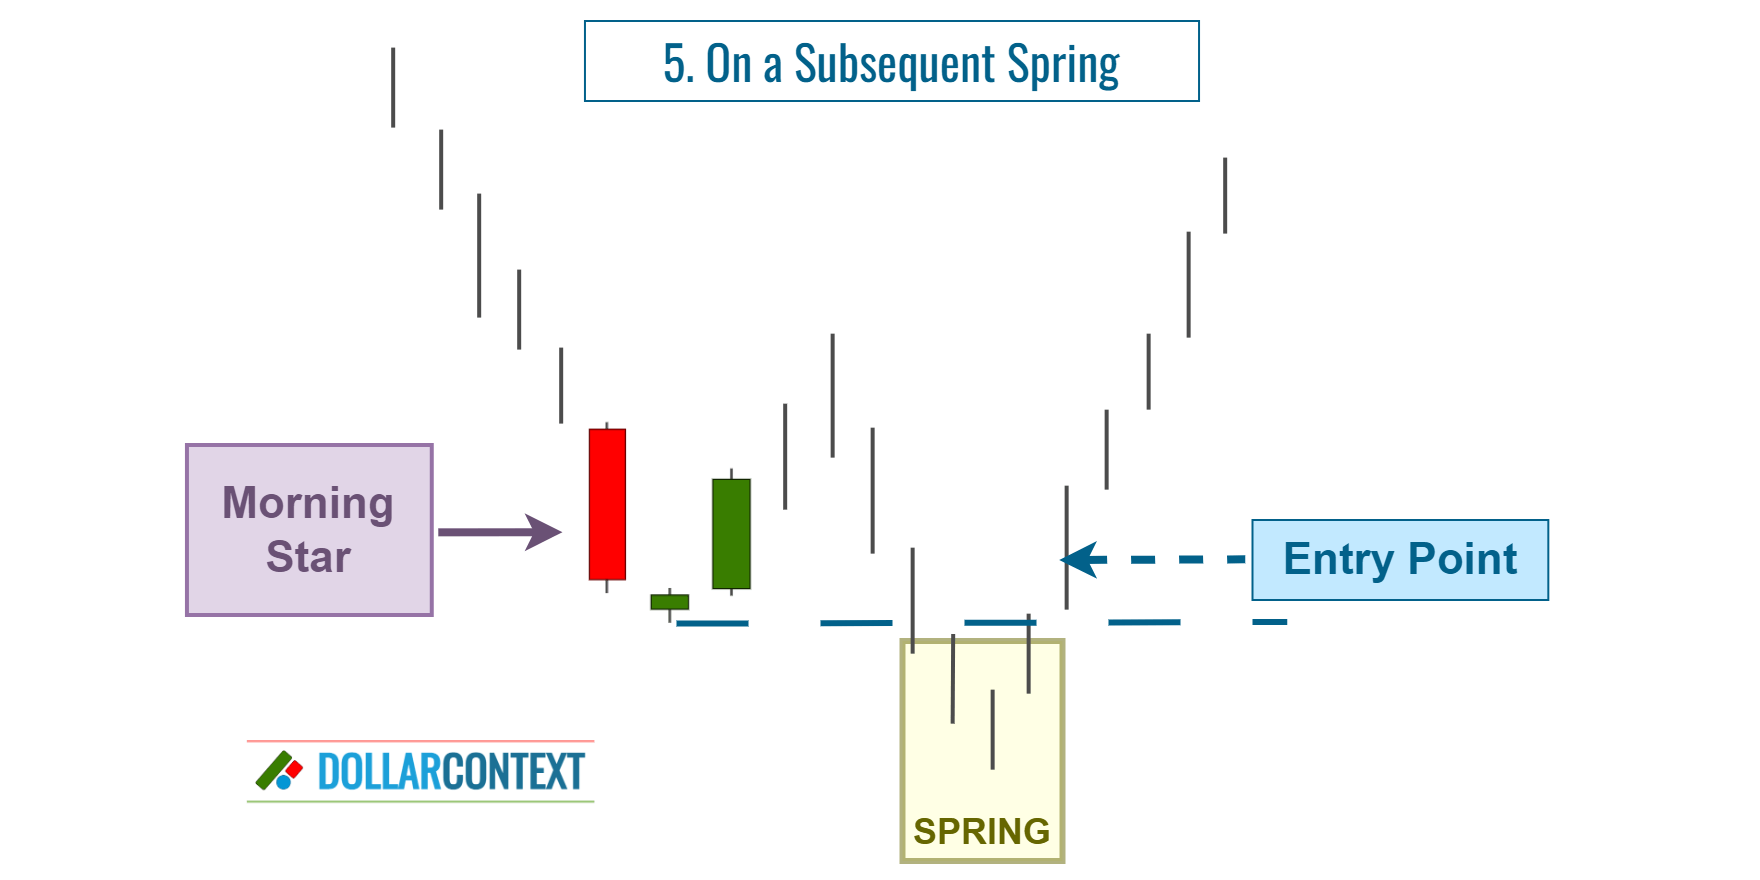
In this article, we'll discuss the different options for entry points after the appearance of a morning star pattern.
CANDLESTICK
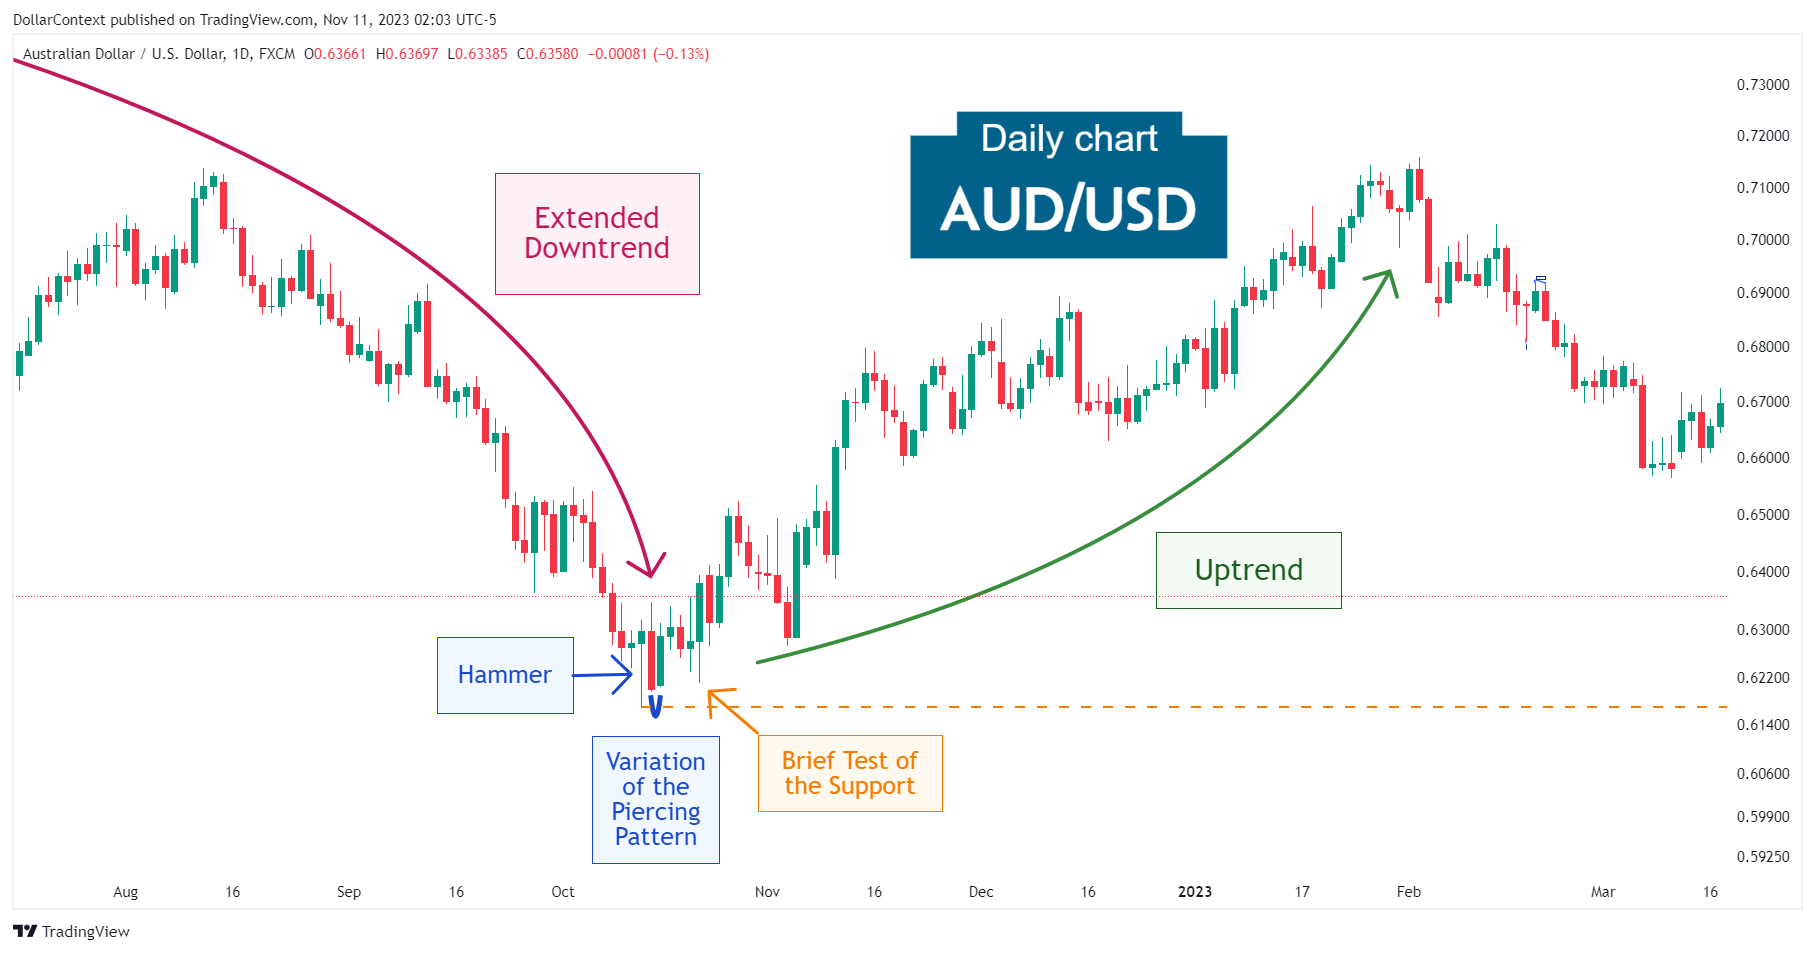
In this article, we will cover the performance of the AUD/USD after the emergence of a hammer and a piercing pattern.

CANDLESTICK
The psychology behind a morning star pattern reveals a shift in market sentiment from bearish to bullish, usually occurring after a downtrend.
CANDLESTICK
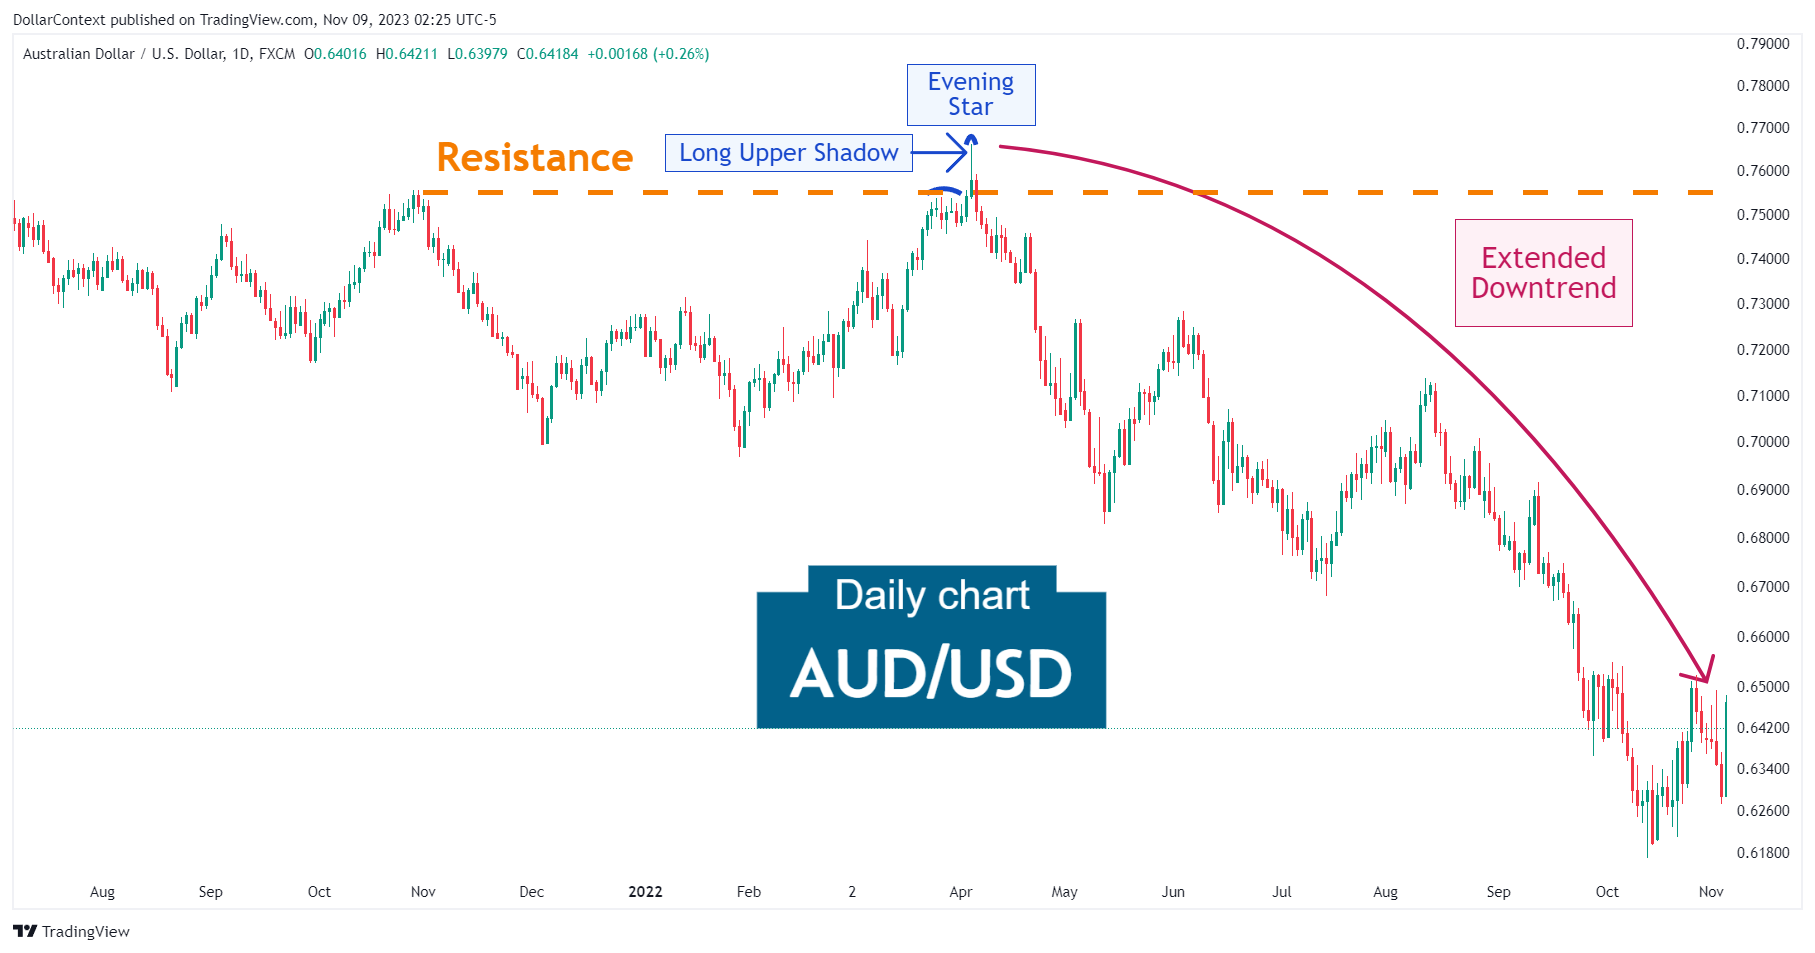
In this article, we will cover the performance of the AUD/USD after the emergence of a long upper shadow and an evening star pattern.
CANDLESTICK
In this article, we'll explore the layout of a morning star pattern in Japanese candlestick analysis and how to identify this bullish reversal indicator.
CANDLESTICK
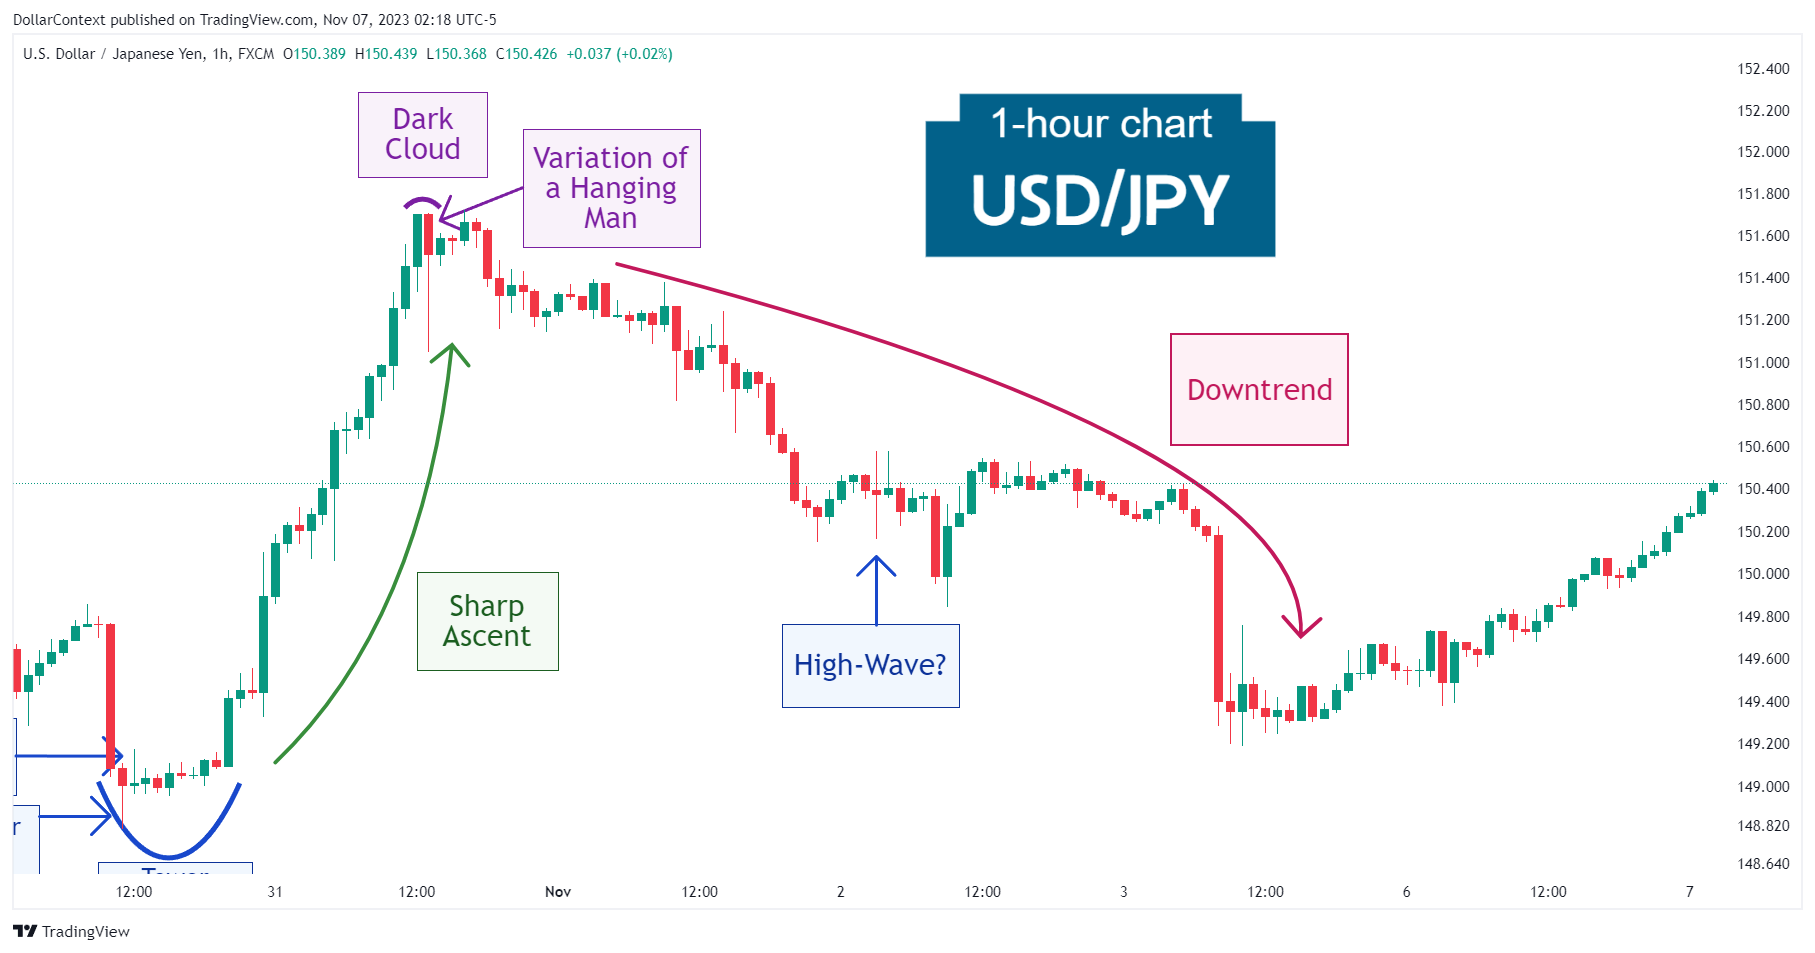
After a sharp rise of approximately 1.8 percent within an 18-hour timeframe, the USD/JPY presented a dark cloud cover and a hanging man candle line.
CANDLESTICK
In this tutorial, we explore the evening star, a three-candle formation found in the rich tapestry of Japanese candlestick charting techniques.
CANDLESTICK
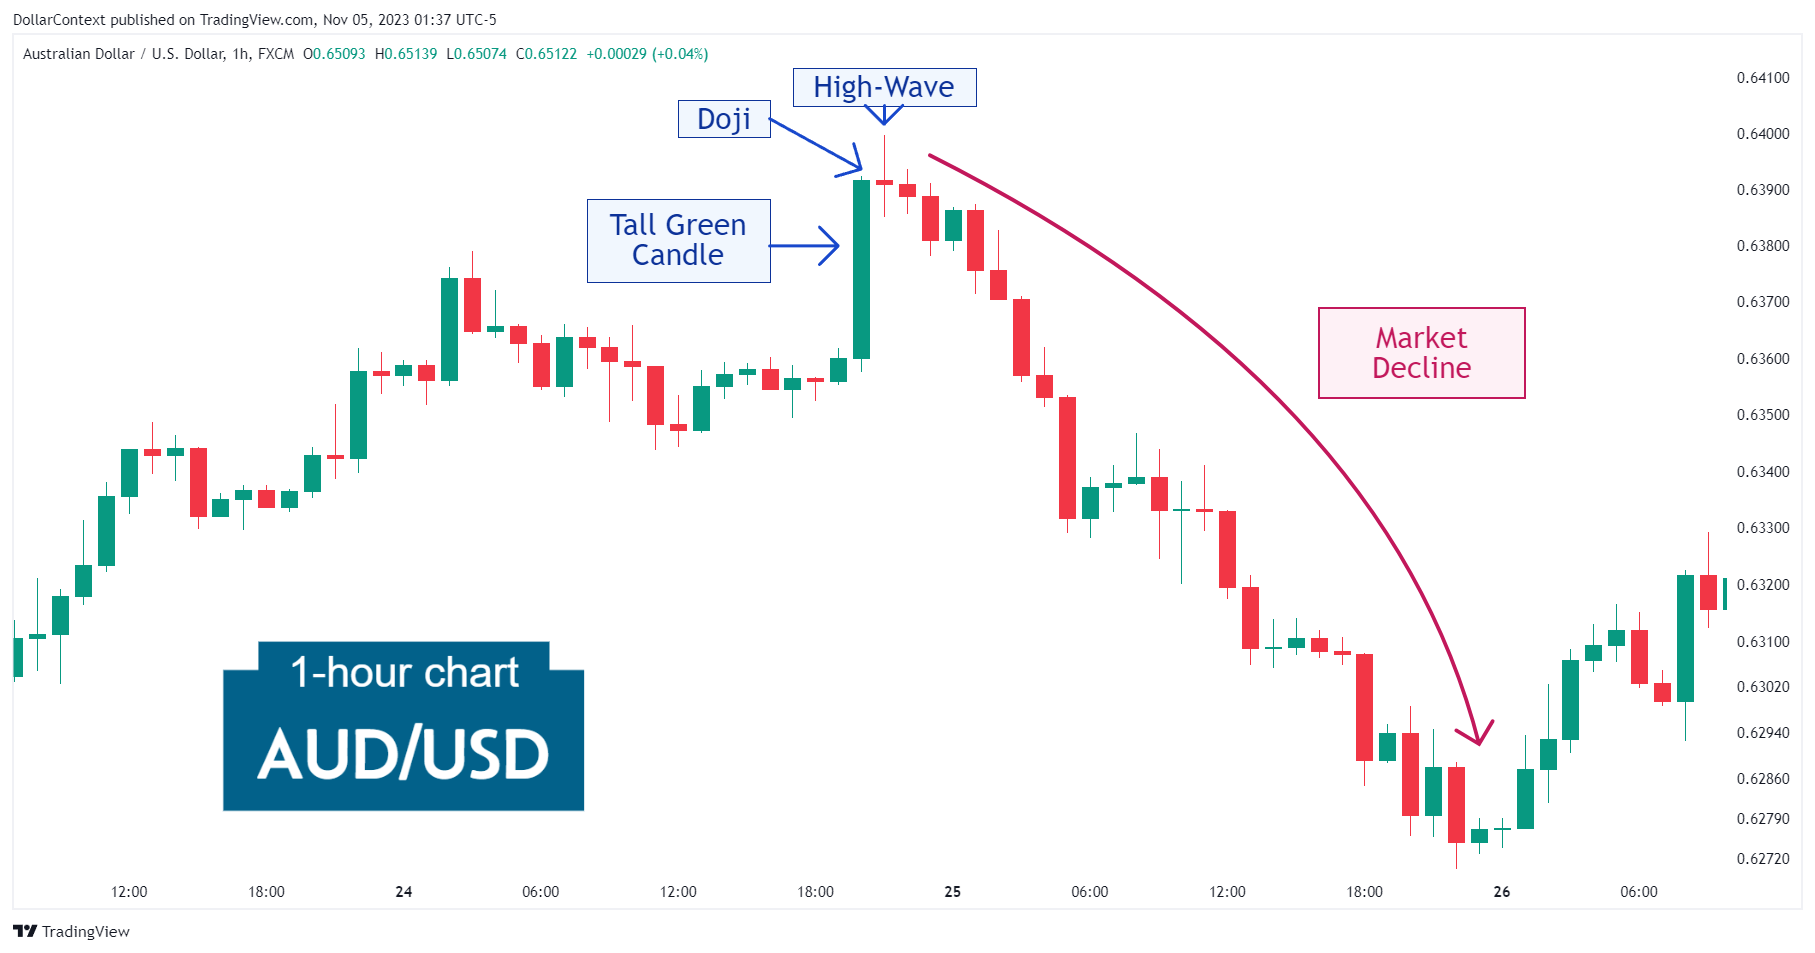
In this article, we will cover the performance of the AUD/USD after the emergence of a high-wave pattern.

CANDLESTICK
This article covers the criteria and conditions to qualify an evening star pattern as a reversal indicator.
CANDLESTICK
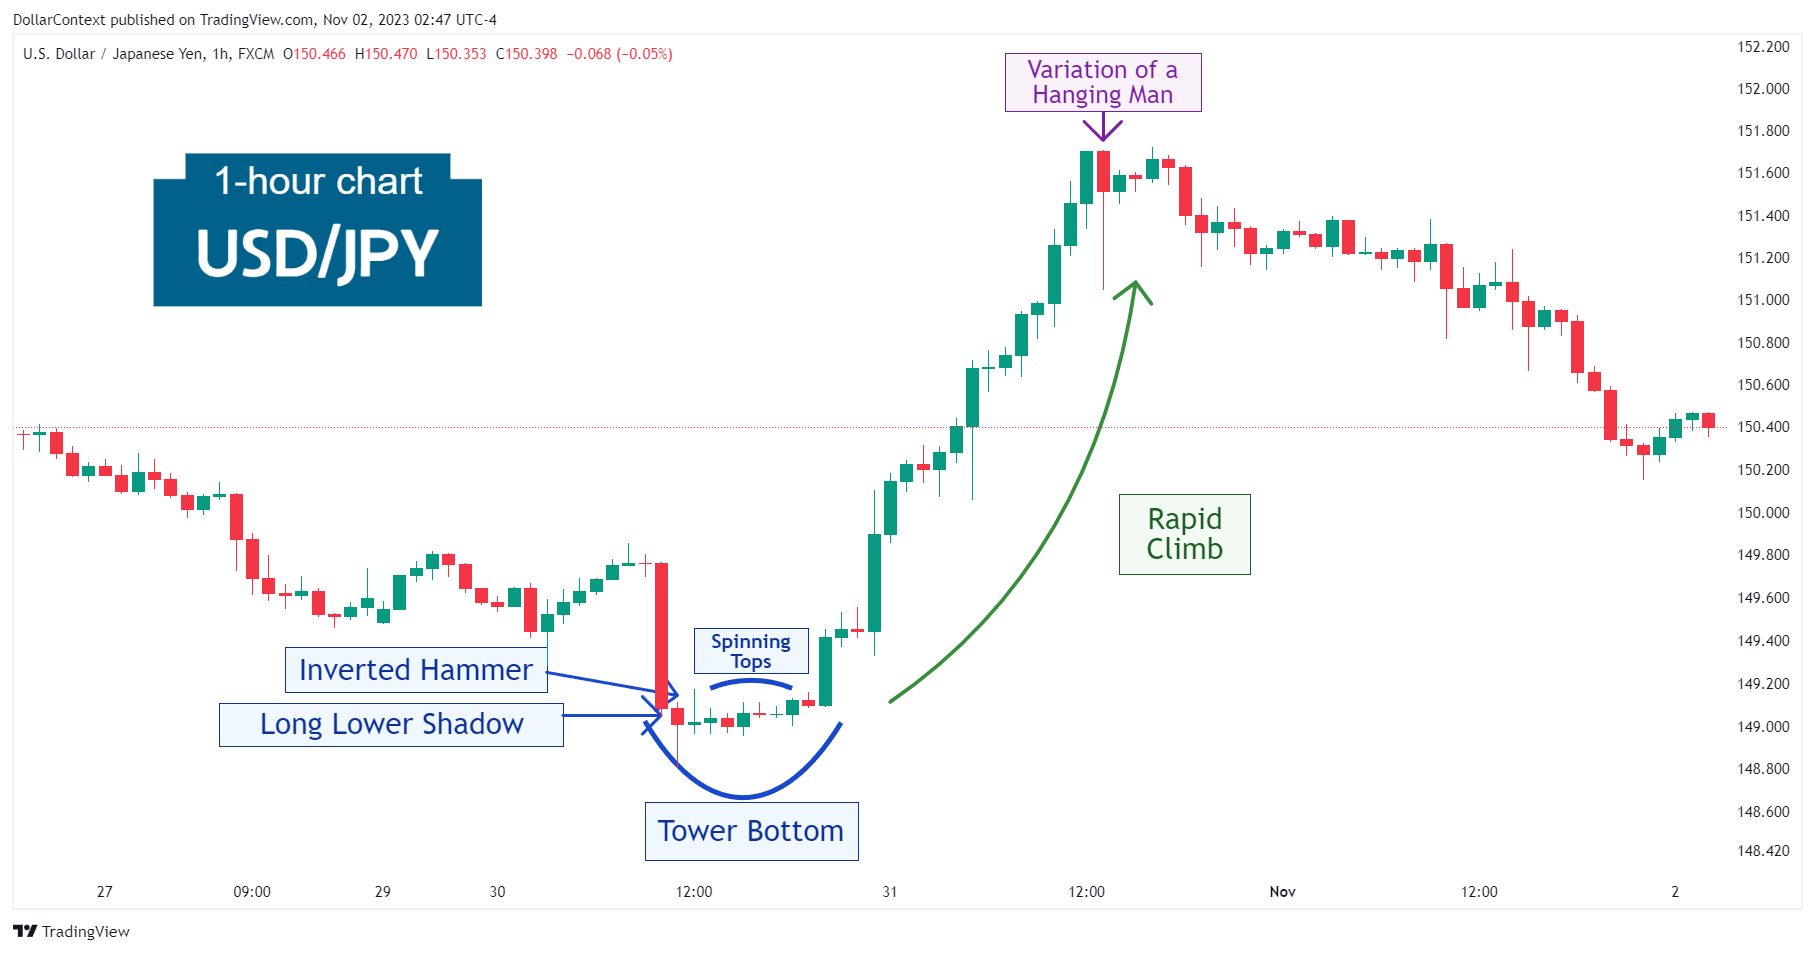
After a decline, the USD/JPY displayed a tower bottom. Then the market exploded to the upside, signaling robust buying pressure.
CANDLESTICK
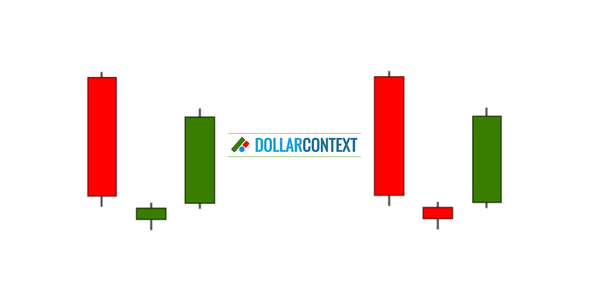
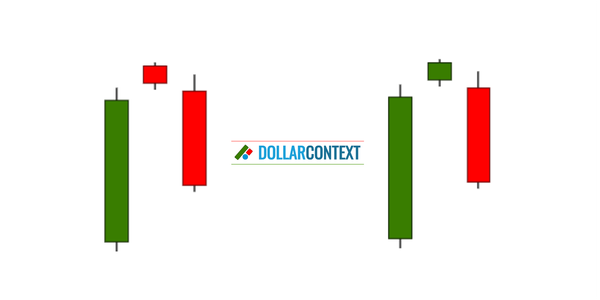
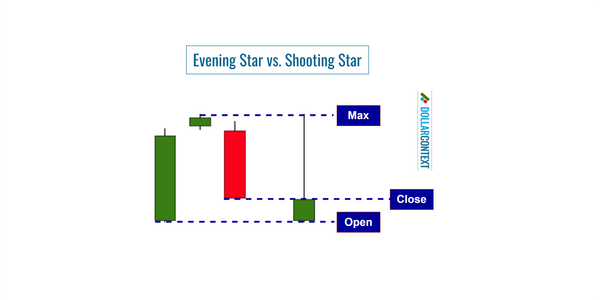
The configuration of an evening star has resemblances to other candlestick patterns, including the shooting star, the tower top, and the doji.