Bitcoin: Comprehensive Review and Outlook
Bitcoin faces severe technical damage after a ~50% drawdown broke its multi-year ascending trendline. Key narratives are undermined, institutional conviction is shallow, and the 200-week moving average bounce remains unconfirmed. Supply dynamics provide a floor, but not a catalyst.
✅ Last Reviewed: | 📝 Last Updated: | 📋 Full History →
Bitcoin at a Glance
Directional Pressure on Bitcoin:
ETF infrastructure in place, but flows reversing and adoption stalling
🌎 GLOBAL FACTORSKey narratives undermined, correlation breakdowns leave Bitcoin without macro identity
🧠 SENTIMENT & POSITIONINGPerceived crowding masks shallow institutional base, amplifying fragility
📈 TECHNICAL STRUCTUREMulti-year trendline broken, ~50% drawdown signals potential trend change
🎯 FINAL VERDICTStrategic (medium/long term)
Supply floor intact but technical damage severe, narratives broken, institutional conviction weak.
Tactical (near term)
Near-term direction uncertain after 200-week MA bounce. Break below would signal deeper structural damage.
〰️ Forces Shaping Bitcoin
Bitcoin faces a critical test in early 2026 following a sharp drawdown that began in October 2025. While structural factors—fixed supply, halving cycle completion, and institutional infrastructure—provide long-term support, near-term headwinds are significant. Correlation breakdowns with traditional assets, narrative erosion, and risk-off rotation have undermined Bitcoin's positioning at a moment when institutional adoption was supposed to be accelerating. From a macro perspective, Bitcoin appears to be discounting future market stress rather than reflecting current conditions.
| Component | Current Assessment |
|---|---|
| INSTITUTIONAL ADOPTION & ETF FLOWS |
Infrastructure in place, but flows reversing
|
| REGULATORY & POLICY ENVIRONMENT |
Improved clarity, but enforcement uncertainty remains
|
| USE CASES UNDER PRESSURE |
Price action contradicts key investment narratives
|
| CORRELATION BREAKDOWN WITH TRADITIONAL ASSETS |
Loss of narrative anchors creates directional uncertainty
|
🧠 Sentiment & Positioning
Bitcoin sentiment reveals a striking paradox: institutional investors label it the #3 most crowded trade yet hold virtually no exposure themselves. This disconnect between perceived positioning and actual allocation creates unusual dynamics where perceived crowding masks a lack of institutional conviction.
| Component | Current Assessment |
|---|---|
| Bank of America Global Fund Manager Survey Jan 2026 |
Crowding perception without institutional ownership creates vulnerability
|
| DAILY NEWS SENTIMENT INDEX (DNSI) |
Moderately positive sentiment, but relevance uncertain
|
📈 Technical Structure
Technical structure has deteriorated significantly since October 2025. A multi-year ascending trendline has been broken, a bearish reversal pattern confirmed at resistance, and the subsequent decline exhibited forced liquidation dynamics. The following analysis examines monthly and weekly charts to assess the damage and identify potential stabilization levels.
| Technical Factor | Current Status | Structural Signal |
|---|---|---|
| MULTI-YEAR ASCENDING TRENDLINE (2022-2025) | Decisively broken in November 2025 after holding through four prior corrections |
Structural floor removed, trend change risk elevated
The trendline that contained every correction since late 2022 has been broken. Price is now trading well below it, shifting the technical picture from "pullback within an uptrend" to "potential trend change." |
| DARK CLOUD COVER AT RESISTANCE | Bearish reversal pattern at $126,000 after multiple failed breakout attempts throughout 2025 |
Classic exhaustion signal confirmed by subsequent breakdown
The dark cloud cover at multi-test resistance signaled exhaustion of buying pressure. The pattern's bearish implications were validated by the ~50% decline that followed, suggesting this was a significant turning point rather than a routine pullback. |
| SPEED & MAGNITUDE OF DECLINE | ~50% drawdown from $126,000 to ~$60,000 |
Forced liquidation dynamics, not orderly profit-taking
Bitcoin didn't gradually correct—it collapsed through a support confluence and accelerated lower. This behavior is characteristic of crowded positioning unwinding under stress rather than healthy digestion of gains. |
| 200-WEEK MOVING AVERAGE REBOUND | Strong bounce from the 200-week MA; price recovering toward ~$68,500 |
Potential floor, but too early to confirm reversal
The 200-week moving average has historically acted as a major cycle support. The current bounce is encouraging but insufficient to confirm a trend reversal—it may represent a genuine bottom or a temporary relief rally before further downside. |
Monthly Chart — Multi-Year Trendline Structure and Break

Ascending trendline structure
A multi-year ascending trendline connecting major lows has provided critical support since late 2022. This trendline was tested repeatedly during corrections (December 2022, September 2023, August 2024, and April 2025) and held each time, establishing it as a key structural reference point.
The February 2026 drawdown has decisively broken this trendline, with price falling well below it. This break removes the structural floor that had contained every prior correction in this cycle, shifting the technical picture from "pullback within an uptrend" to "potential trend change."
Weekly Chart — Dark Cloud Cover Reversal and Trendline Break
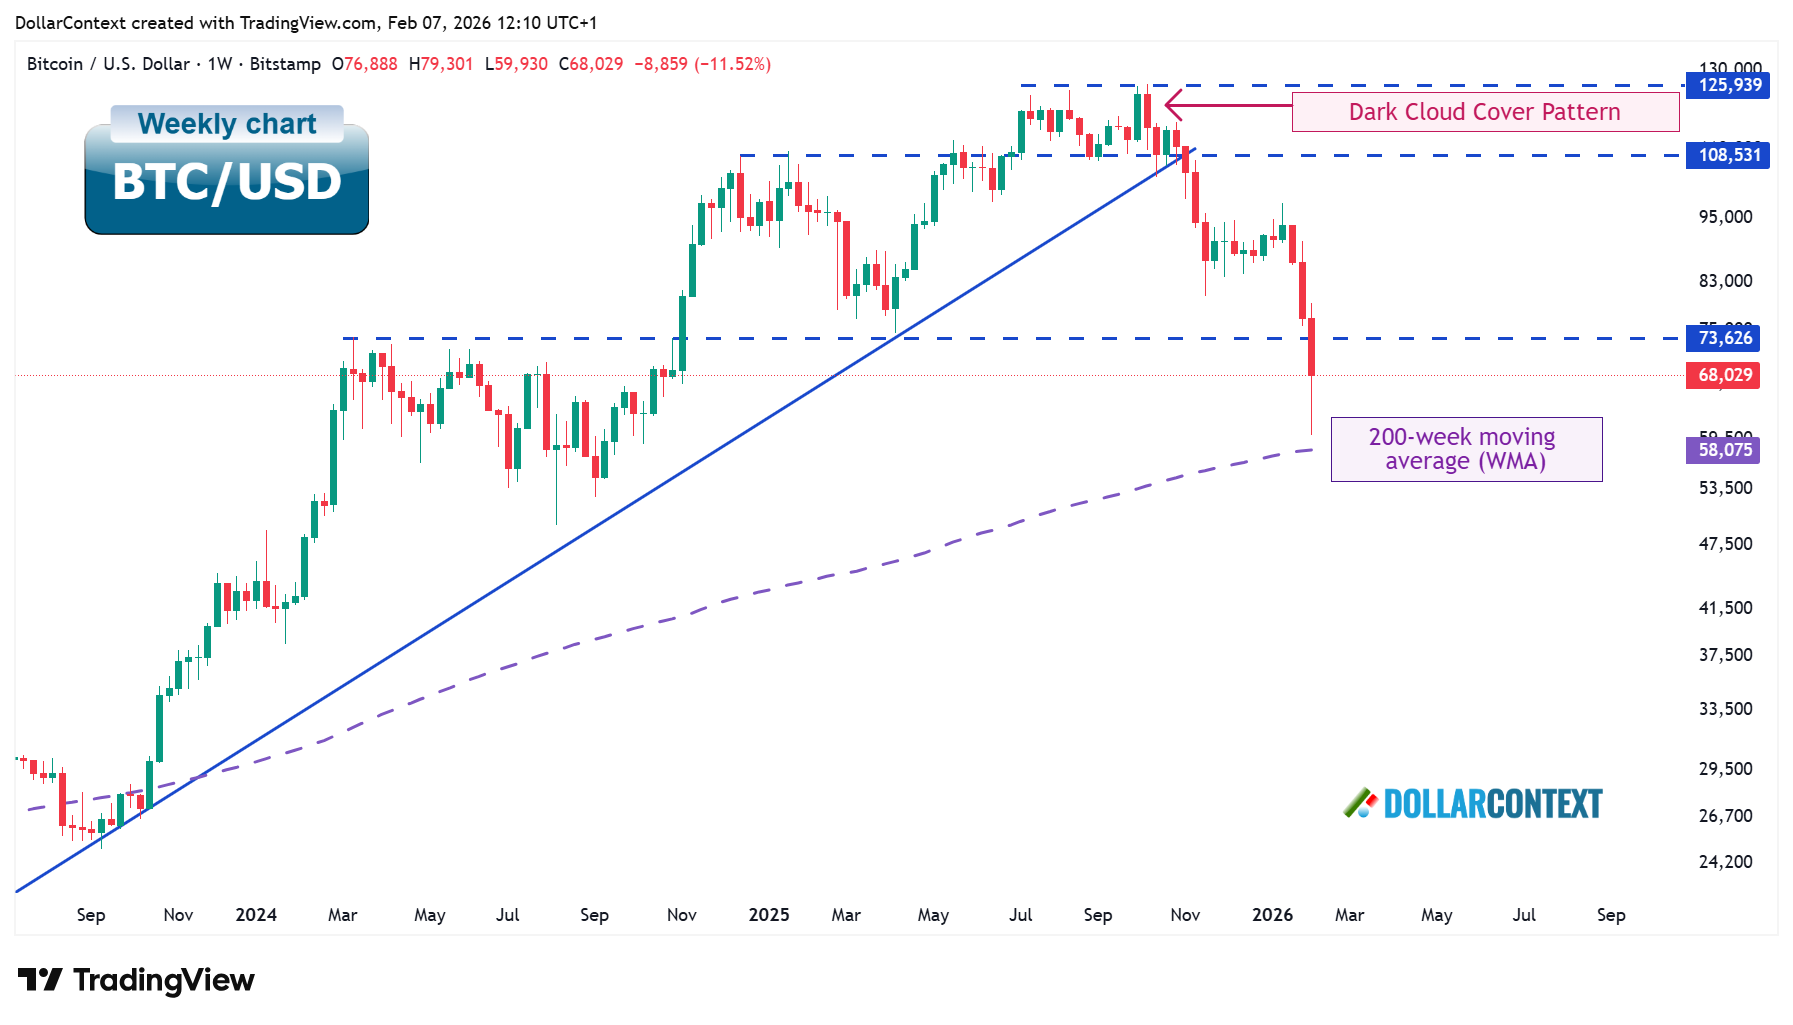
The weekly chart reveals how Bitcoin's disciplined 2024-2025 advance gave way to a bearish reversal and sharp decline.
Dark cloud cover reversal and breakdown (October 2025–Present)
In October 2025, Bitcoin formed a dark cloud cover candlestick pattern at the resistance zone near $126,000—a bearish reversal signal where price opens higher but closes deep into the prior candle's range, indicating rejection of higher prices and a shift in momentum:
- Bearish reversal at multi-test resistance: After several attempts to break above $126,000 throughout 2025, the dark cloud cover signaled exhaustion of buying pressure at these levels and marked a significant technical turning point.
- Sharp breakdown from consolidation: Following the reversal, Bitcoin didn't gradually correct—after a brief pause at a support confluence (ascending trendline and horizontal support), it broke down sharply from the $110,000-$125,000 range, declining approximately 50%. This speed and magnitude suggest forced liquidation rather than orderly profit-taking.
- Rebound from the 200-week moving average: Following the decline, Bitcoin has displayed a strong bounce from the 200-week moving average, though it is too early to determine whether this represents a genuine reversal or a temporary relief rally.
🎯 Final Verdict
Our comprehensive analysis across four key dimensions—domestic drivers, global factors, technical structure, and positioning—reveals a market under significant stress. While long-term structural factors remain intact, near-term dynamics are overwhelmingly challenging: technical damage is severe, key narratives have been undermined, and institutional conviction is shallow.
Medium/Long-Term Outlook
Supply dynamics provide a structural floor, but not a catalyst. The 2024 halving, fixed 21-million cap, and established ETF infrastructure form a durable long-term foundation. However, these factors alone cannot drive a recovery—they set a floor, not a direction.
Technical structure has shifted from supportive to damaged. The break of the multi-year ascending trendline, the confirmed dark cloud cover reversal at resistance, and a ~50% drawdown driven by forced liquidation mark the most significant technical deterioration since the 2022 bear market. Even if the 200-week moving average holds, rebuilding the prior trend structure will require months of base-building rather than a quick recovery.
Narrative erosion is the deeper concern. Bitcoin's failure to behave as "digital gold" during the 2024-2025 fiat skepticism wave, combined with correlation breakdowns across equities, gold, and the dollar, has left the asset without a clear macro identity. Until a coherent investment narrative re-emerges, institutional allocation frameworks struggle to justify meaningful exposure.
Regulatory progress is constructive but slow. Improved SEC posture and congressional momentum provide a more favorable backdrop than previous cycles, though global fragmentation and implementation timelines limit the near-term impact.
Near-Term Tactical View
Technical damage is severe and demands time to repair. The break of the multi-year ascending trendline—which held through four prior corrections—shifts the technical picture from "pullback within an uptrend" to "potential trend change." A ~50% drawdown driven by forced liquidation dynamics does not resolve quickly.
The 200-week moving average is the key level to watch. Bitcoin's bounce from this historically significant support is encouraging but unconfirmed. Holding above it keeps the long-term cycle structure intact; a sustained break below would signal deeper structural damage with limited clear support beneath.
Crowding without conviction amplifies fragility. Bitcoin is perceived as a crowded trade yet lacks deep institutional sponsorship. This means positioning is dominated by faster-moving flows that reverse quickly—providing little stability if the current bounce fails.
📝 Update History
- February 7, 2026: Initial publication
This analysis reflects market conditions and information available at the time of publication. It is provided for informational and educational purposes only and does not constitute financial, investment, or legal advice.
The financial markets are inherently volatile, and past performance is never a guarantee of future results. Readers should conduct their own independent research or consult with a licensed professional before making any investment decisions. Any actions taken based on the content of this report are at the sole discretion and risk of the reader, and the author assumes no liability for any potential losses or damages.