Case Study 0013: Various Long Lower Shadows Herald a Bottom (Natural Gas)
In this article, we will examine the performance of the natural gas market after the emergence of a series of long lower shadows.
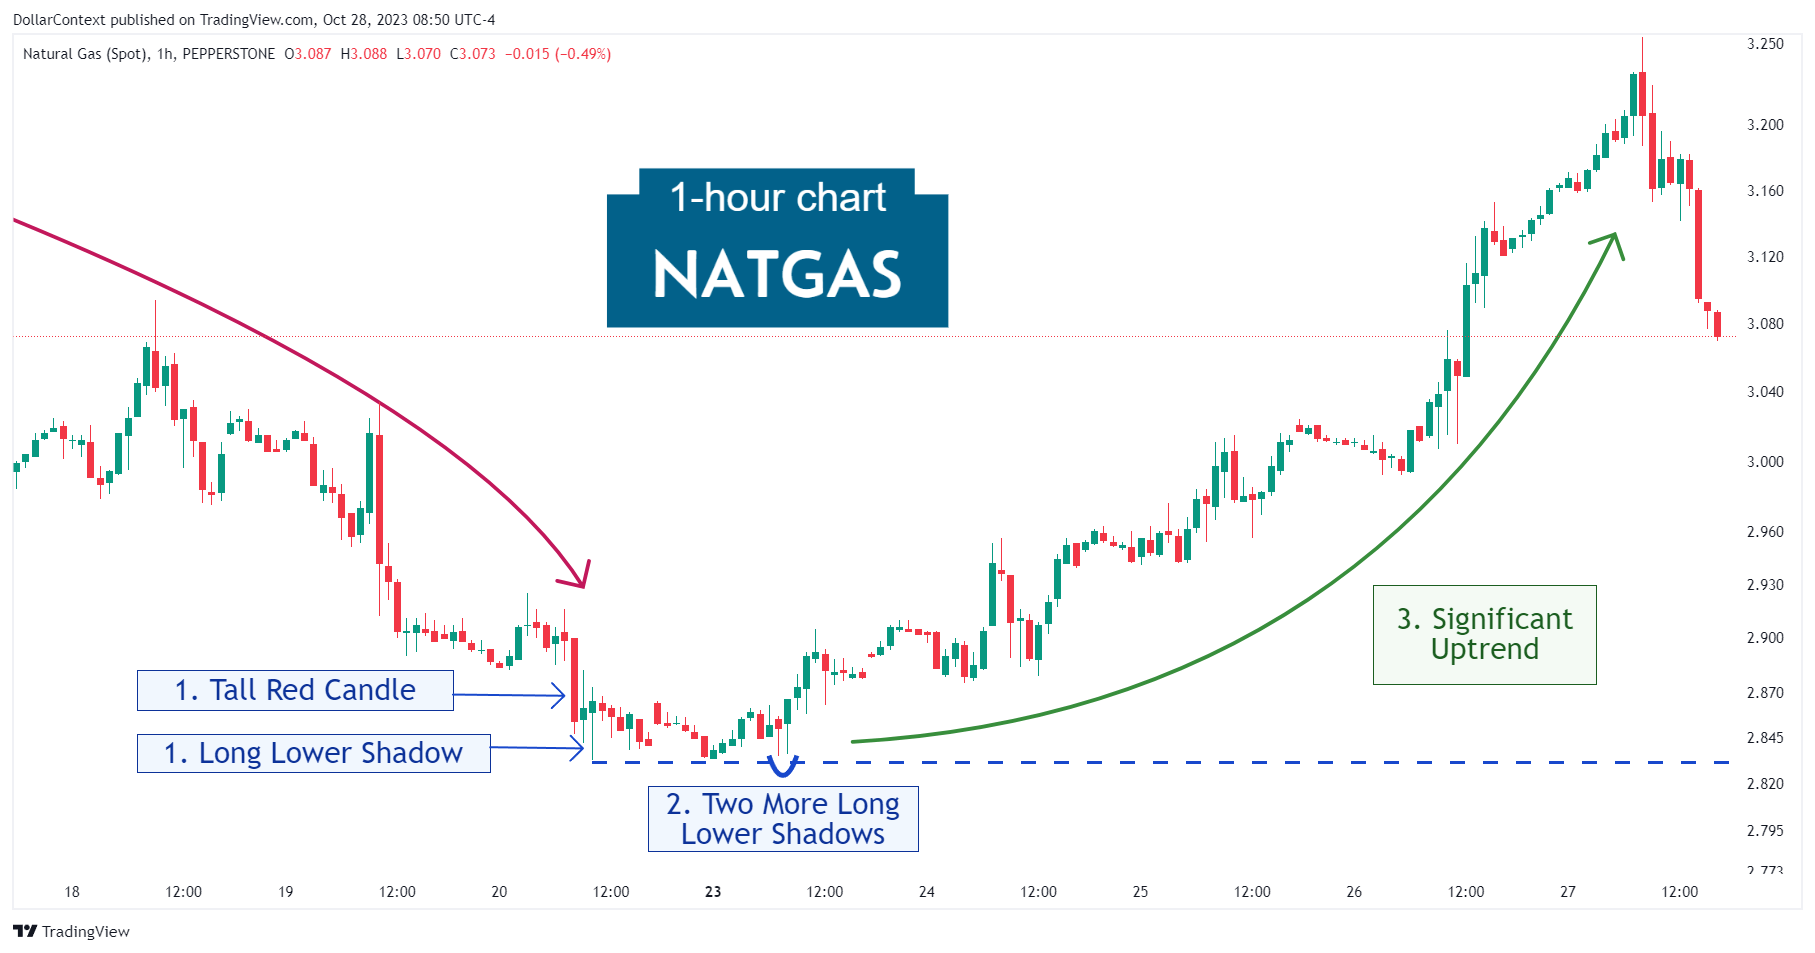
This case study examines a historical market setup observed in Natural Gas in October 2023. It is intended for educational purposes and illustrates how specific candlestick patterns behaved in real market conditions.
Case Study Data Sheet (Historical)
- Reference: CS0013
- Security: Natural Gas
- Timeframe: Hourly Chart (October 20, 2023)
-
Patterns:
- Long Lower Shadow
- Hammer
1. Signal Formation
After a sustained downtrend, the natural gas market displayed a long lower shadow session preceded by a tall red candlestick. Because the small body of the session is near the upper end, the long lower shadow can also be viewed as a variation of the hammer pattern.
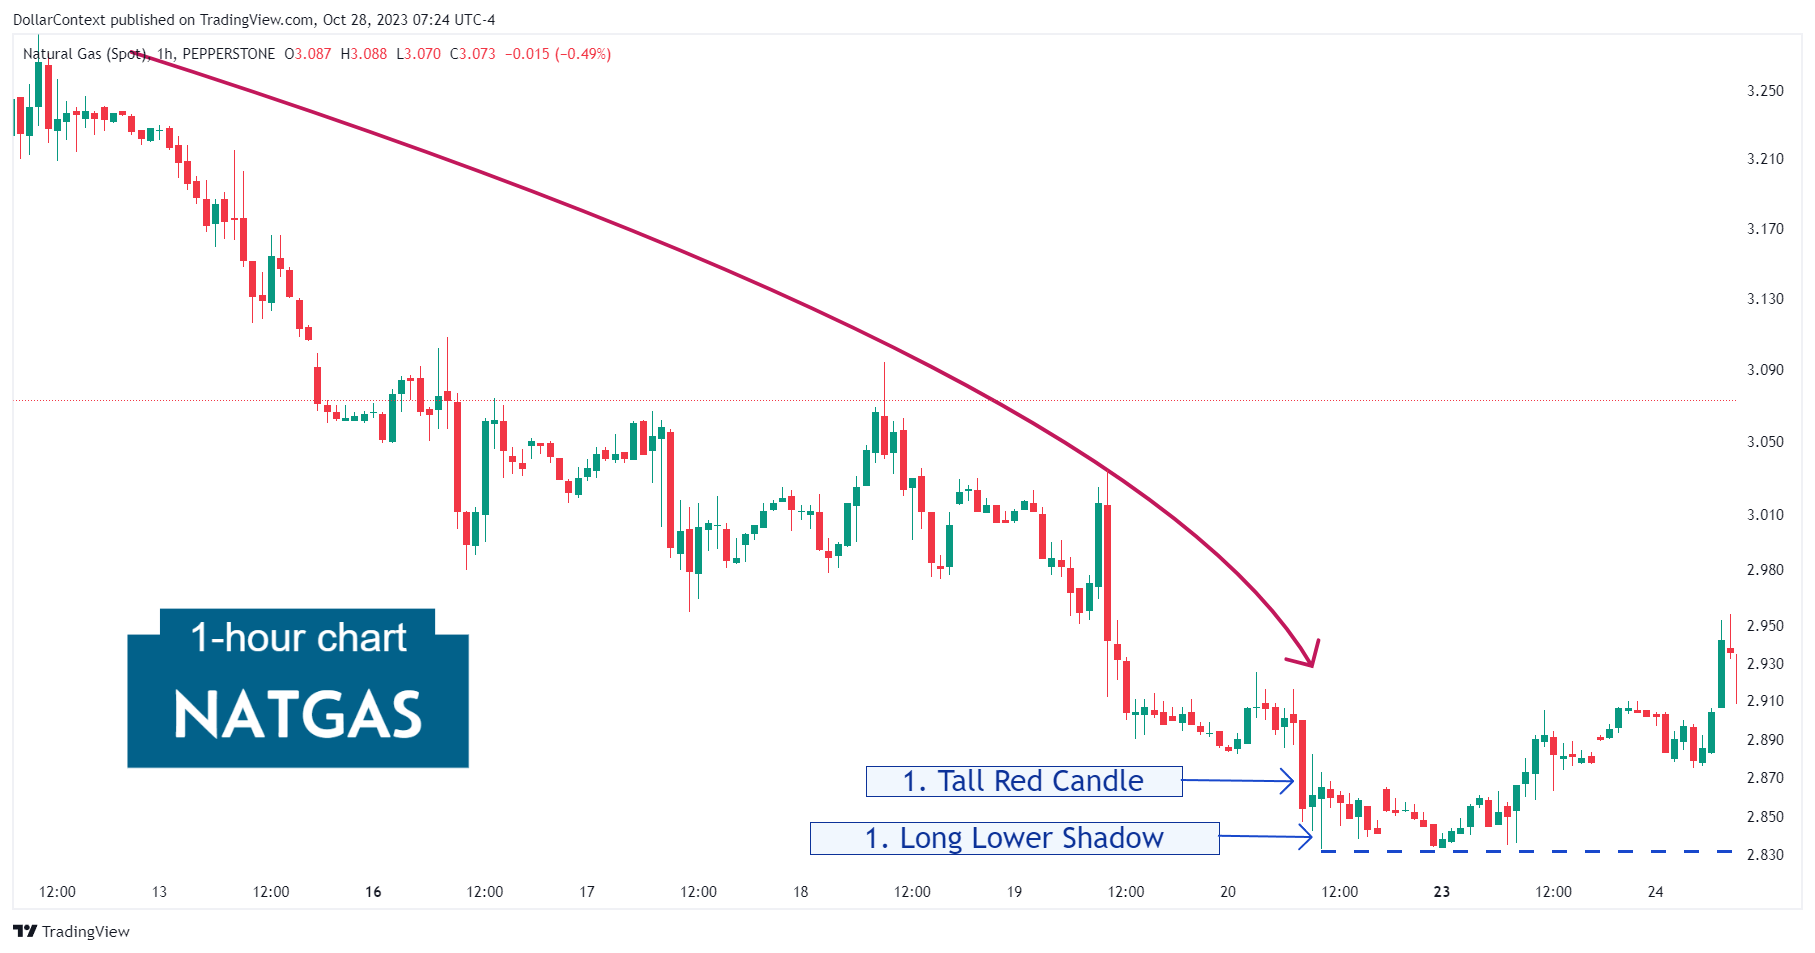
2. Early Market Transition
The long lower shadow candle marked the beginning of a relatively brief sideways period where natural gas tested three times the support level set by this candlestick. Finally, the market displayed two more long lower shadows and the onset of a bottom reversal.
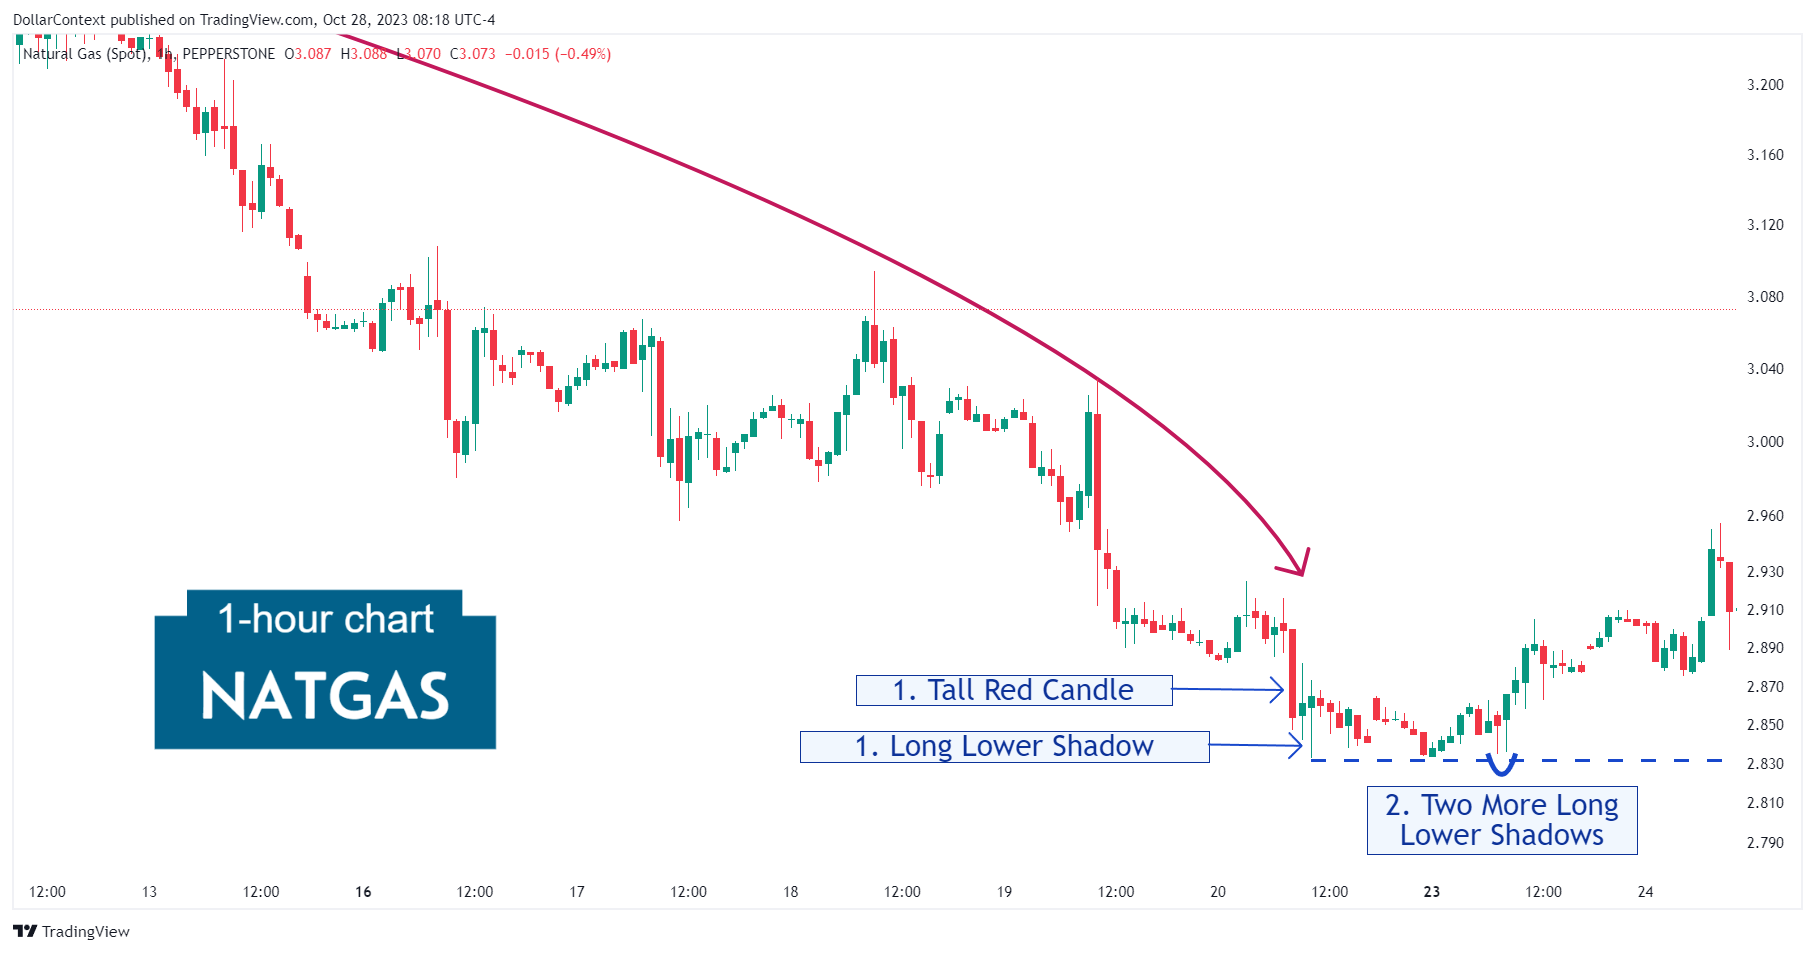
3. Resolution
The last pair of long lower shadows signaled the start of a week-long bullish trend.

4. Conclusion and Retrospective Assessment
Technically, the long lower shadow is not a candlestick pattern per se, but rather a specific type of candle line. Under specific circumstances, however, it can serve to identify buying interest at lower prices and potentially signal a reversal bottom.
For natural gas in October 2023, the following market conditions reinforced the validity of the long lower shadow:
- The prior downtrend was extended.
- The long lower shadow was preceded by a long red candle, signaling a potential selling climax.
- The support level set by the lowest point of the long lower shadow was successfully respected on three occasions.
- A second and third long lower shadow helped corroborate the potential floor set near the 2.83 mark.