Case Study 0016: Tower Bottom Gives Way to a Sharp Rise (USD/JPY)
After a decline, the USD/JPY displayed a tower bottom. Then the market exploded to the upside, signaling robust buying pressure.
This case study examines a historical market setup observed in the USD/JPY in October 2023. It is intended for educational purposes and illustrates how specific candlestick patterns behaved in real market conditions.
Case Study Data Sheet (Historical)
- Reference: CS0016
- Security: USD/JPY
- Timeframe: Hourly Chart (October 30, 2023)
-
Patterns:
- Tower Bottom
- Long Lower Shadow
- Inverted Hammer
- Spinning Tops
- Hanging Man
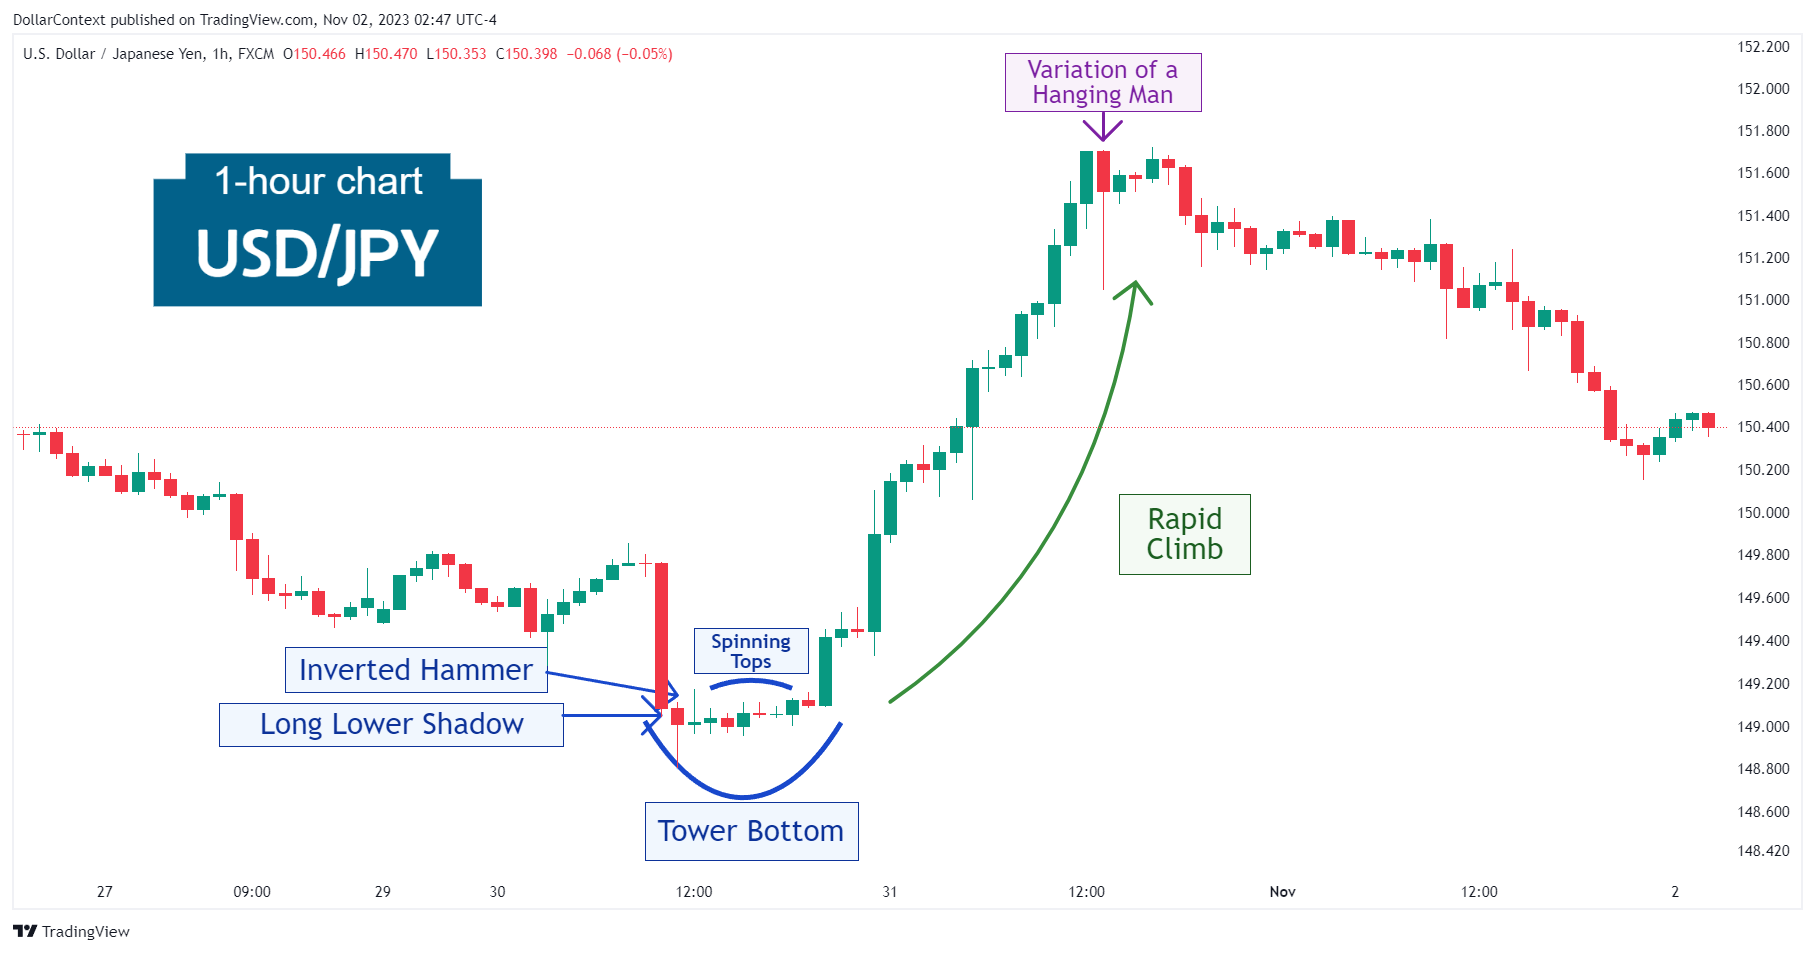
1. Signal Formation
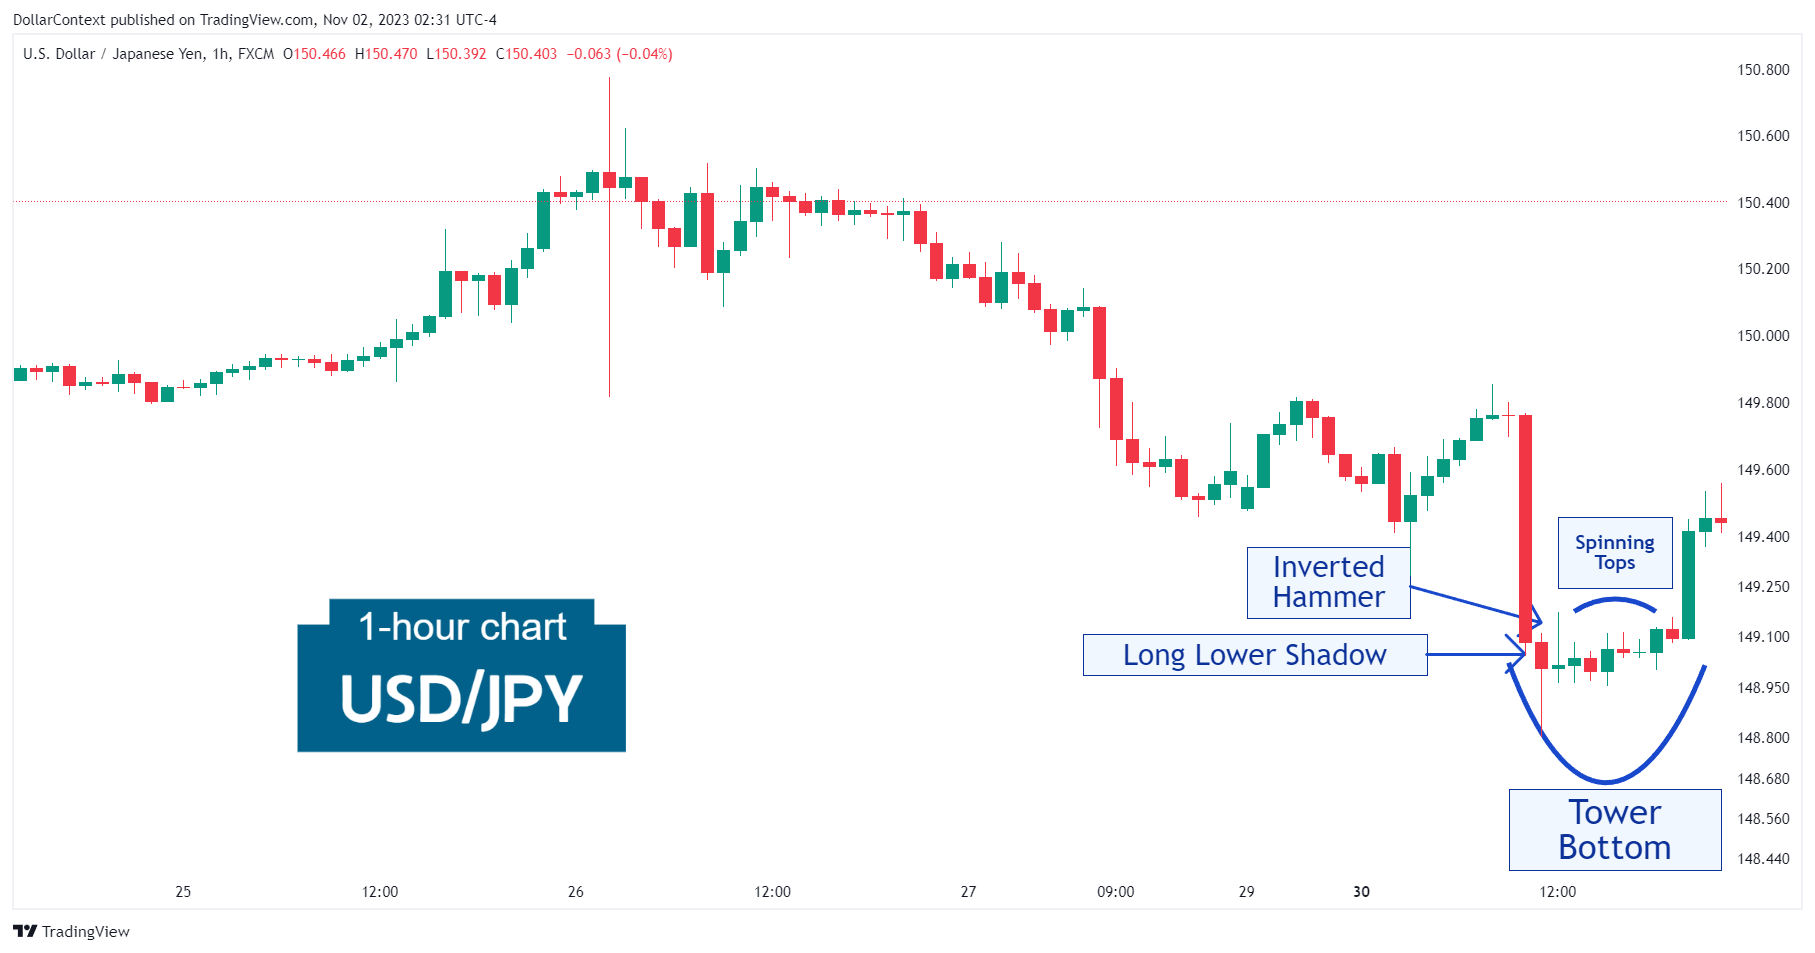
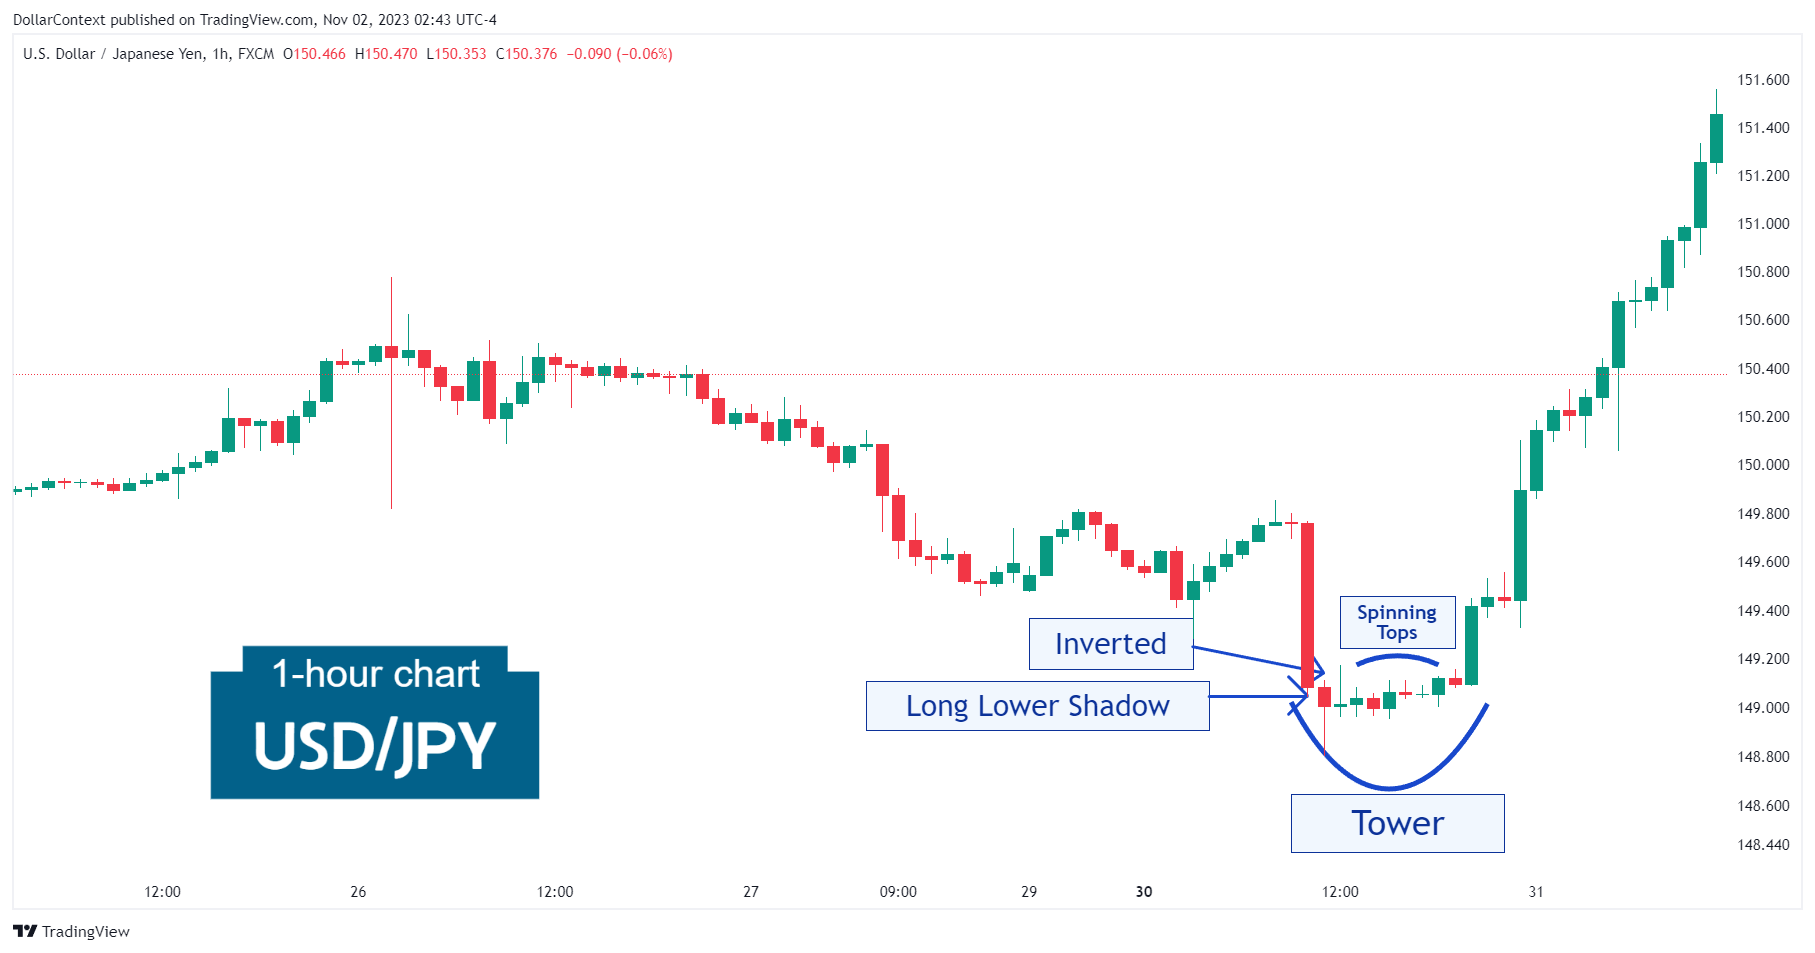
After a noticeable decline, the USD/JPY displayed a tower bottom. This pattern is characterized by a long red candlestick, which is then followed by a period of consolidation. Then the market explodes to the upside, signaling robust buying pressure, via one or more long green candlesticks.
During the consolidation period of the tower bottom, a series of additional reversal indicators that suggested an increasing probability of a trend reversal emerged. These include:
- Long Lower Shadow
- Inverted Hammer
- Spinning Tops
2. Early Market Transition
Following the tower bottom pattern, the USD/JPY pair swiftly embarked on a sharp ascent.
3. Resolution
The rapid climb stalled with a variation of a hanging man, which effectively signified the beginning of a decline.

4. Conclusion and Retrospective Assessment
The accumulation of reversal indicators within an overarching candlestick pattern frequently suggests that a top or a bottom might be imminent. This scenario unfolded in October 2023 as the USD/JPY displayed a long lower shadow, an inverted hammer, and a series of spinning tops in the context of a tower bottom.