Case Study 0017: High-Wave and Doji After a Tall Green Candle (AUD/USD)
In this article, we will cover the performance of the AUD/USD after the emergence of a high-wave pattern.
This case study examines a historical market setup observed in the AUD/USD in October 2023. It is intended for educational purposes and illustrates how specific candlestick patterns behaved in real market conditions.
Case Study Data Sheet (Historical)
- Reference: CS0017
- Security: AUD/USD
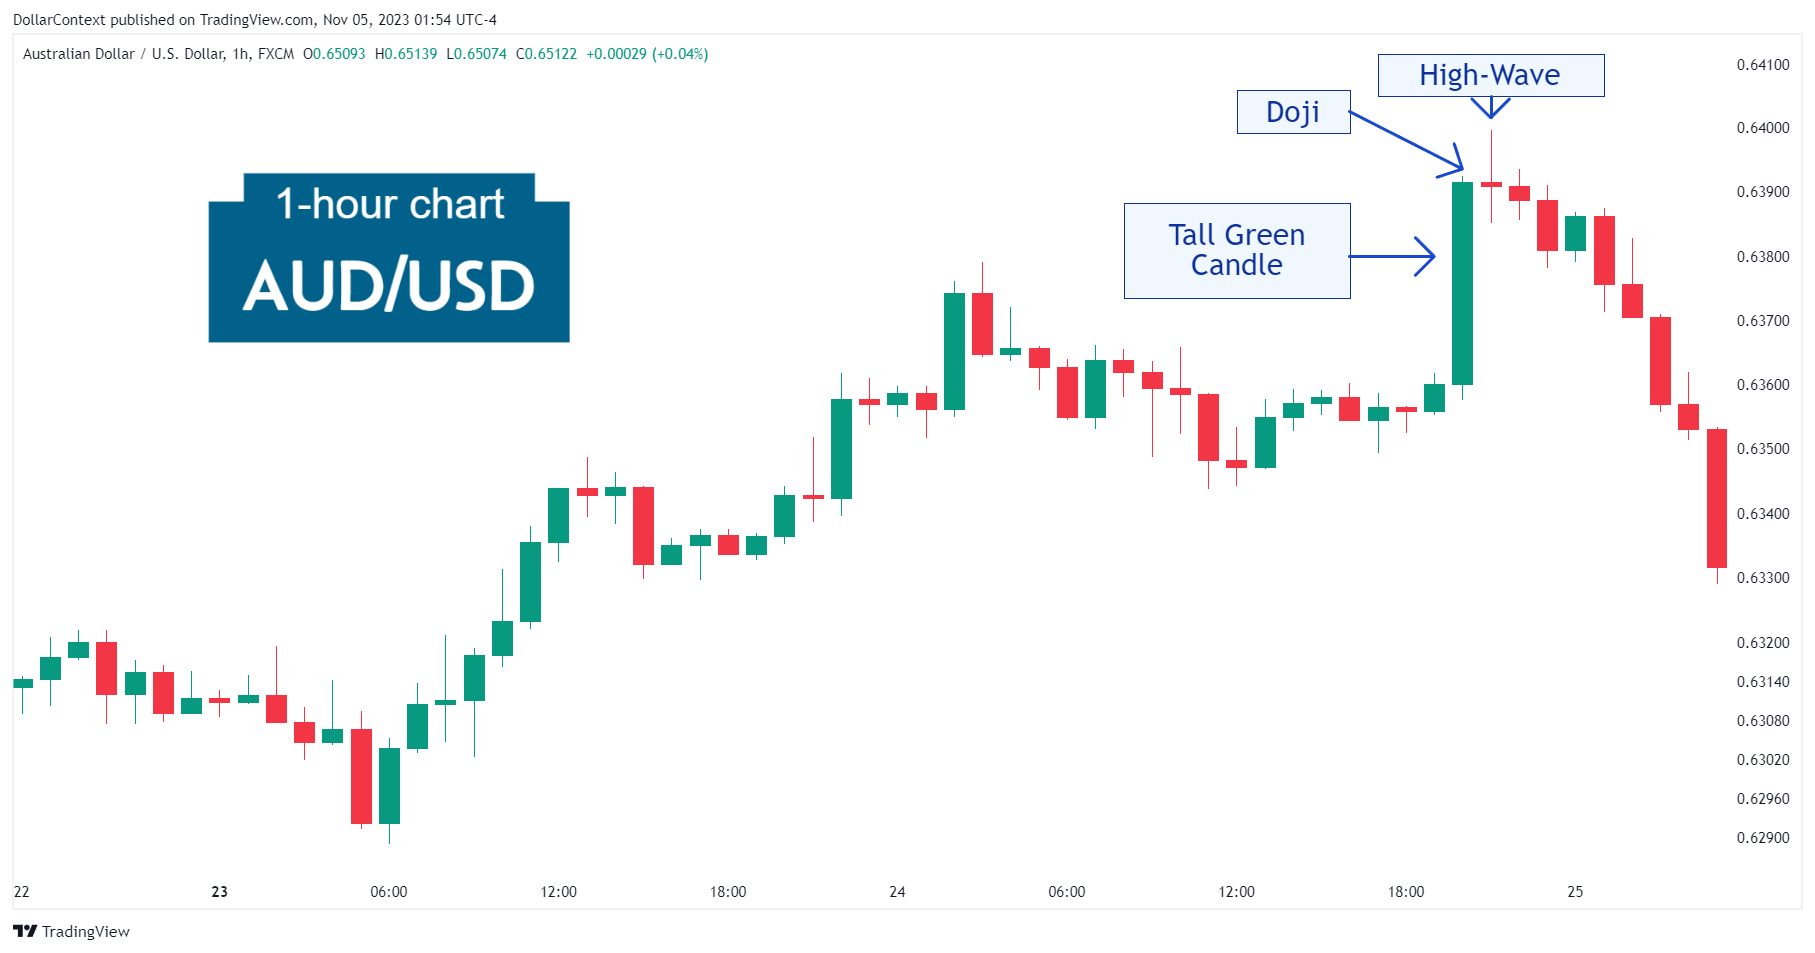
- Timeframe: Hourly Chart (October 24, 2023)
- Patterns:
1. Signal Formation
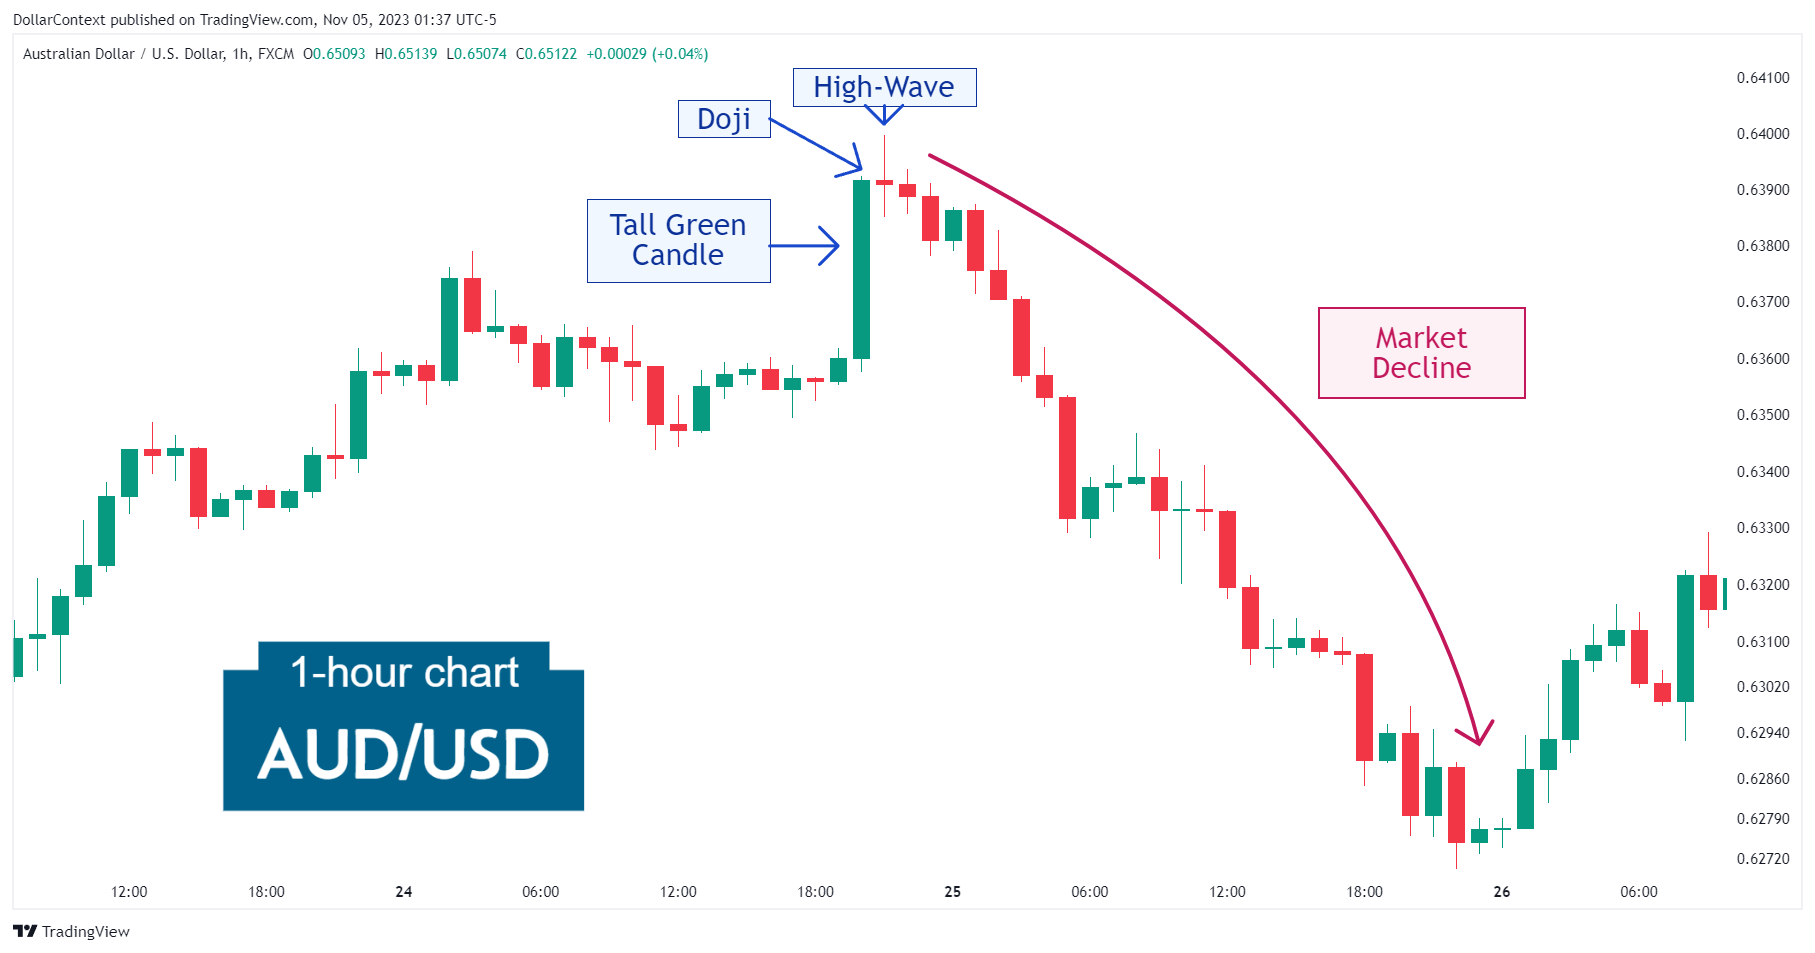
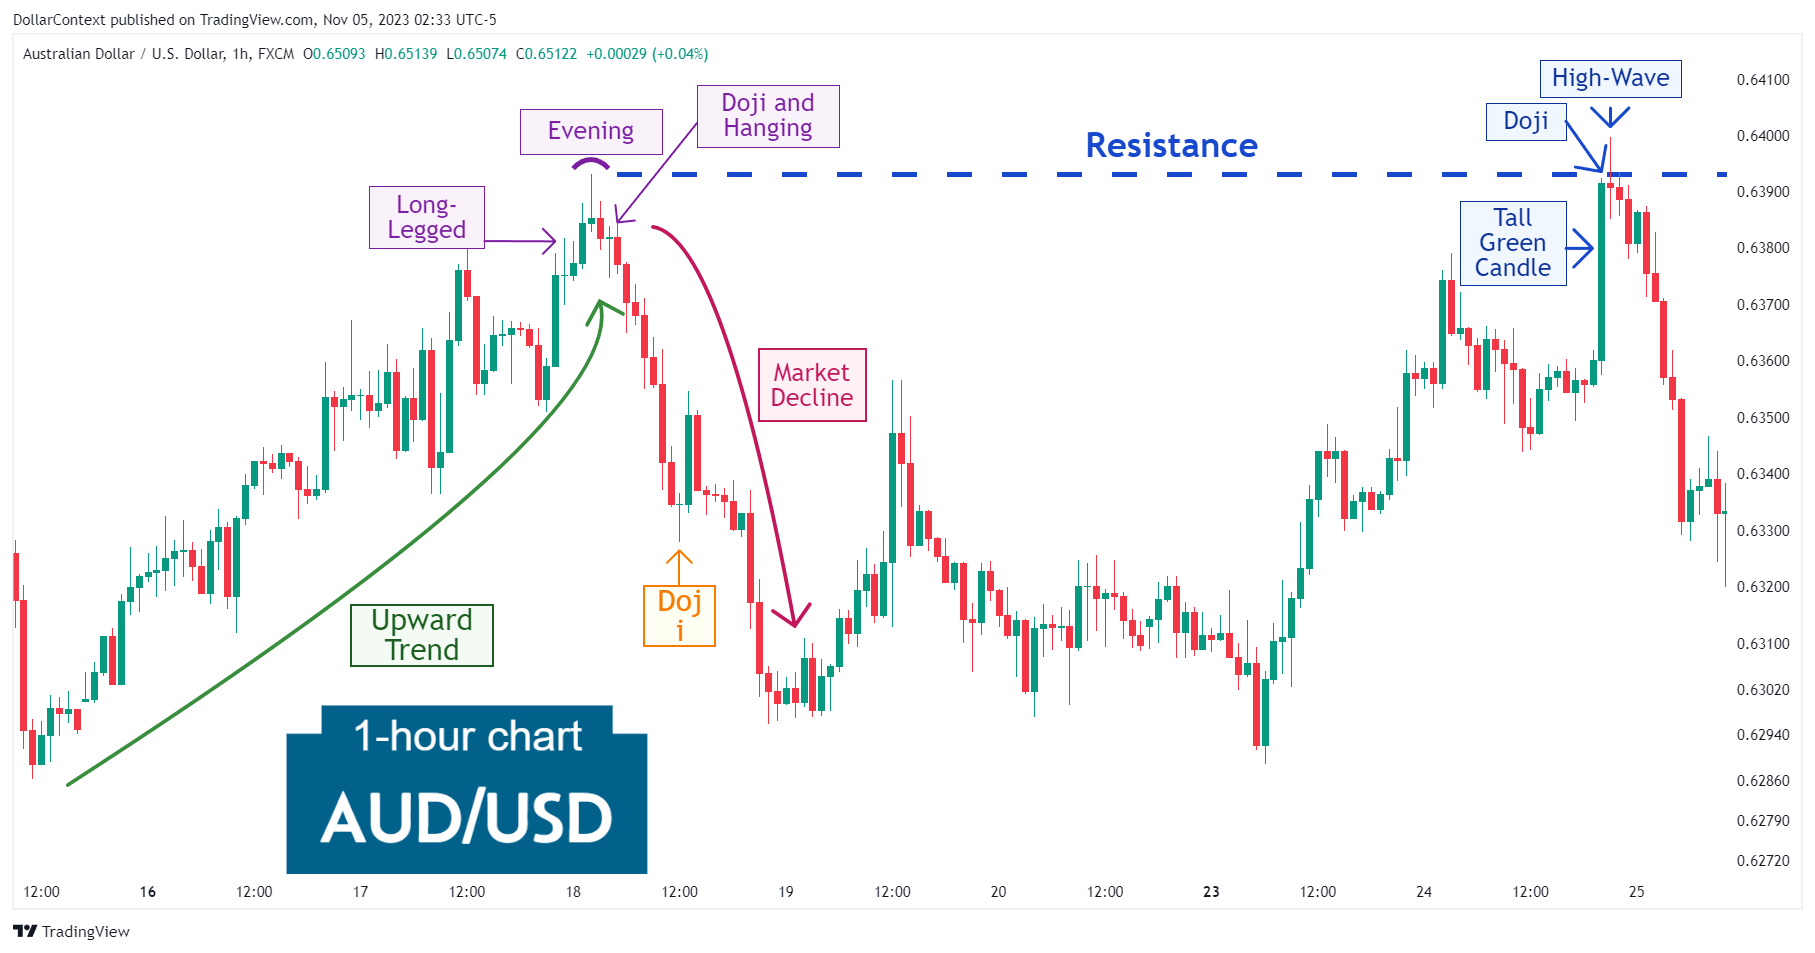
On October 24, the AUD/USD pair displayed a tall green candle. Given the relatively short preceding uptrend, this bullish session could be interpreted as a continuation and acceleration of the upward move.
The market, however, halted with a high-wave candlestick, indicating indecision among traders. Since the opening and closing price of this session are almost the same, it can also be viewed as a long-legged doji.
At first, this situation appeared somewhat perplexing. It seemed that the preceding uptrend wasn't sufficiently developed to suggest a reversal. Nonetheless, a doji emerging after a long green candle should always be regarded with caution as a potential warning sign.
Another important aspect of this pattern was the area in which it appeared. Note how it emerged in a significant resistance zone, established by another sequence of candlestick patterns on November 18.
2. Early Market Transition
As evident from the chart above, the AUD/USD began its descent almost immediately, without additional testing of the highs marked by the high-wave candle.
3. Resolution
The top reversal continued by displaying a sizeable and satisfactory downward move of about 2 percent.

4. Conclusion and Retrospective Assessment
When evaluating the significance of a candlestick reversal pattern in a chart, there are three main parameters to bear in mind:
- The length of the preceding trend
- Whether the reversal pattern emerges within a support or resistance zone
- The confluence of additional reversal signals within the same price range
While the prior uptrend was not very long in this case, the fact that the high-wave session emerged within a key resistance zone and considering that it could also be viewed as a long-legged doji, contributed to forecast a likely bearish reversal.