Case Study 0020: Hammer and Piercing Pattern (AUD/USD)
In this article, we will cover the performance of the AUD/USD after the emergence of a hammer and a piercing pattern.
This case study examines a historical market setup observed in the AUD/USD in October 2022. It is intended for educational purposes and illustrates how specific candlestick patterns behaved in real market conditions.
Case Study Data Sheet (Historical)
- Reference: CS0020
- Security: AUD/USD
- Timeframe: Daily Chart (October 17, 2022)
- Patterns:
1. Signal Formation
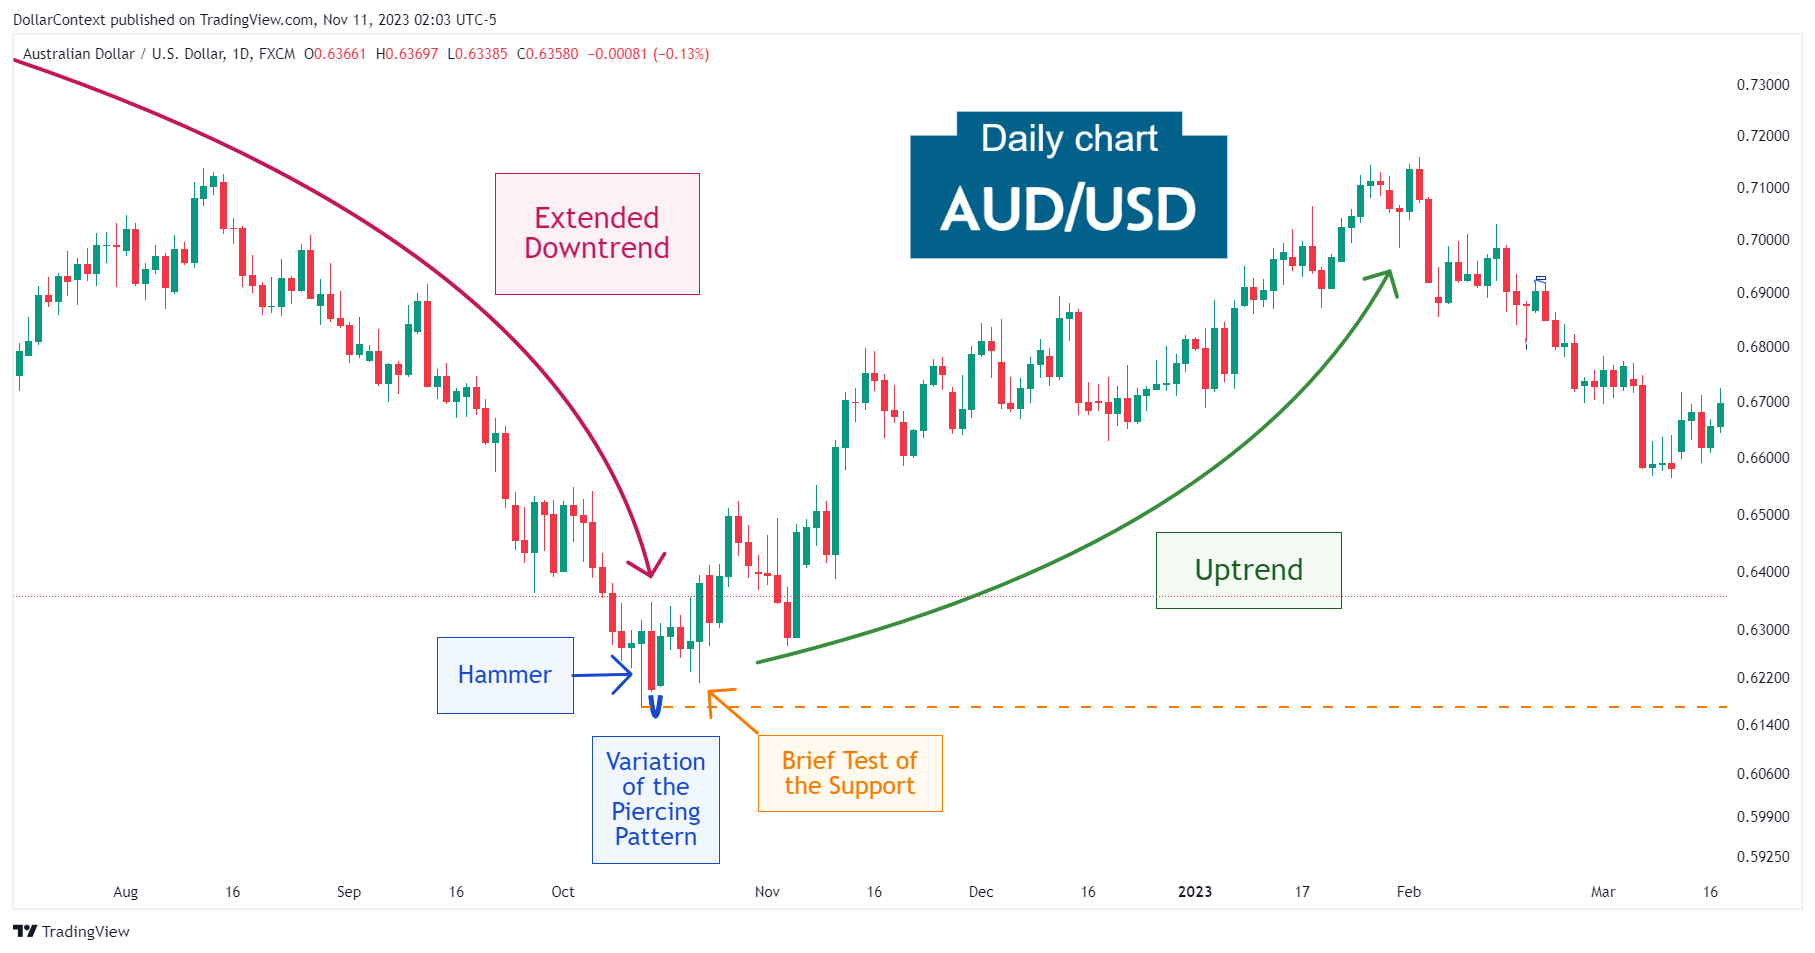
After an extended downtrend, the AUD/USD pair displayed a hammer line followed by a variation of a piercing pattern.
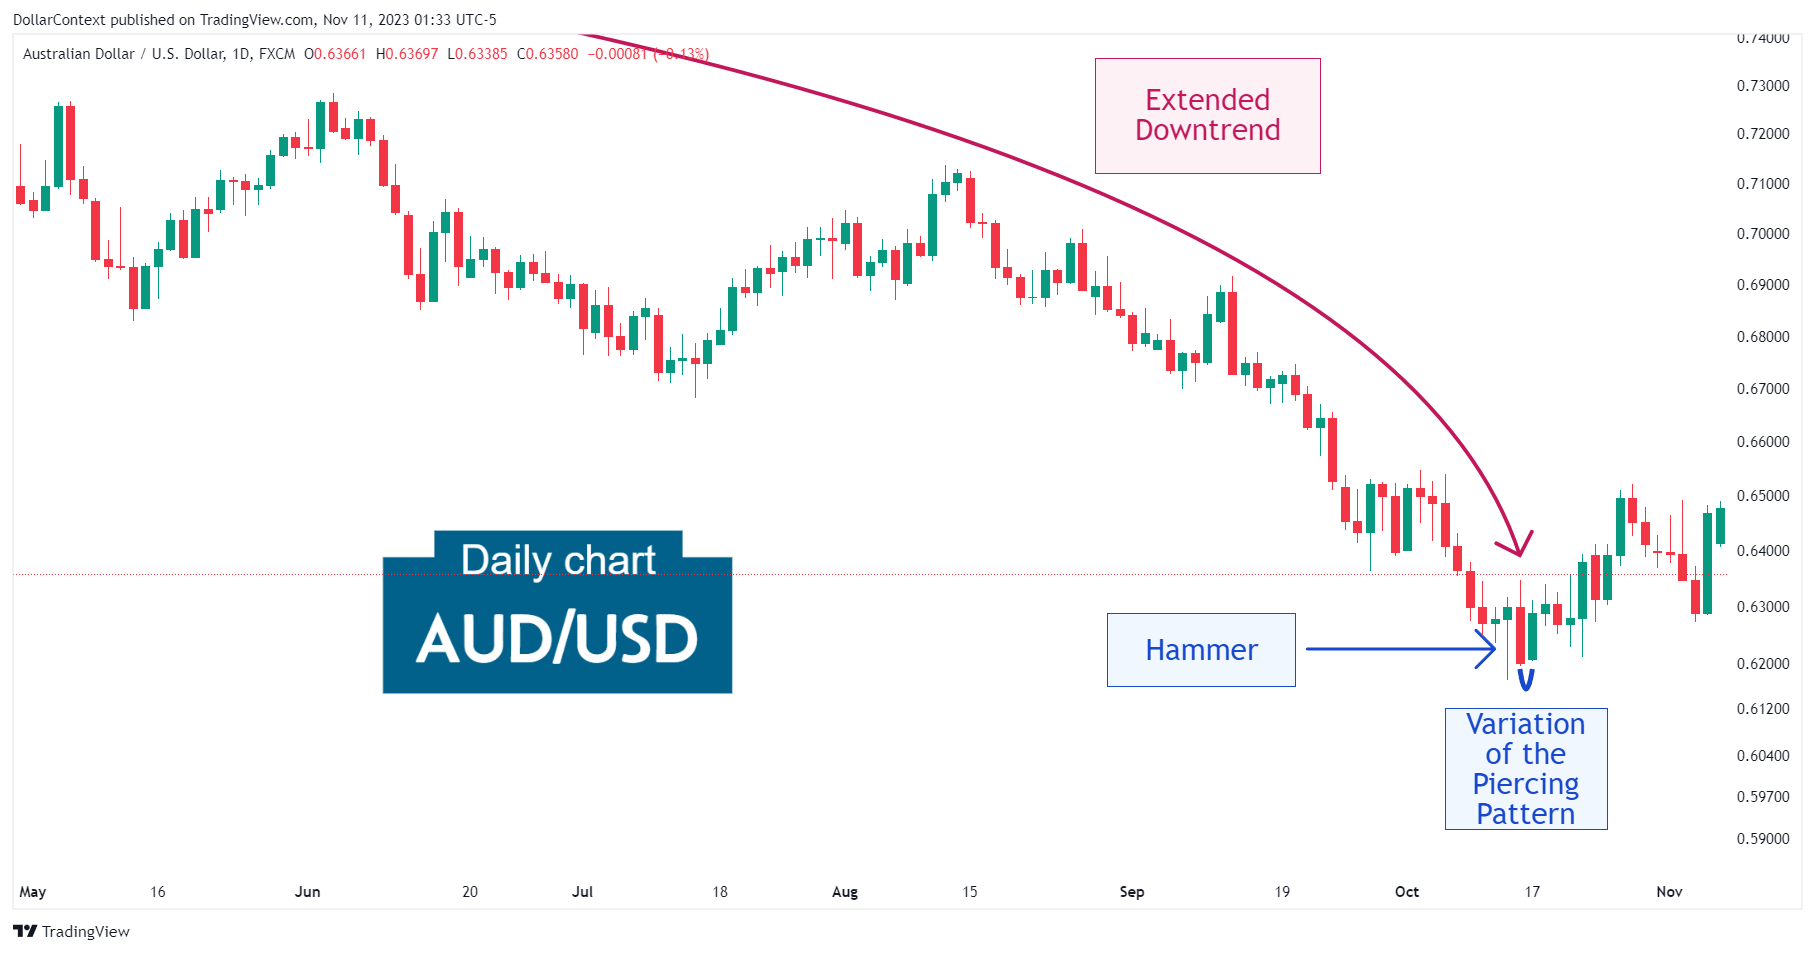
The piercing pattern could be viewed as an irregular formation because the second candle of the pattern opened marginally above the closing price of the first. However, this can still be considered a valid variation with all the bearish implications of the traditional piercing pattern for several reasons, which I will now address:
- The closing price of the second session penetrates deep into the body of the first candle.
- When combined, the two candles that constitute the piercing pattern resemble another hammer or a long lower shadow candlestick, reinforcing the rejection of lower prices seen in the first hammer.
- The appearance of this pattern variation right after a hammer session amplifies the importance of both formations, solidifying their role as indicators of a potential bottom reversal.
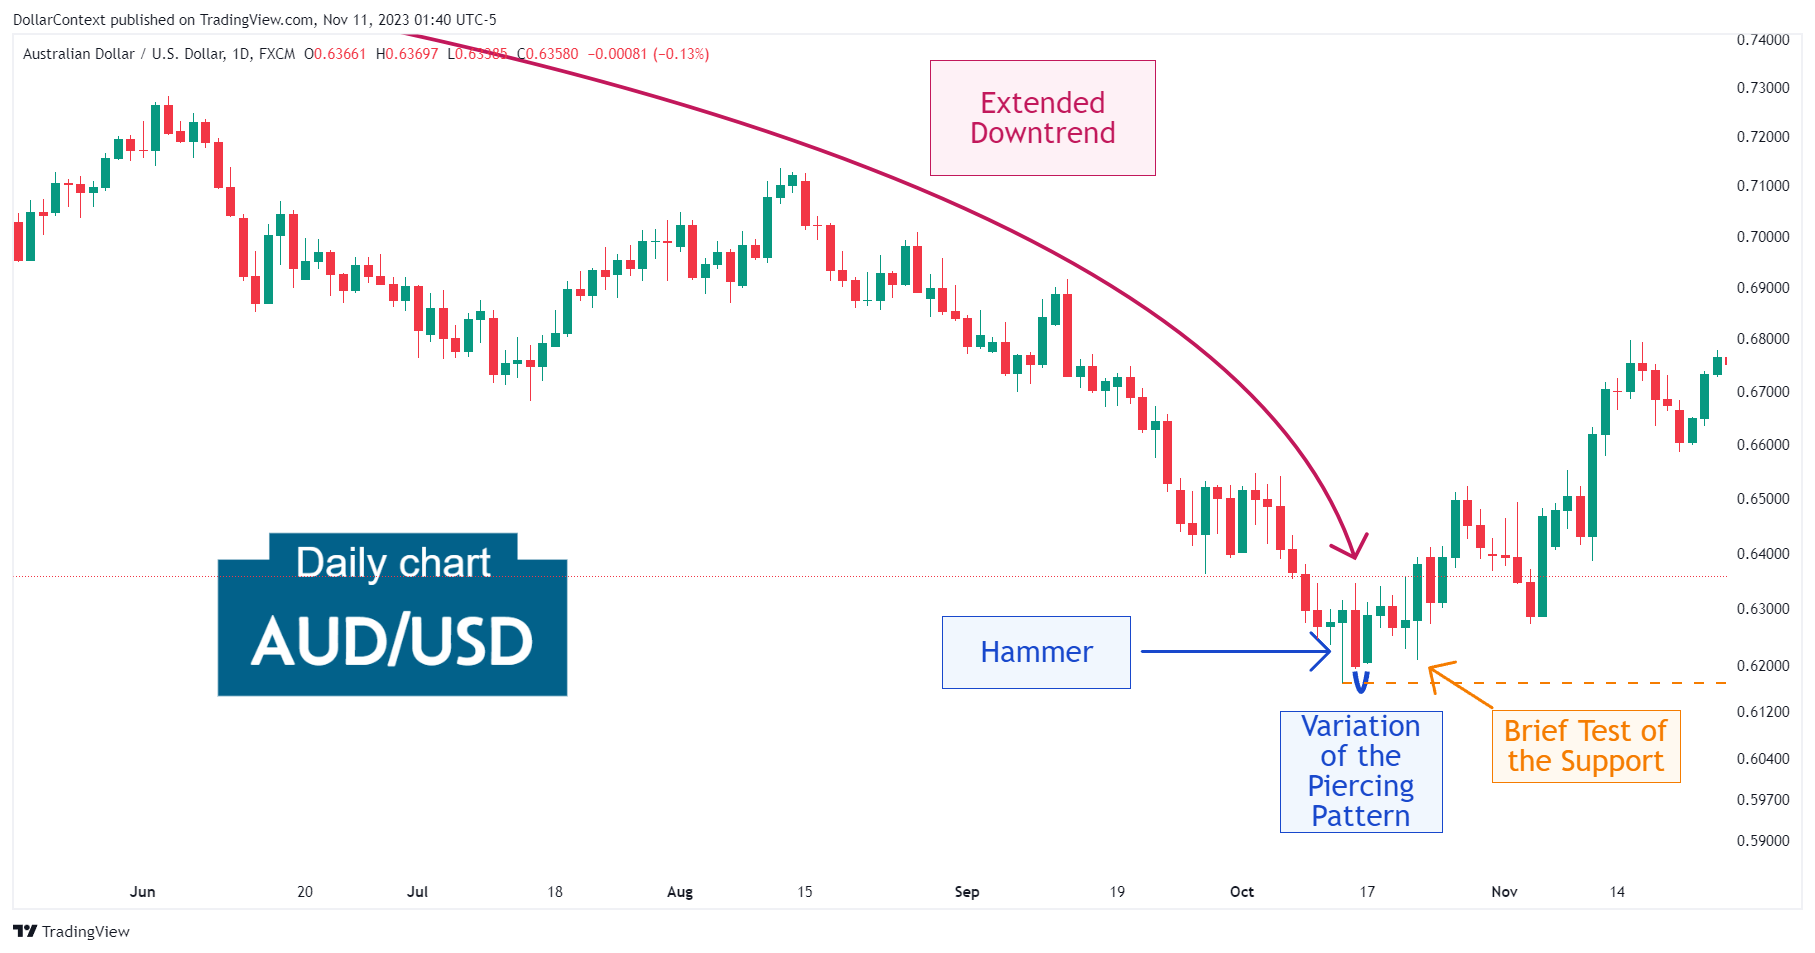
2. Early Market Transition
Following the two bullish patterns and before initiating an ascent, the market underwent a brief period of stabilization while testing the support zone set by both patterns.
3. Resolution
As illustrated in the accompanying image, the reversal was followed by a decent, albeit not particularly remarkable, rally.
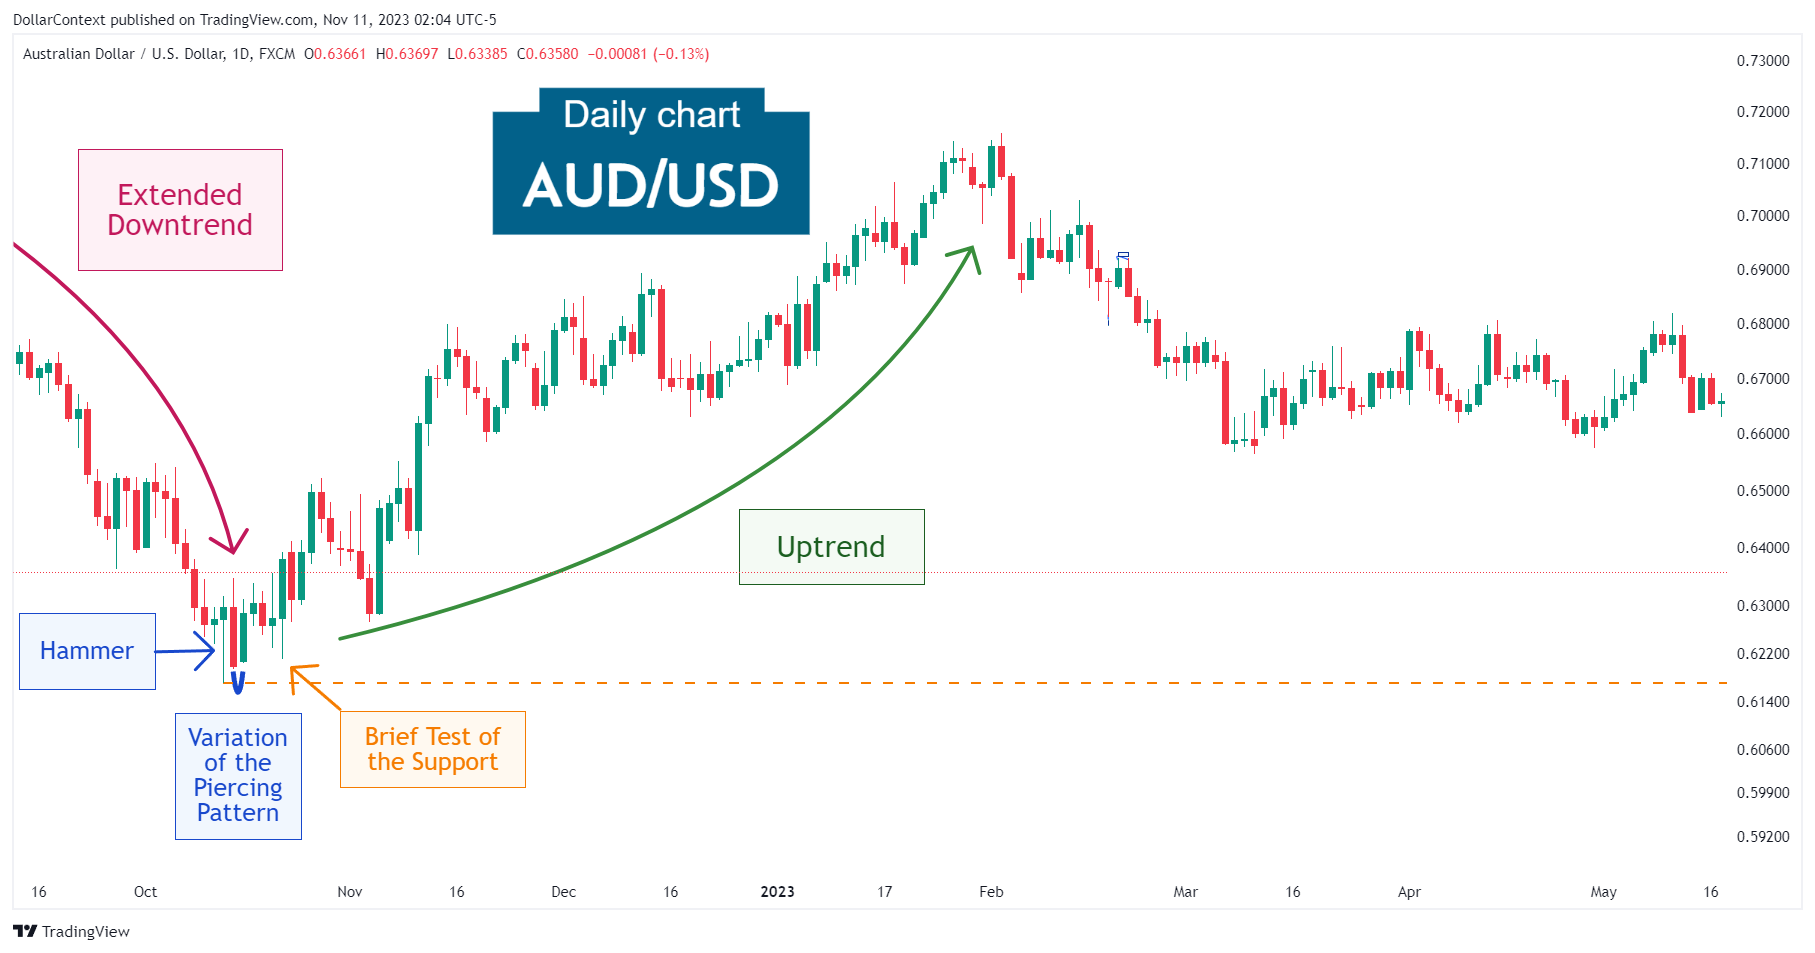
4. Conclusion and Retrospective Assessment
Two or more consecutive candlestick patterns at low price levels should be considered a potentially important reversal signal, even if some of these patterns are variations from their ideal forms.
This scenario is what unfolded in October 2022 when, preceded by a mature downtrend, the AUD/USD saw a decent rally after displaying a less-than-perfect hammer and a piercing pattern variation.