Case Study 0022: Last Engulfing Bottom and Tower Bottom (AUD/USD)
In this article, we will cover the performance of the AUD/USD after the emergence of a last engulfing bottom and a tower bottom.
This case study examines a historical market setup observed in the AUD/USD in October 2023. It is intended for educational purposes and illustrates how specific candlestick patterns behaved in real market conditions.
Case Study Data Sheet (Historical)
- Reference: CS0022
- Security: AUD/USD
- Timeframe: Hourly Chart (October 26, 2023)
-
Patterns:
- Last Engulfing Bottom
- Tower Bottom
1. Signal Formation
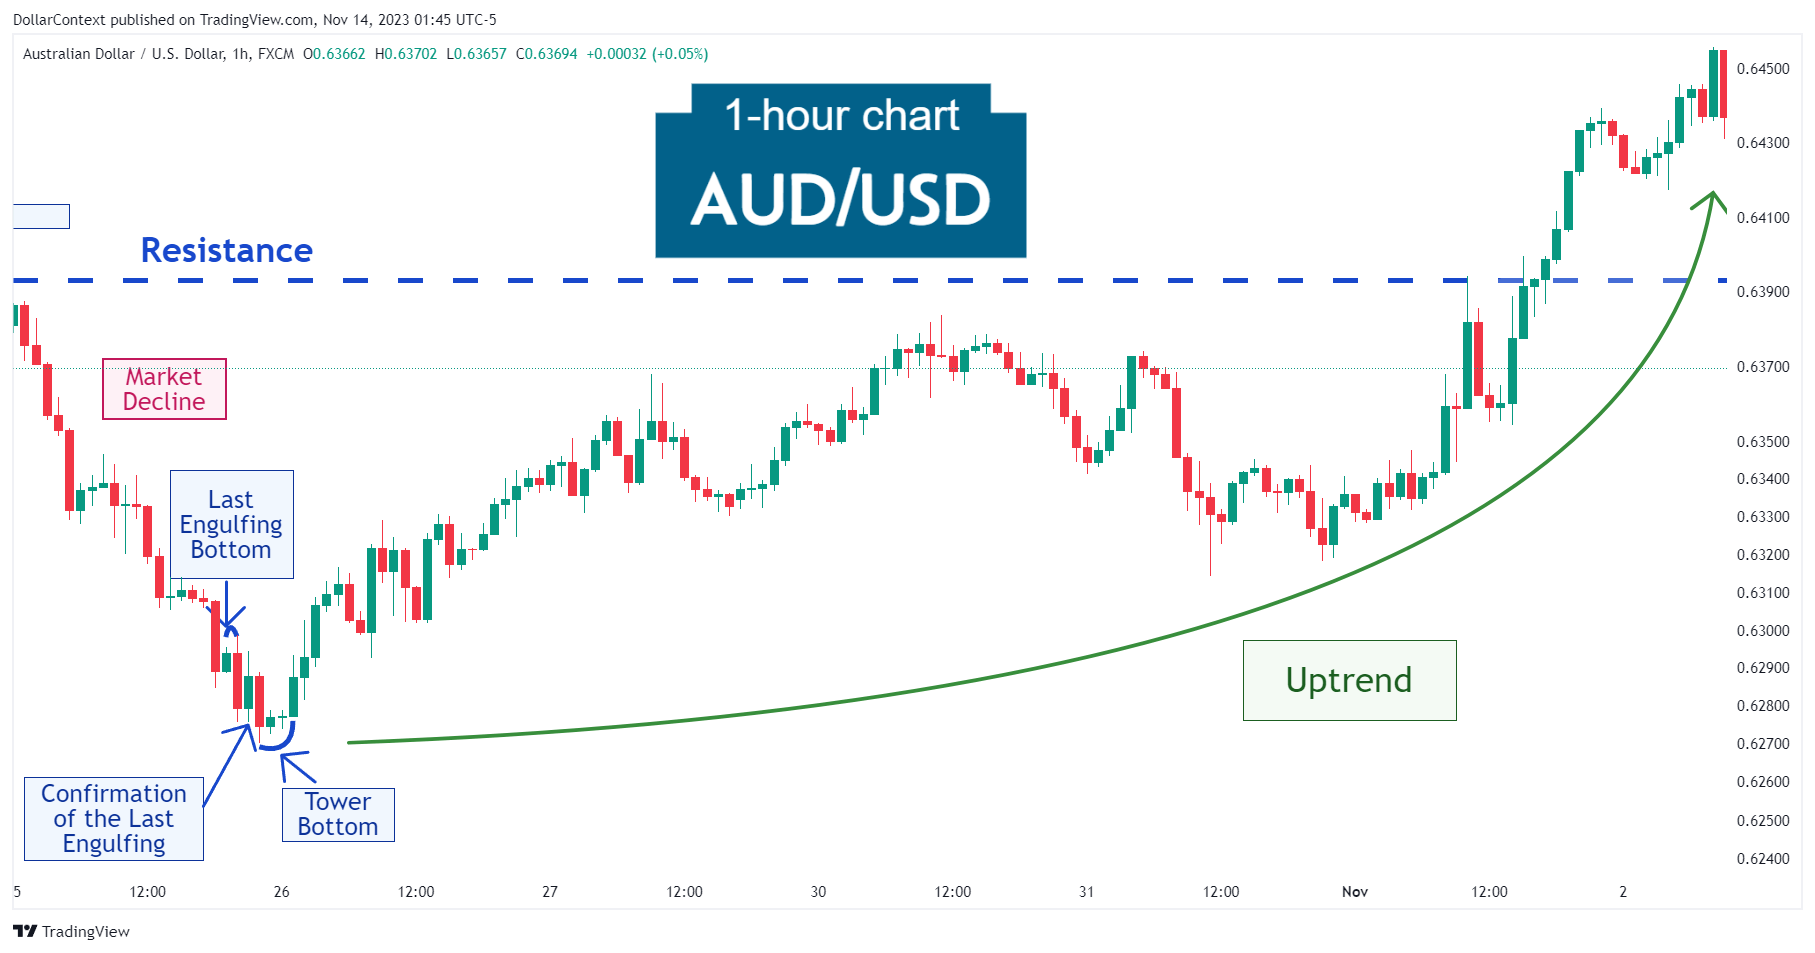
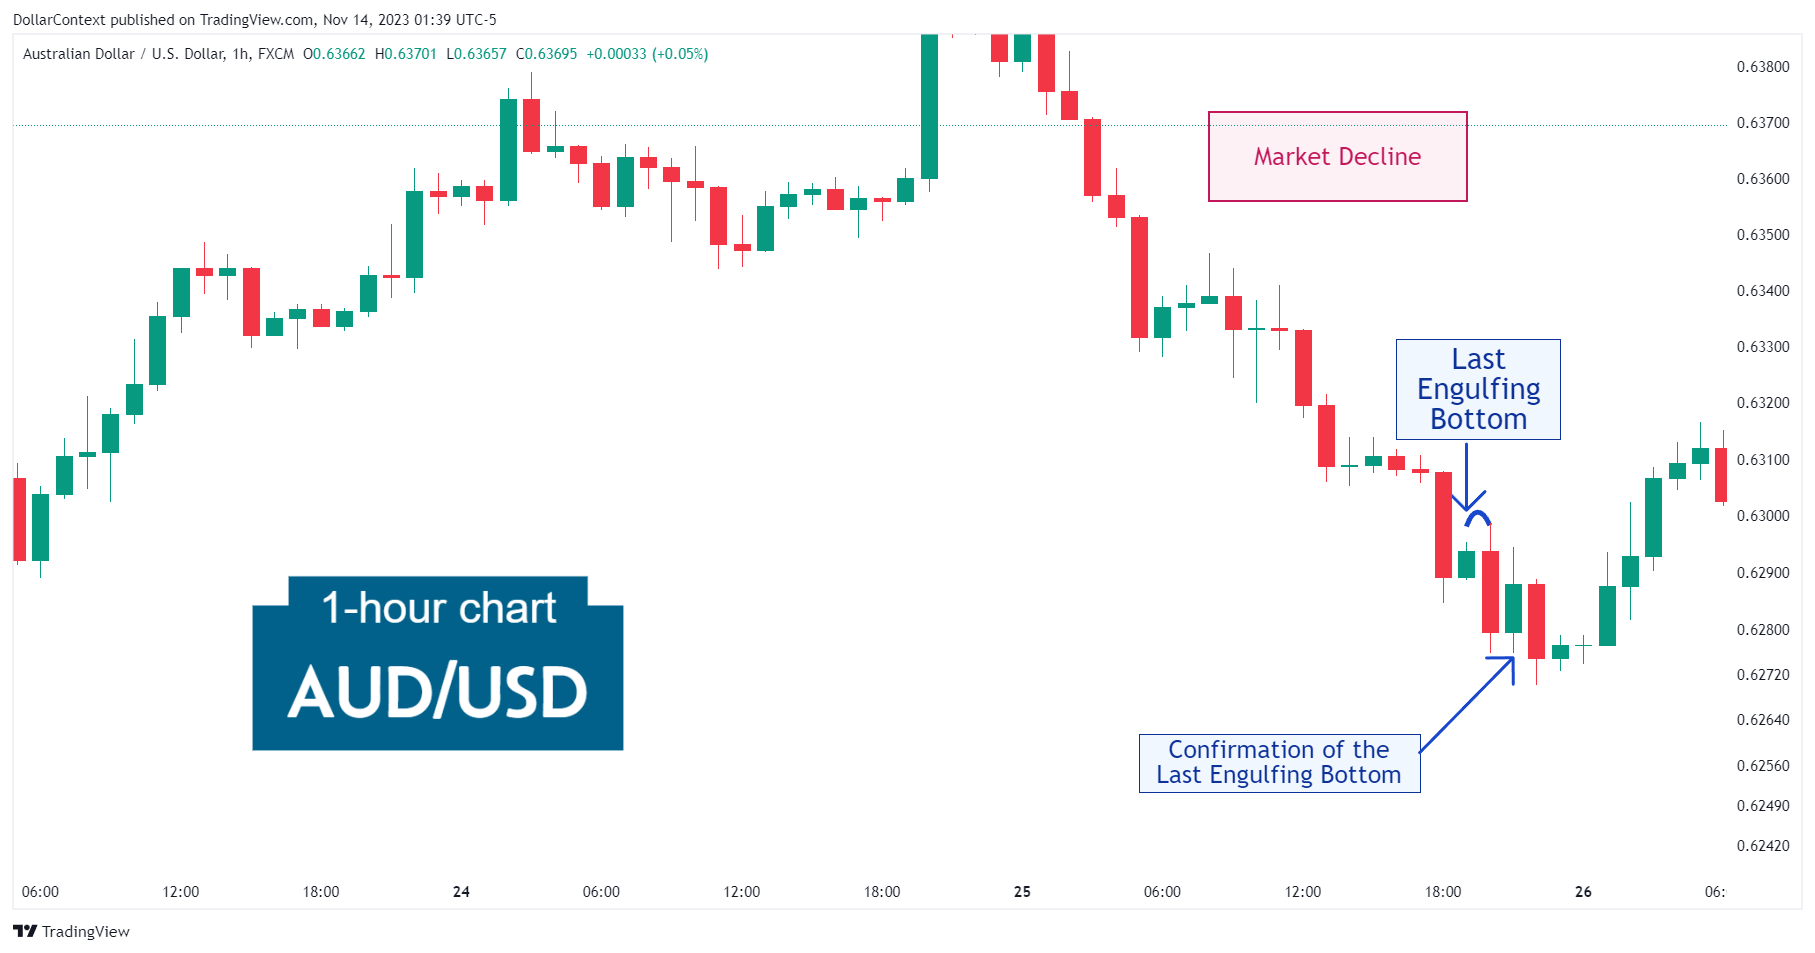
After a noticeable downtrend, the AUD/USD pair displayed a last engulfing bottom on October 25, 2023. The last engulfing bottom mirrors the configuration of a bearish engulfing pattern. However, while sharing the same formation, the last engulfing bottom distinctively serves as a bullish reversal signal that emerges following a downtrend.
The last engulfing bottom is considered a turning point for the bulls if the next session closes above the prior red candle's close. The chart below illustrates this occurrence in the AUD/USD pair.
2. Early Market Transition
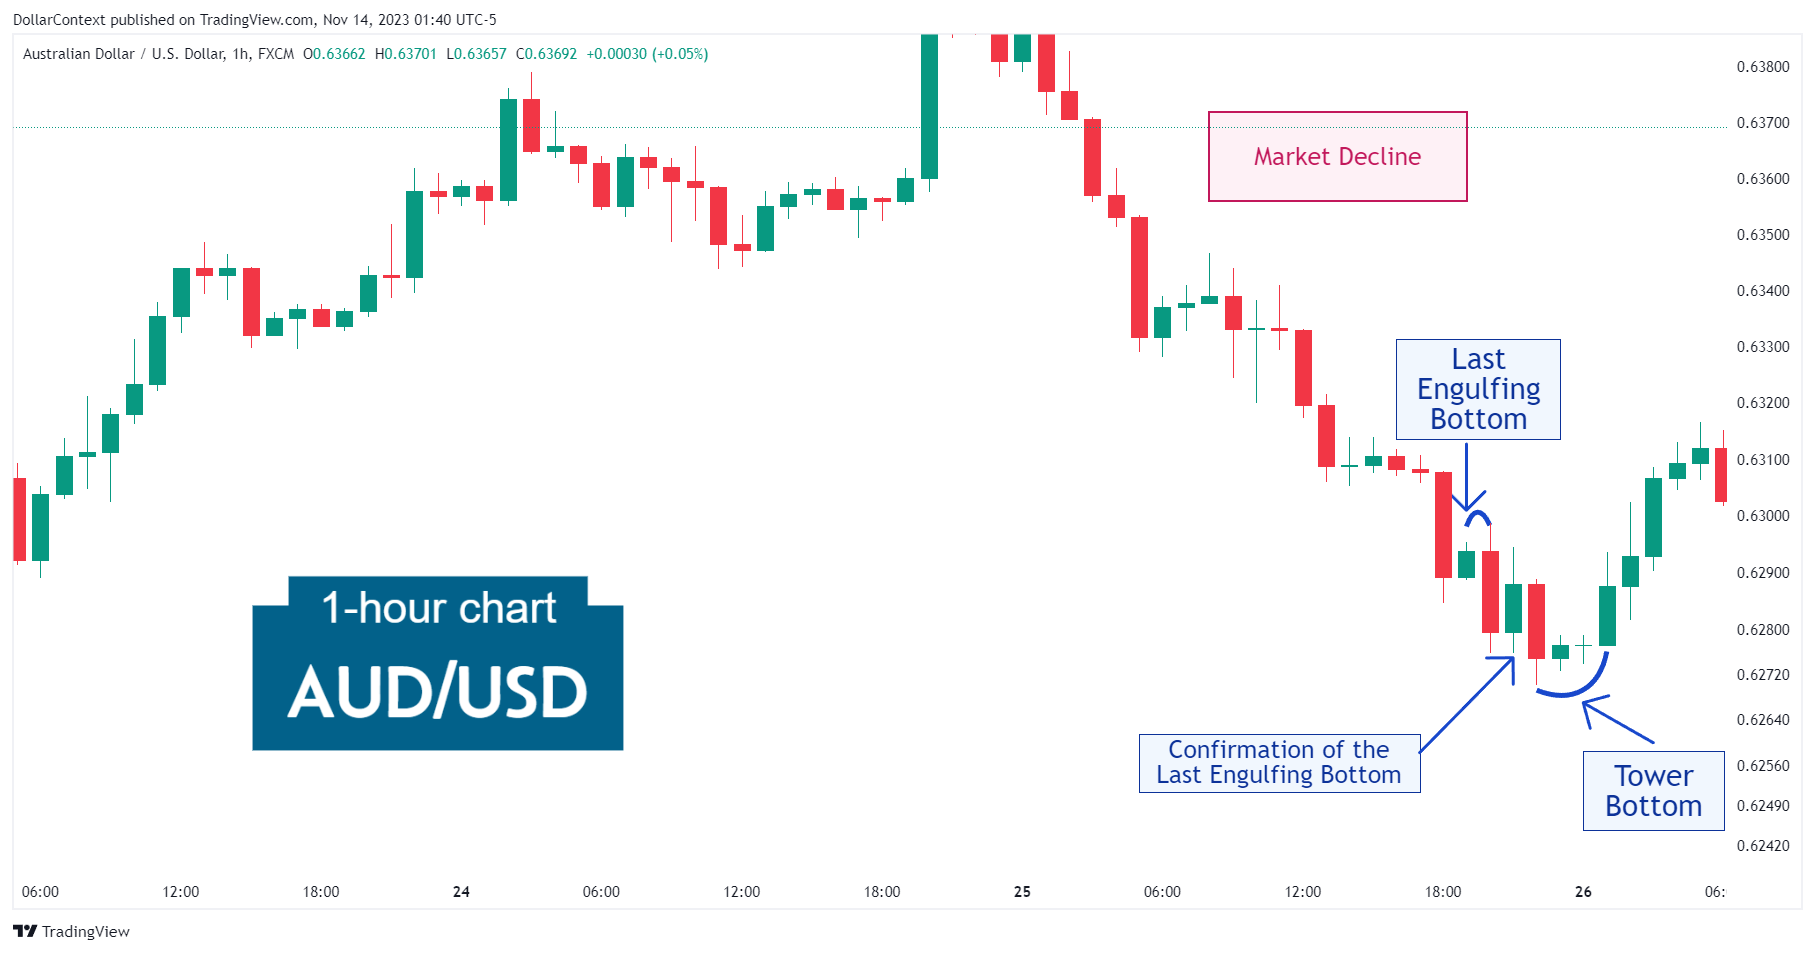
After the confirmation of the last engulfing bottom, the market decided to test the lows of the pattern via a tower bottom configuration. The tower bottom successfully marked the end of the prior downtrend and the start of an upturn.
3. Resolution
The two patterns mentioned above, the last engulfing bottom and the tower bottom, effectively signaled the onset of a prolonged uptrend in both time and price.

4. Conclusion and Retrospective Assessment
Last engulfing bottoms and tops, while not always reliable on their own, can be stronger indicators of a market reversal when observed in conjunction with other candlestick formations. For the AUD/USD market scenario outlined previously, the tower bottom pattern played a crucial role in confirming this scenario.