Case Study 0029: Bearish Engulfing Pattern and Hanging Man After a Strong Uptrend (USD/JPY)
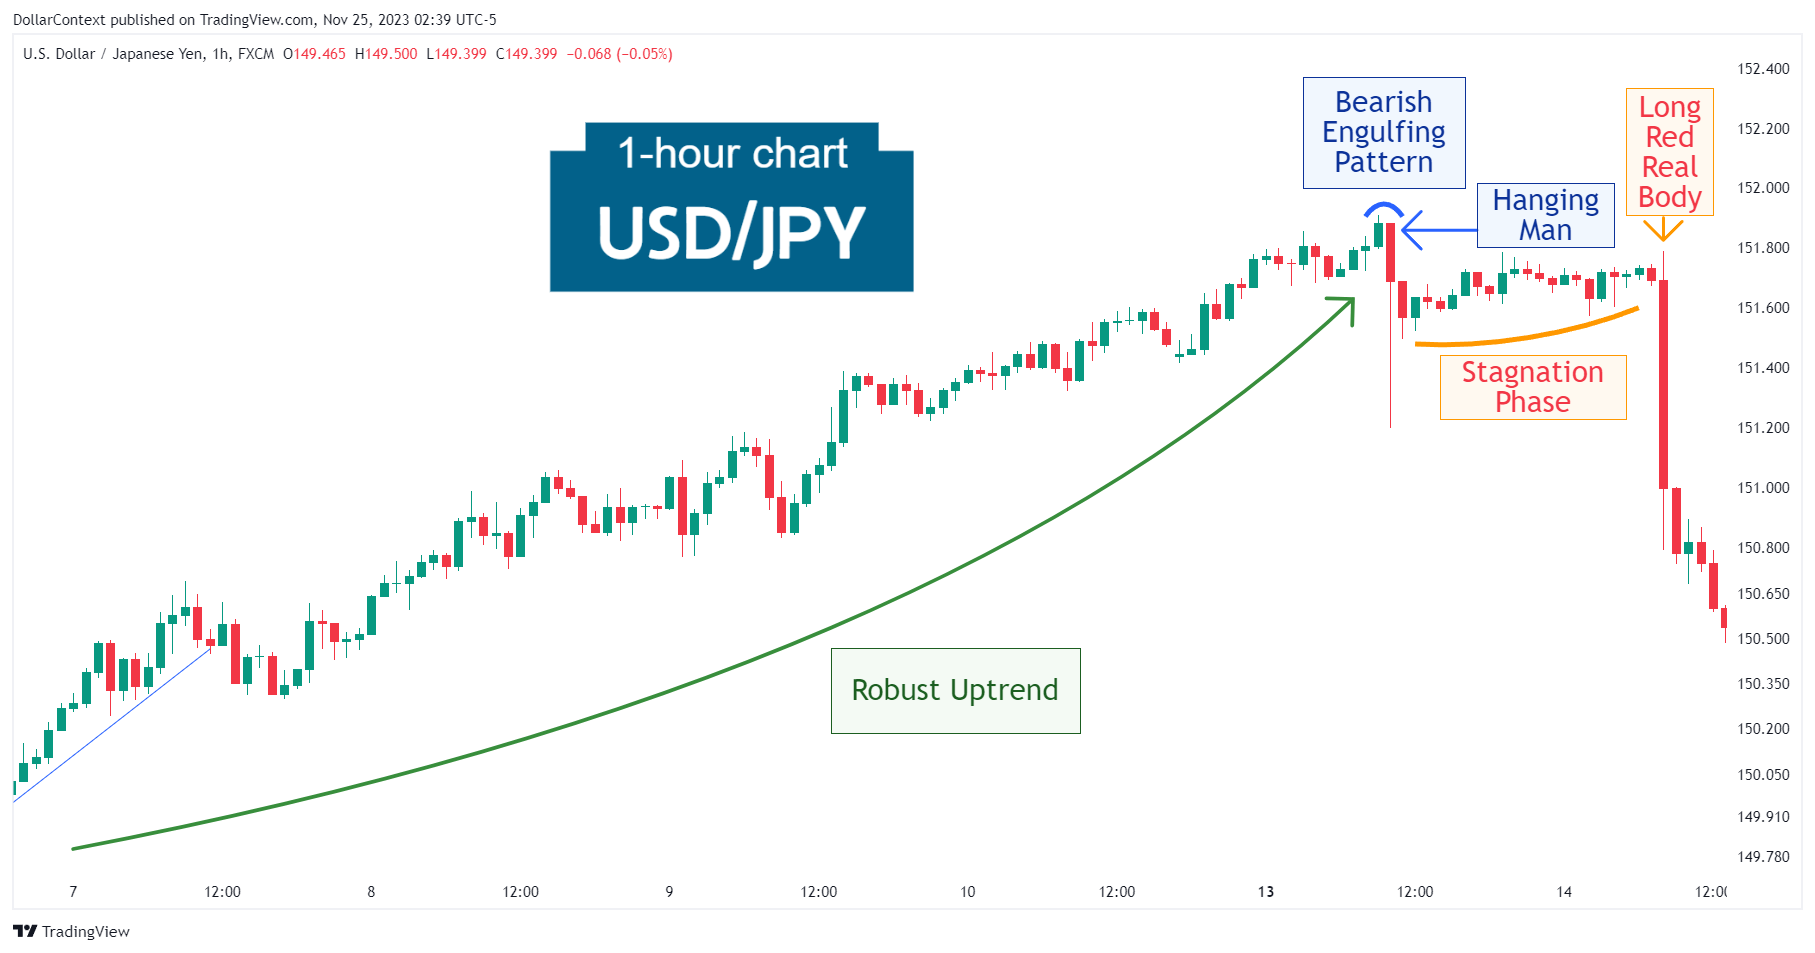
After experiencing a strong uptrend, the USD/JPY formed a bearish engulfing pattern, characterized by a hanging man candlestick as the second candle in the formation.
This case study examines a historical market setup observed in the USD/JPY in November 2023. It is intended for educational purposes and illustrates how specific candlestick patterns behaved in real market conditions.
Case Study Data Sheet (Historical)
- Reference: CS0029
- Security: USD/JPY
- Timeframe: Hourly Chart (November 13, 2023)
-
Patterns:
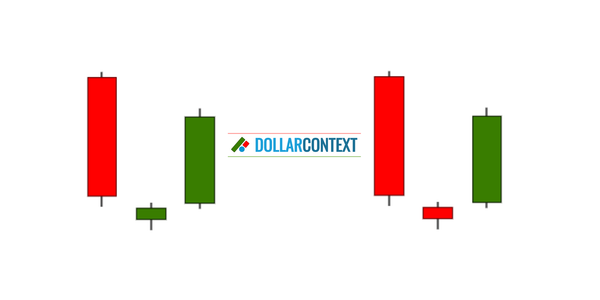
- Bearish Engulfing Pattern
- Hanging Man
- Long Red Real Body
1. Signal Formation
After experiencing a strong uptrend, the USD/JPY formed a bearish engulfing pattern, characterized by a hanging man candlestick as the second candle in the formation.
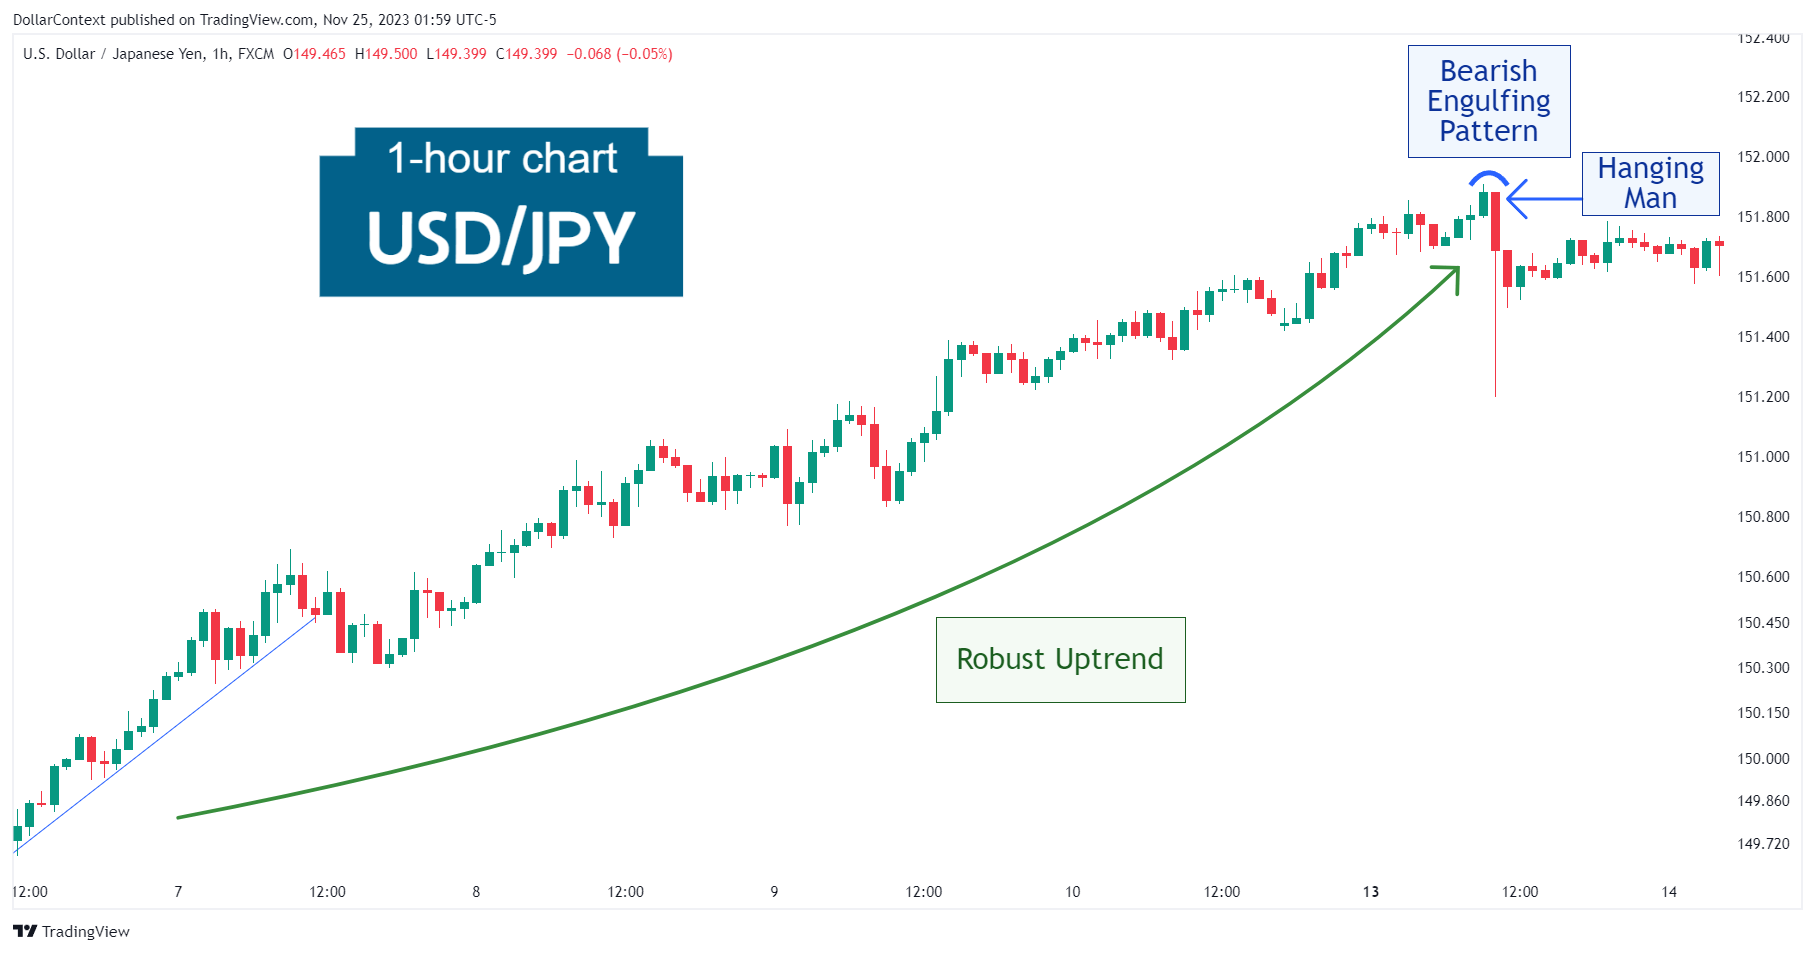
Observe that the second candle of the engulfing pattern encompasses several previous sessions, indicating a significant shift in market sentiment.
2. Early Market Transition
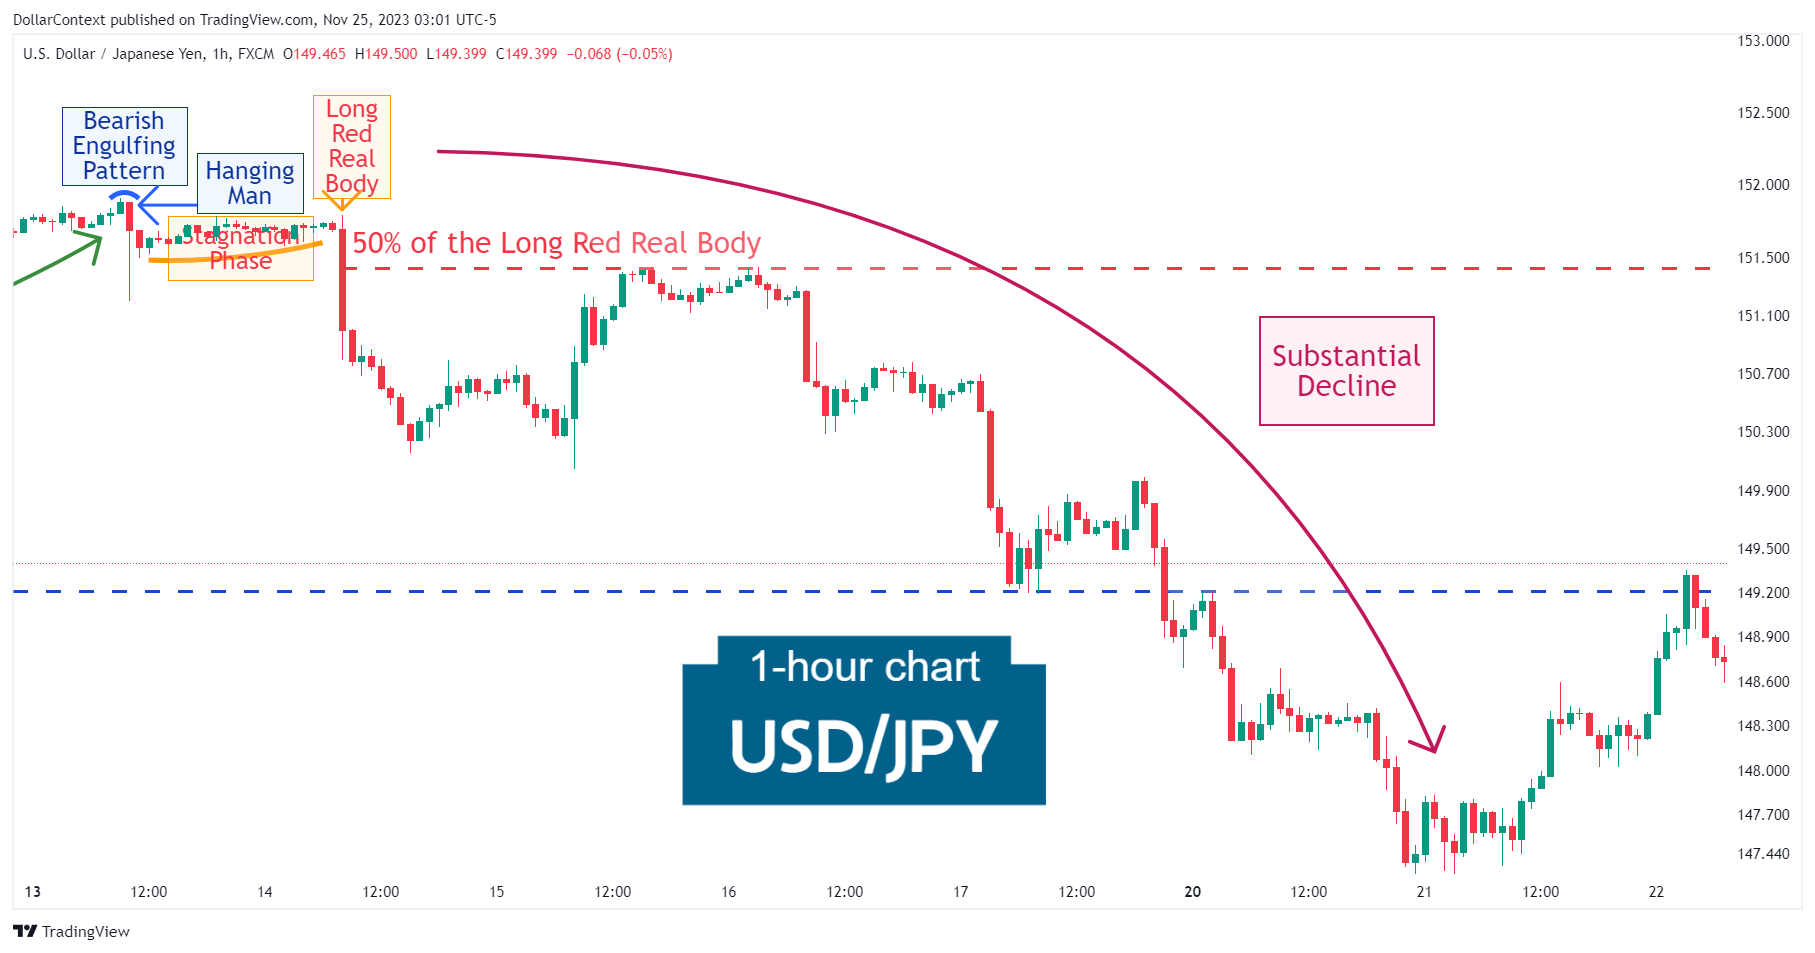
After the hanging man pattern, the USD/JPY pair entered a prolonged phase of stagnation near this pattern's high. Subsequently, a long red candle confirmed the top reversal, signaling the start of a new downtrend.
3. Resolution
It's important to note that before gaining downward momentum, the market underwent a retest of the resistance area established by the long red real body. This was followed by a substantial downtrend.

4. Conclusion and Retrospective Assessment
It is important to consider the emergence of simple, though not perfect, candlestick patterns after a prolonged uptrend. For example, in November 2023, the USD/JPY experienced a significant decline after displaying a bearish engulfing pattern and a somewhat imperfect hanging man.