Case Study 0030: Hammer and Engulfing Pattern (Gold)
In this article, we will discuss the performance of the gold market after the appearance of a hammer and a bullish engulfing pattern.
This case study examines a historical market setup observed in Gold in November 2023. It is intended for educational purposes and illustrates how specific candlestick patterns behaved in real market conditions.
Case Study Data Sheet (Historical)
- Reference: CS0030
- Security: Gold Spot
- Timeframe: Hourly Chart (November 13, 2023)
- Patterns:
1. Signal Formation
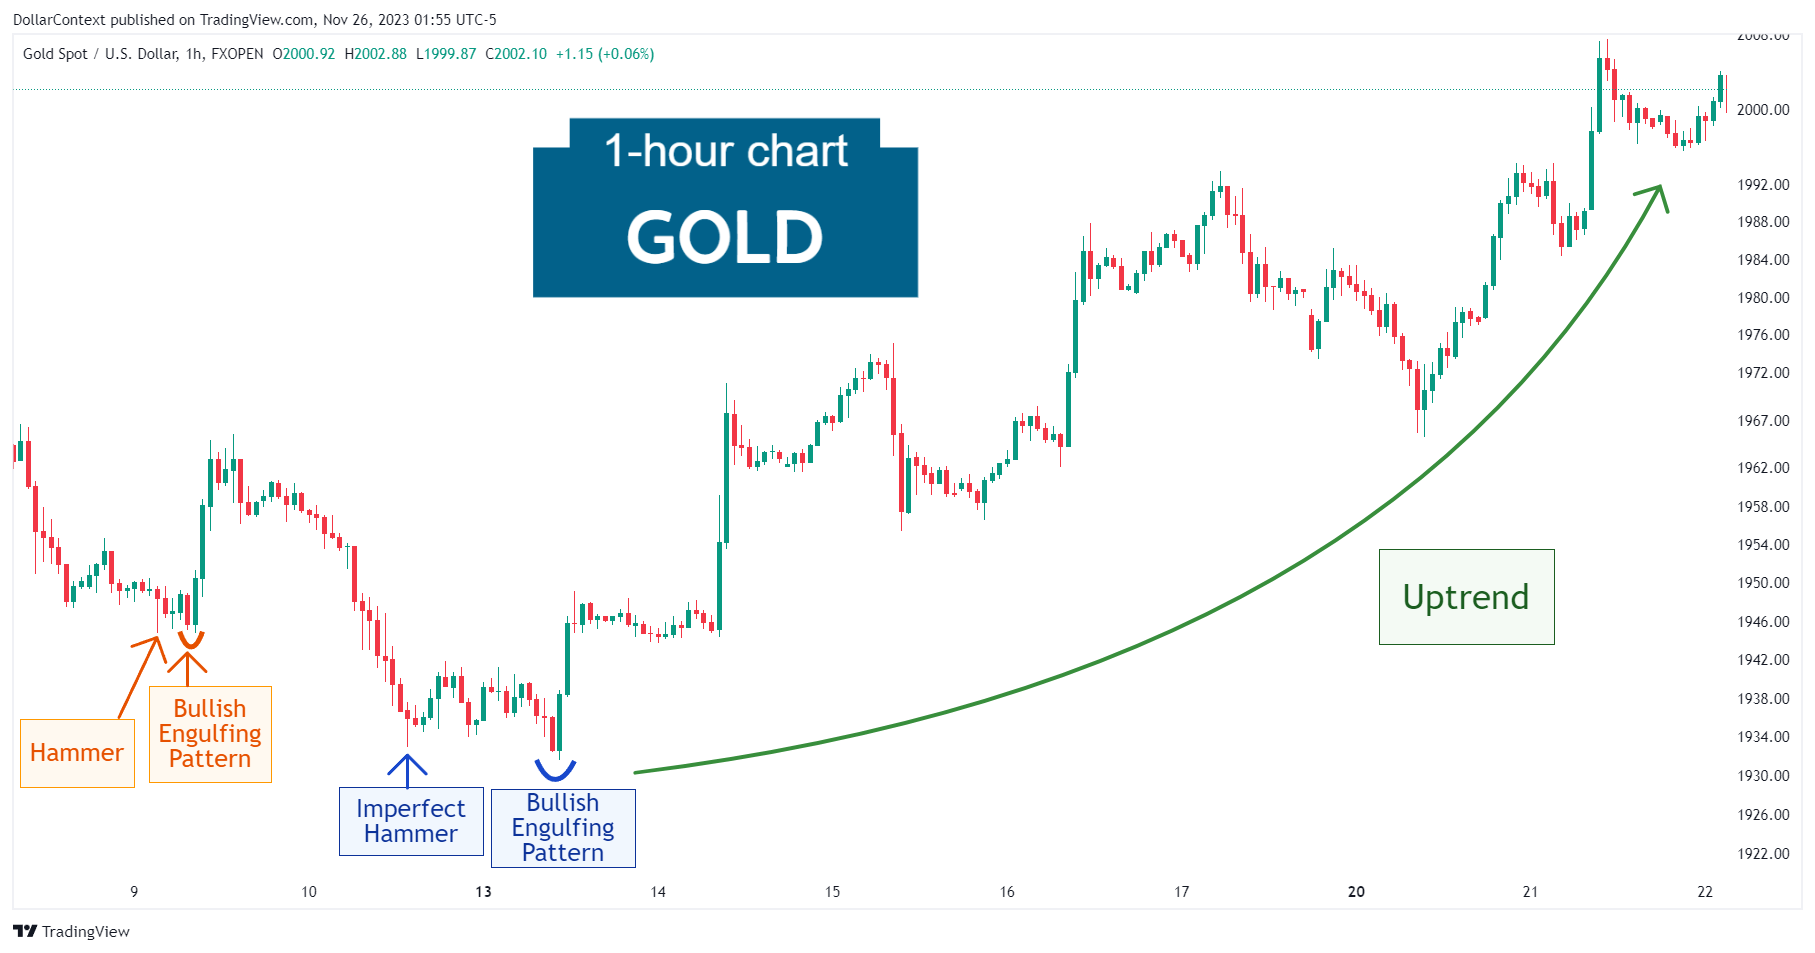
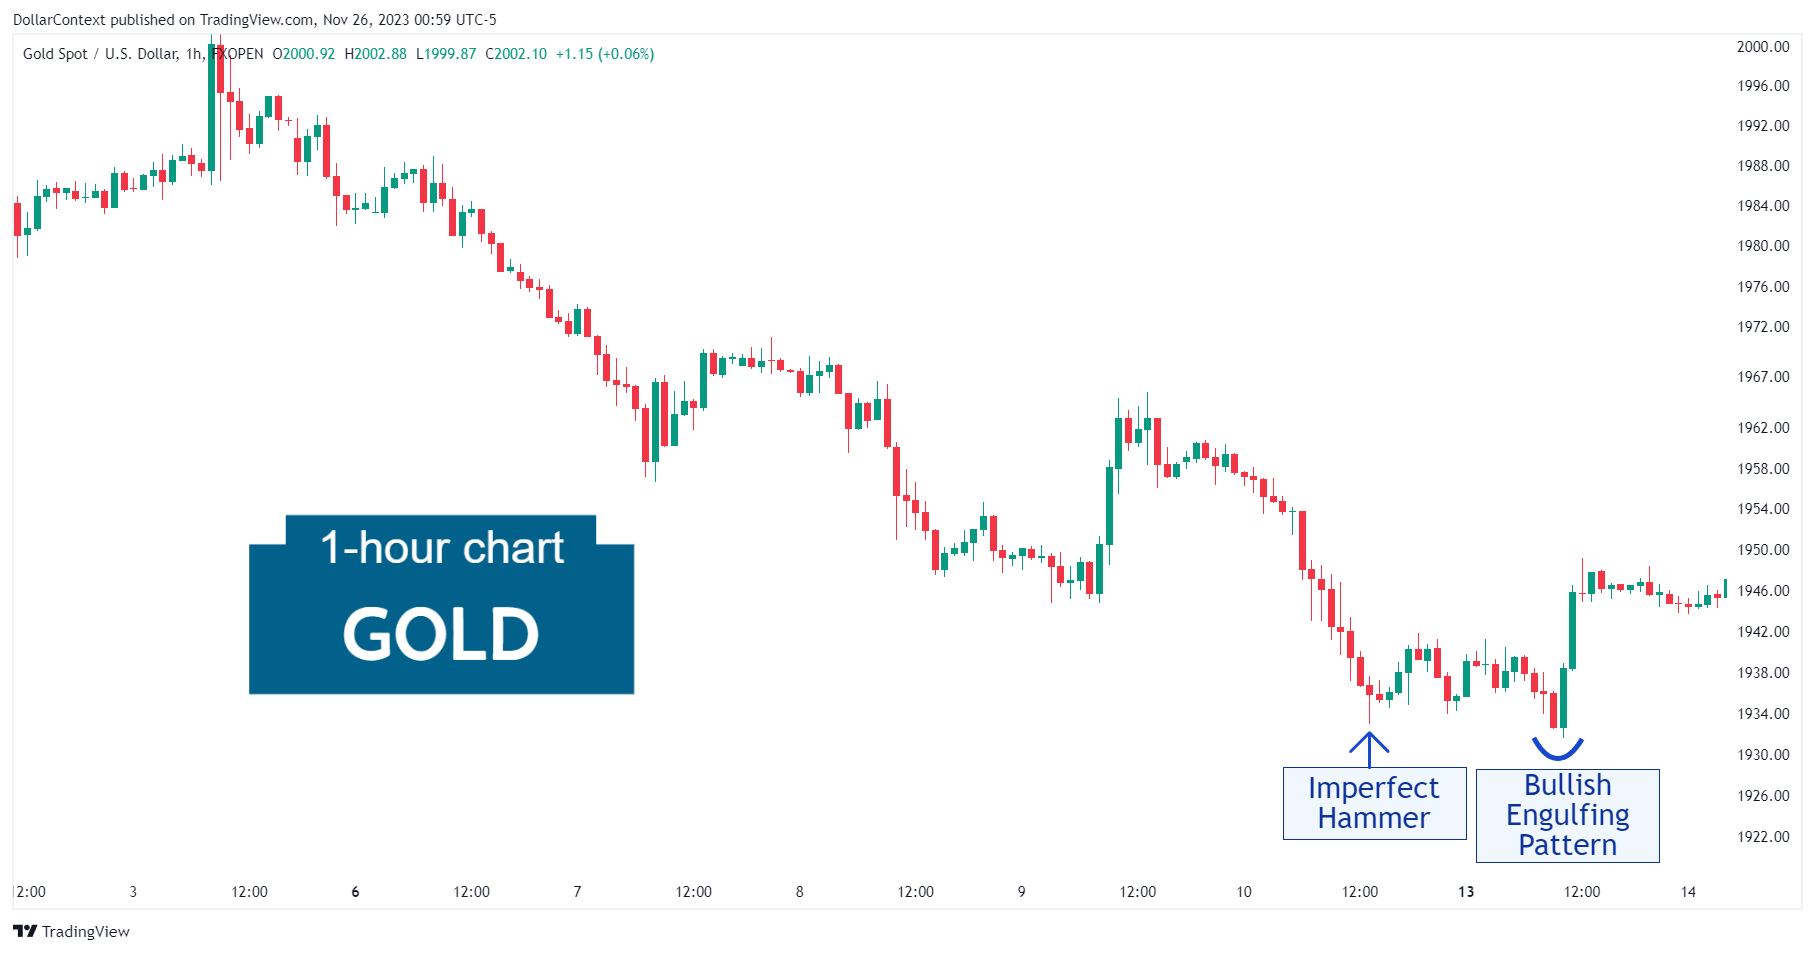
Following a prolonged bear market, gold prices showed an imperfect hammer candle. Twenty candle sessions latter, a bullish engulfing pattern emerged. Notice how the second candle of this pattern covers the preceding three candles.
Interestingly, the market had previously exhibited the same two-pattern combination (hammer and engulfing pattern), as indicated by the orange markers in the chart below.
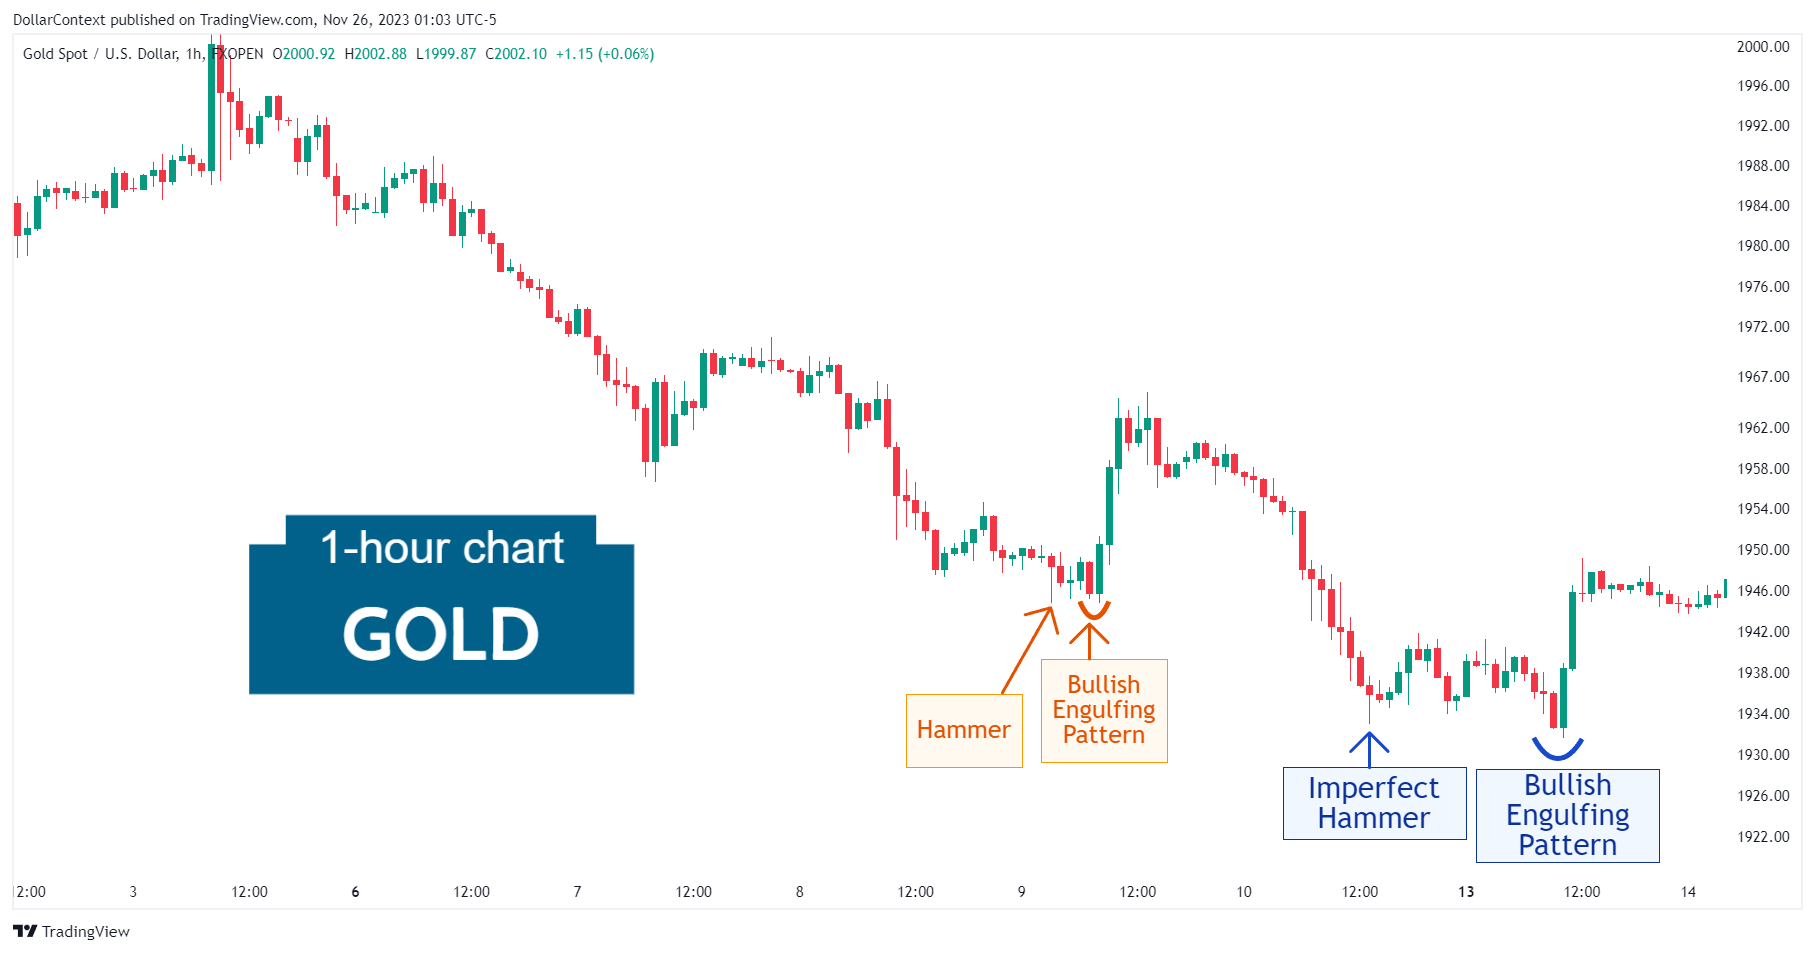
What are the key differences between these two scenarios?
- The time span between the two patterns is shorter in the first set.
- The initial two-pattern combination led to a minor rally, while the latter resulted in a major uptrend, as demonstrated in the following two sections.
2. Early Market Transition
The chart below illustrates that following the engulfing pattern, the market entered a definitive uptrend, without any further retesting of the lows.
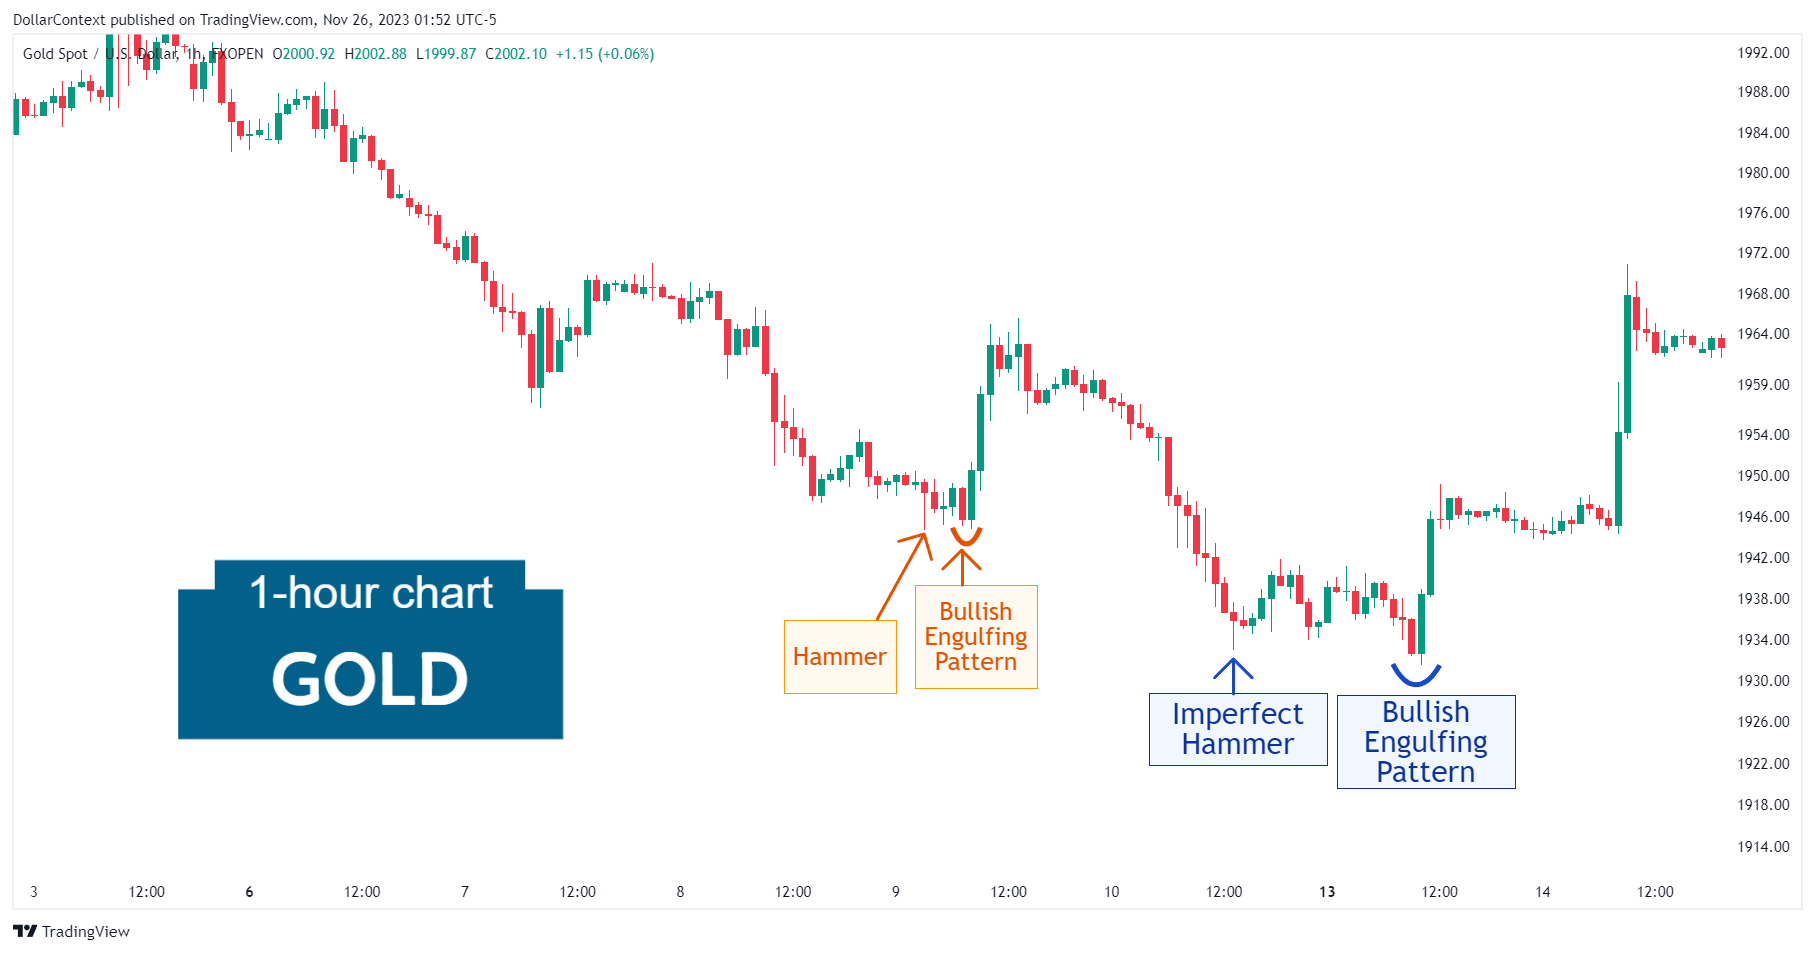
3. Resolution
Despite several back and forth price movements, the upward trend in gold prices remained intact for an extended period.

4. Conclusion and Retrospective Assessment
Candlestick patterns are often easy to recognize but challenging to interpret, as was the case in our analysis of the 1-hour gold chart. Here, two familiar sets of patterns, the hammer and engulfing pattern, yielded varying outcomes.