Gold: Comprehensive Review and Outlook
In-depth gold analysis covering fundamentals, technicals, and positioning. Violent February reversal from $5,564 created technical damage, but central bank accumulation and fiat currency concerns provide structural support. Critical $4,400 support test determines consolidation vs correction path.
✅ Last Reviewed: | 📝 Last Updated: | 📋 Full History →
Gold at a Glance
Directional Pressure on Gold:
Real rates modestly positive, Fed patience limits catalyst
🌎 GLOBAL FACTORSCentral bank accumulation and fiat stress provide floor
🧠 SENTIMENT & POSITIONINGCrowded positioning exposed, narrative challenged after reversal
📈 TECHNICAL STRUCTURESharp reversal from $5,564, critical support test underway
🎯 FINAL VERDICTStrategic (medium/long term)
Structural support intact, but consolidation needed after parabolic surge.
Tactical (near term)
Critical support test at $4,375-$4,400. Break risks correction to mid-$3,000s. Potential dollar strength adds headwind.
〰️ Forces Shaping Gold
Gold faces competing pressures in early 2026. While structural forces—central bank accumulation, persistent fiscal stress, and fiat currency concerns—provide durable long-term support, near-term dynamics create tactical headwinds. Potential dollar strength, modestly positive real rates, and the violent February reversal following Warsh's nomination all challenge the momentum that drove gold's 2024-2025 surge. From a macro perspective, consolidation or modest correction appears most likely before the structural bull case can reassert itself.
| Component | Current Assessment |
|---|---|
| REAL INTEREST RATES & FED POLICY |
Neutral to slightly bearish for gold
|
| U.S. DOLLAR DYNAMICS |
Potential near-term dollar strength creates headwind
|
| CENTRAL BANK GOLD ACCUMULATION |
Structural demand provides durable support
|
| FIAT CURRENCY & MONETARY SYSTEM STRESS |
Long-term bullish
|
| GEOPOLITICAL TENSIONS & SAFE-HAVEN DEMAND |
Elevated but not intensifying
|
🧠 Sentiment & Positioning
Gold sentiment has reached extreme bullish territory with positioning that creates meaningful reversal vulnerability. Fund managers have crowded into gold as the #1 most popular trade globally, reflecting deep anxiety about fiat currencies and geopolitical risks—but also exposing the market to sharp corrections if catalysts shift. The violent January 30 flash crash validated these crowding concerns.
| Component | Current Assessment |
|---|---|
| Bank of America Global Fund Manager Survey Jan 2026 |
Extreme crowding creates acute reversal vulnerability
The January 2026 BofA survey reveals unprecedented gold positioning extremes, with "Long Gold" dethroning the "Magnificent 7" as the world's most crowded trade. BofA's "Bubble Risk Indicator" for gold has risen to near 1.0, and the January 30 flash crash—where gold dropped 10% in a single session—validated the survey's contrarian warnings about dangerous positioning. Crowding at historic extremes
Drivers reflect deep systemic concerns
Flash crash validates contrarian warning
|
| DAILY NEWS SENTIMENT INDEX (DNSI) |
Moderately positive sentiment reduces safe-haven demand
|
📈 Technical Structure
Technical structure provides critical insight into whether gold's recent reversal represents orderly consolidation within a structural bull market or the beginning of a deeper correction. The following analysis examines monthly and weekly charts to distinguish between structured consolidation and meaningful correction.
| Technical Factor | Current Status | Structural Signal |
|---|---|---|
| MULTI-YEAR ASCENDING CHANNEL (2023-2025) | Parabolic departure in early 2026 |
Structured advance, now tested after euphoric departure
The ascending channel provided clear technical framework through 2024-2025, with boundaries consistently respected. However, the parabolic breakout above the upper boundary in early 2026 departed from this discipline. |
| EUPHORIC BREAKOUT & SHARP REVERSAL | Near-vertical surge from $4,300 to $5,564 followed by sharp multi-day collapse |
Extreme exhaustion pattern, significant technical damage
The parabolic acceleration and subsequent collapse exhibit classic blow-off top characteristics. The speed and magnitude of both moves suggest momentum-driven speculation followed by forced liquidation. |
| CANDLESTICK BEHAVIOR | Extremely long upper shadow at $5,564 peak; current price action testing former resistance zones |
Violent rejection signals positioning capitulation
The weekly candle spiked to $5,564 before collapsing to close near $4,846—one of the most dramatic upper shadows in gold's recent history. This pattern demonstrates violent rejection and creates significant overhead resistance. |
| CRITICAL SUPPORT TEST | Testing $4,375-$4,400 confluence: former resistance + ascending channel's upper boundary |
Two-way risk: hold suggests consolidation, break signals correction
Holding this support would suggest the structural bull market remains intact and gold can consolidate before resuming upside. A decisive break below $4,375 would trigger deeper retracement. Genuine two-way uncertainty rather than clear directional signal. |
Monthly Chart — Six Macro Regimes and the Current Hedge Phase
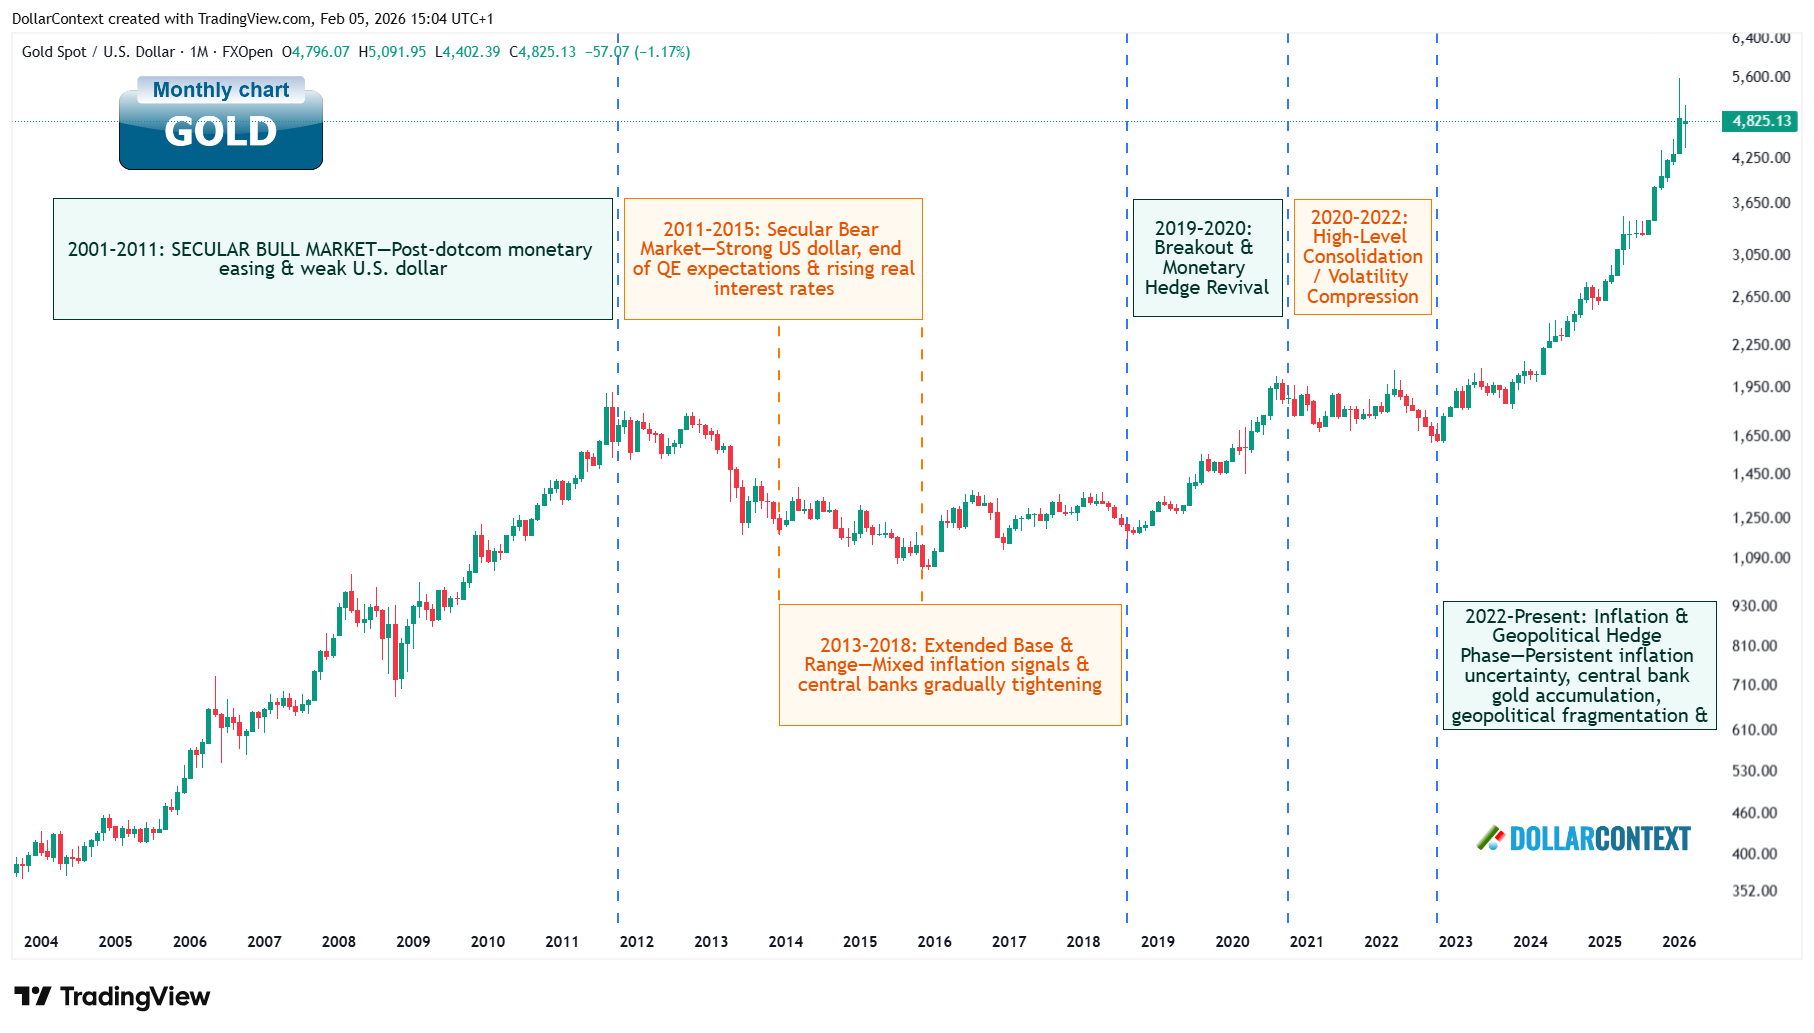
Since 2001, gold's trajectory has been defined by six structural macro regimes shaped by fundamental shifts in monetary policy and systemic risk. Rather than following standard technical patterns, these two decades of price action reflect the evolving relationship between real interest rates, dollar strength, and the perceived reliability of the global fiat system.
Summary of major gold regimes
- 2001–2011: Secular Bull Market — Post-dotcom monetary easing and persistent dollar weakness drove gold from ~$250 to $1,900, establishing gold as a monetary hedge against currency debasement and the 2008 financial crisis.
- 2011–2015: Secular Bear Market — Strong dollar, end of QE expectations, and rising real interest rates triggered a grinding decline to ~$1,050 as confidence in growth and financial stability returned, resetting speculative excess built during crisis years.
- 2013–2018: Extended Base Formation — Wide sideways range between $1,050-$1,400 as mixed inflation signals and gradual central bank tightening created accumulation phase where weak hands exited and institutional buyers built positions.
- 2019–2020: Breakout & Monetary Hedge Revival — Breakout from multi-year range driven by pandemic monetary response, collapsed real yields, and massive balance sheet expansion reasserted gold as store of value amid policy extremes.
- 2020–2022: High-Level Consolidation — Sideways volatility compression between $1,700-$2,050 as inflation-versus-rate-hikes tug-of-war and stronger dollar offset inflation hedge demand, transitioning gold from policy hedge to real-rate-sensitive asset.
- 2022–Present: Inflation & Geopolitical Hedge Phase — Rising long-term floor with repeated tests of all-time highs, driven by persistent inflation uncertainty, aggressive central bank gold accumulation, geopolitical fragmentation, and structural distrust in fiat currency stability.
Current Phase: Inflation & Geopolitical Hedge (2022–Present)
- Resilience despite higher nominal rates: Gold has maintained strength and challenged all-time highs even as nominal interest rates rose significantly—a departure from historical patterns suggesting the market is pricing structural rather than cyclical factors.
- Central bank accumulation at record pace: Official sector gold purchases have sustained well above pre-2022 averages, providing durable bid that supports prices independent of speculative positioning or short-term rate moves.
- Near-vertical 2024-2025 rally reflects currency skepticism: The explosive advance from ~$2,000 to above $4,300 demonstrated deep and widespread distrust of fiat currency systems, accelerating further to above $5,500 in early 2026 before the February reversal.
- February 2026 sharp correction from extreme heights: Multi-day selloff from above $5,500 following Warsh nomination exposed crowded positioning and challenged the "dollar debasement forever" narrative. The correction suggests the market may have overextended the structural thesis in the near term, though this still represents a massive gain from 2024 levels.
From a structural perspective, gold's behavior at the monthly timeframe is driven by regime shifts in monetary policy credibility and currency confidence rather than respect for traditional technical levels. The repeated ability to establish higher lows and challenge record highs despite elevated nominal rates confirms a fundamental repricing underway.
Key takeaway (monthly chart)
Gold's 25-year history confirms that major turning points align with fundamental shifts in real rates, dollar dynamics, and systemic confidence rather than technical price levels. The 2022-present inflation & geopolitical hedge phase represents a structural repricing of gold as a strategic reserve asset, though the February 2026 correction suggests near-term consolidation may be needed before the longer-term uptrend resumes.
Weekly Chart — Ascending Channel Breakout and Reversal
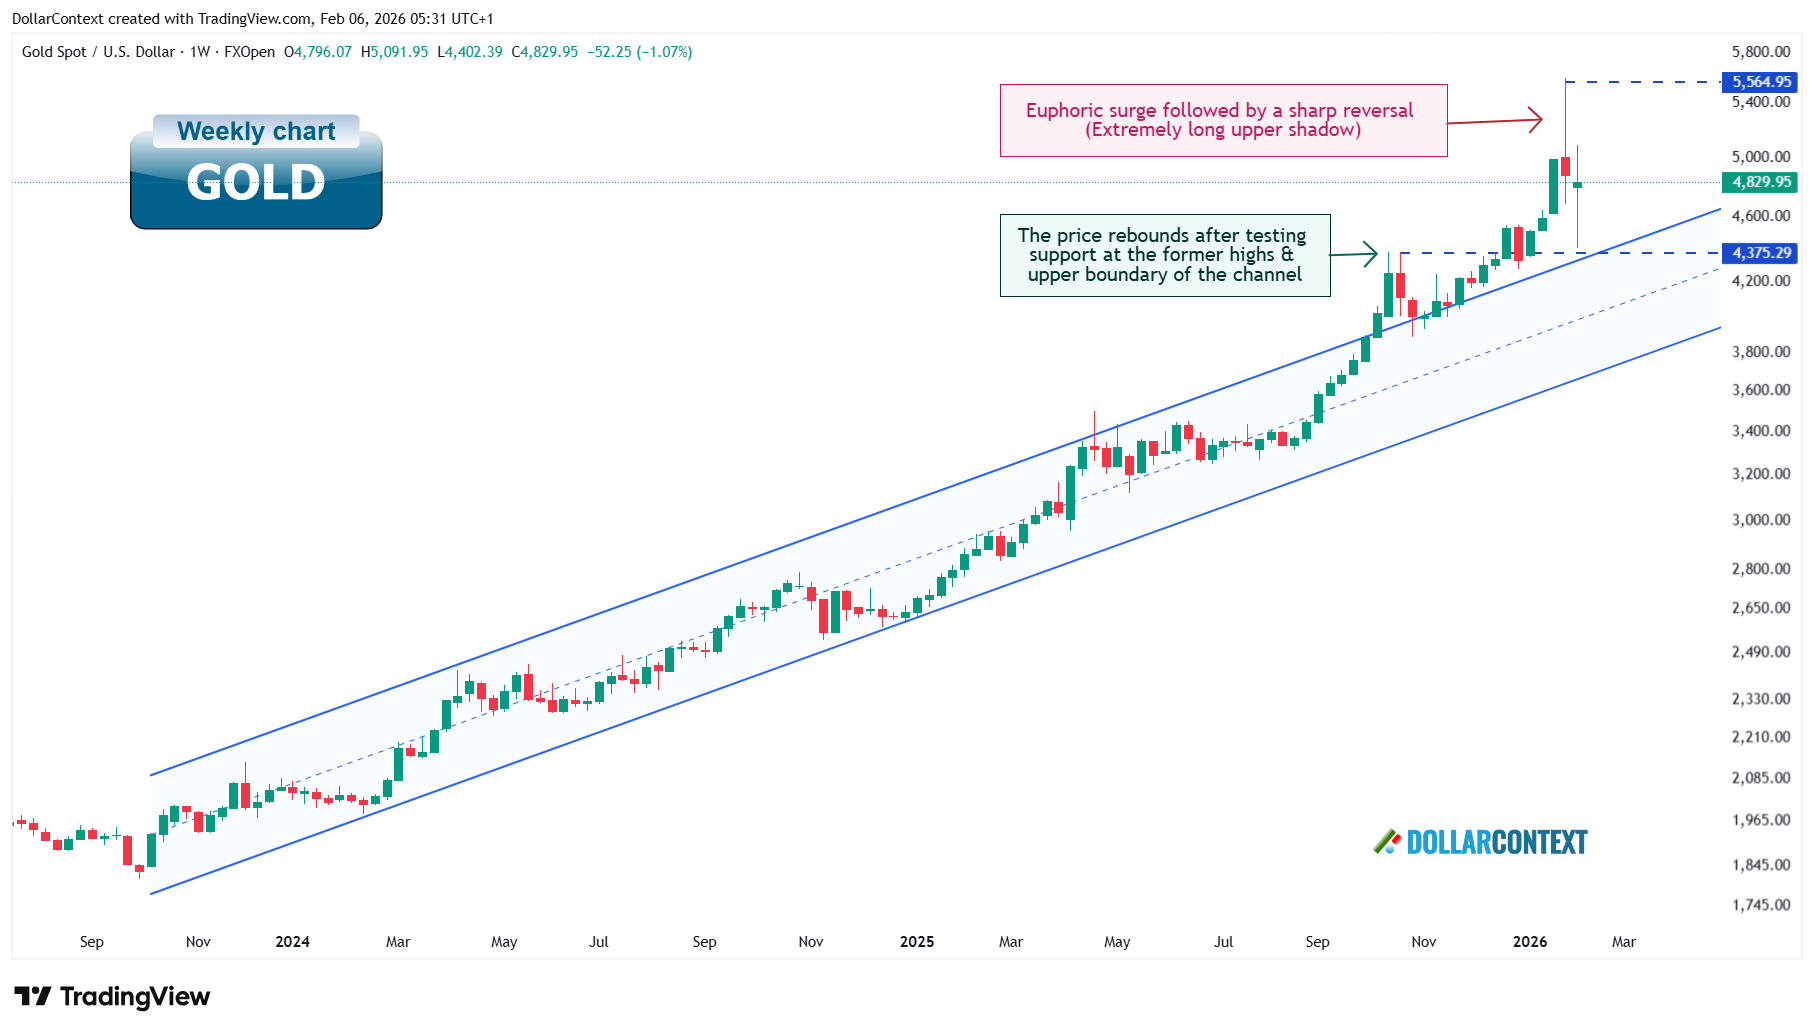
The weekly chart reveals how gold's 2024-2025 rally unfolded within an ascending parallel channel, followed by a euphoric surge and sharp reversal that now tests the sustainability of recent gains.
Ascending channel structure (late 2023–late 2025)
From late 2023 through most of 2025, gold advanced within an ascending channel. This structured advance reflected steady accumulation and rising confidence in gold's monetary hedge thesis, creating a sustainable uptrend rather than speculative mania.
Euphoric breakout and extreme reversal (late 2025–February 2026)
In late 2025 and early 2026, gold experienced a vertical acceleration above the upper channel boundary, surging from approximately $4,300 to above $5,564—a move that exhibited characteristics of exhaustion rallies rather than healthy trend extension:
- Parabolic price action: The near-vertical ascent departed sharply from the disciplined channel structure that had governed the prior advance, suggesting momentum-driven buying overwhelmed fundamental considerations.
- Extremely long upper shadow: The reversal week following Warsh's nomination produced one of the most dramatic upper shadows in gold's recent history—price spiked to $5,564 before collapsing back, closing the week near $4,846. This pattern typically signals violent rejection of extreme prices and capitulation of late-arriving bulls.
- Speed and magnitude of reversal: Multi-day selloff from above $5,500 to below $4,900 demonstrated the force of position liquidation when crowded trades unwind, rather than orderly profit-taking within an intact uptrend.
Current support test
Gold is now testing a critical confluence zone at $4,375-$4,400, where former mid-2025 resistance and the ascending channel's upper boundary converge. Whether this support holds or breaks will largely determine gold's near-term trajectory—detailed further in Key Technical Levels below.
Key Technical Levels
Critical support confluence ($4,375-$4,400)
The most important near-term technical zone sits at $4,375-$4,400, where multiple support elements converge:
- Former resistance turned support: This level marked consolidation highs in mid-2025 before the final parabolic surge, representing where breakout buyers established positions and may defend against further declines.
- Upper boundary of ascending channel: The broken channel's upper boundary now intersects near these levels, reinforcing this support confluence.
A sustained weekly close below $4,375 would signal that support has failed, likely triggering further technical selling and opening the door to deeper retracement toward the channel's lower boundary near $3,800-$4,000.
Resistance zone ($5,200-$5,564)
The zone where gold peaked and sharply reversed now represents formidable overhead resistance. Late-arriving bulls were trapped at these levels and will likely look to exit on any rally back toward breakeven. Reclaiming this zone requires new catalysts powerful enough to overcome trapped supply and rebuild market conviction.
Consolidation versus correction: Distinguishing scenarios
Gold's near-term price action will likely follow one of two paths:
- Consolidation scenario: If support holds at $4,375-$4,400, gold could stabilize and build a base over several weeks or months before attempting to challenge the highs. This would be consistent with healthy digestion of the rapid 2024-2025 gains and would keep the structural bull market intact.
- Correction scenario: If support breaks decisively, a retracement toward the ascending channel's lower boundary ($3,800-$4,000 area) would represent a deeper correction, potentially setting up a stronger foundation for future advances.
Limitations
These technical levels should not be treated as mechanical trading signals. Gold's behavior at this horizon is ultimately driven by shifts in real rates, dollar dynamics, central bank policy, and currency confidence rather than pure technical pattern recognition. Whether support holds or breaks will depend less on technical factors and more on whether fundamental drivers remain supportive enough to maintain conviction at current elevated price levels.
Technical Bottom Line
Gold's disciplined 2024-2025 ascending channel advance gave way to euphoric excess in early 2026, followed by a sharp reversal that now tests whether the bull market remains structurally intact. The critical $4,375-$4,400 support confluence will likely determine the path forward: hold this level and gold consolidates before potentially resuming the uptrend; break below and a deeper correction toward $3,800-$4,000 becomes probable. The speed and severity of the February selloff suggest genuine narrative reassessment rather than routine profit-taking, creating meaningful near-term uncertainty even as longer-term structural drivers remain supportive.
🎯 Final Verdict
Our comprehensive analysis across four key dimensions—domestic drivers, global factors, technical structure, and positioning—reveals a structurally bullish long-term outlook for gold, though near-term dynamics favor consolidation or correction following the euphoric surge and sharp February reversal.
Medium/Long-Term Outlook
Structural forces remain supportive. Central bank gold accumulation at record pace, persistent fiscal stress, geopolitical fragmentation, and deep skepticism about fiat currency stability provide durable fundamental support. These are policy-driven, strategic factors rather than speculative flows.
Technical structure confirms multi-year bull market intact. Despite the February selloff from $5,564, gold remains well above the 2024 starting point and within the broader ascending channel structure established since 2023. The monthly chart shows a continuation of the 2022-present inflation & geopolitical hedge phase, with rising lows confirming structural repricing underway.
Real rates provide modest headwind but not prohibitive. Modestly positive real rates historically weigh on non-yielding assets, but gold's resilience at these levels suggests the market is pricing structural rather than cyclical factors—central bank demand and currency concerns override traditional rate sensitivity.
Near-Term Tactical View
The February reversal demands respect and consolidation time. The extremely long upper shadow at $5,564 and rapid selloff to ~$4,846 exposed crowded positioning and challenged the "dollar debasement forever" narrative. Moves of this speed and magnitude typically require extended consolidation or deeper correction before resuming.
Critical support test at $4,375-$4,400 confluence. Gold now tests former resistance and the upper boundary of its ascending channel. Hold this level and consolidation appears likely; break below and deeper correction toward $3,800-$4,000 becomes probable.
Potential dollar rally creates additional headwind. Technical signals (DXY hammer at ~96), cross-asset developments (Bitcoin correlation breakdown, gold's own reversal), and positioning dynamics suggest a possible dollar move toward 104-106 over 2-3 months, adding tactical pressure as the market digests the parabolic 2024-2025 surge.
📝 Update History
- February 6, 2026: Initial publication
This analysis reflects market conditions and information available at the time of publication. It is provided for informational and educational purposes only and does not constitute financial, investment, or legal advice.
The financial markets are inherently volatile, and past performance is never a guarantee of future results. Readers should conduct their own independent research or consult with a licensed professional before making any investment decisions. Any actions taken based on the content of this report are at the sole discretion and risk of the reader, and the author assumes no liability for any potential losses or damages.