Gold's Great Wall: Three Scenarios After the January Crash
Gold's January crash was one of the sharpest short-term drops in recent memory. The rebound that followed has since stalled at 5,124 — a level that acted as resistance before the crash and has now rejected price twice since.
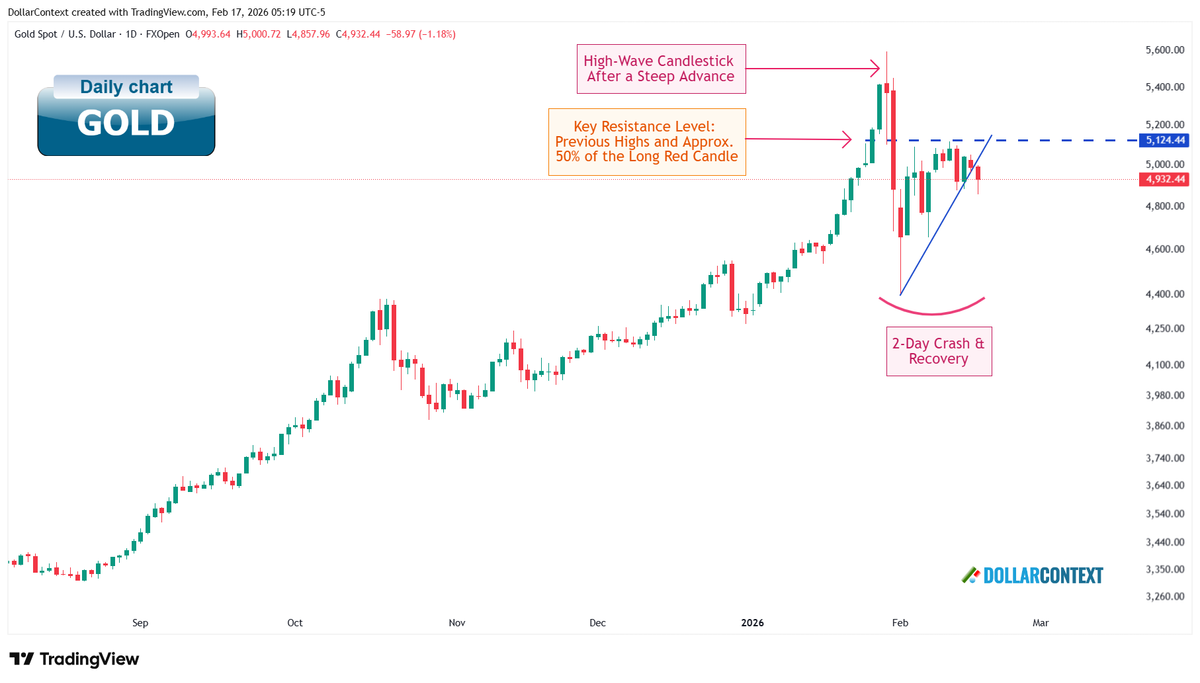
Gold entered 2026 on a historic run — then hit a wall. Between late January and early February, prices collapsed by roughly 20% in just two days, one of the sharpest short-term drops in recent memory. What followed was a swift recovery, but the rebound has since stalled at a level that keeps reappearing: 5,124. Understanding what that level means — and what happens next — is the central question for gold investors right now.
What Triggered the January–February Crash?
The sharp selloff that began around January 29 lacked a single, clear-cut catalyst. Kevin Warsh's nomination to a key policy role unsettled some market participants, but the more likely explanation is structural: gold had rallied almost vertically in prior weeks, reaching levels so extended from any meaningful support that a violent correction needed little external excuse to begin.
The daily chart captures this clearly. A high-wave candlestick appeared near the highs — a classic sign of indecision and exhaustion after a steep, prolonged advance — followed immediately by the two-day plunge and a recovery that has since struggled to clear prior levels. Crashes of this speed and magnitude, after trends of this length, are worth taking seriously as potential reversal signals, even when the longer-term story remains constructive.
The Great Wall: Why 5,124 Keeps Holding
The 5,124 zone has now acted as resistance on three separate occasions: January 26 — before the crash, when price first stalled and reversed at this level — and again on February 4 and February 11, as the post-crash rebound ran into the same ceiling. The fact that sellers have defended this level both before and after the crash adds to its significance.
What Makes This Zone So Significant
Prior resistance acting as a ceiling
The 5,124 area corresponds to previous highs that were reached on multiple occasions before the crash.
The 50% rule on the long red candle
The January 30 session produced an unusually long bearish candle — the kind of real body that stands out as exceptional when compared to the prior weeks of price action. The approximate midpoint of that candle aligns closely with 5,124. In technical analysis, the 50% retracement of an outsized candle frequently acts as meaningful resistance, particularly when the candle itself is historically unusual.
The combination of these two factors — prior highs and the 50% midpoint of an exceptional bearish candle — makes 5,124 a level that deserves close attention. A decisive, sustained break above it would materially change the short-term outlook.
Zooming Out: What the Weekly Chart Shows
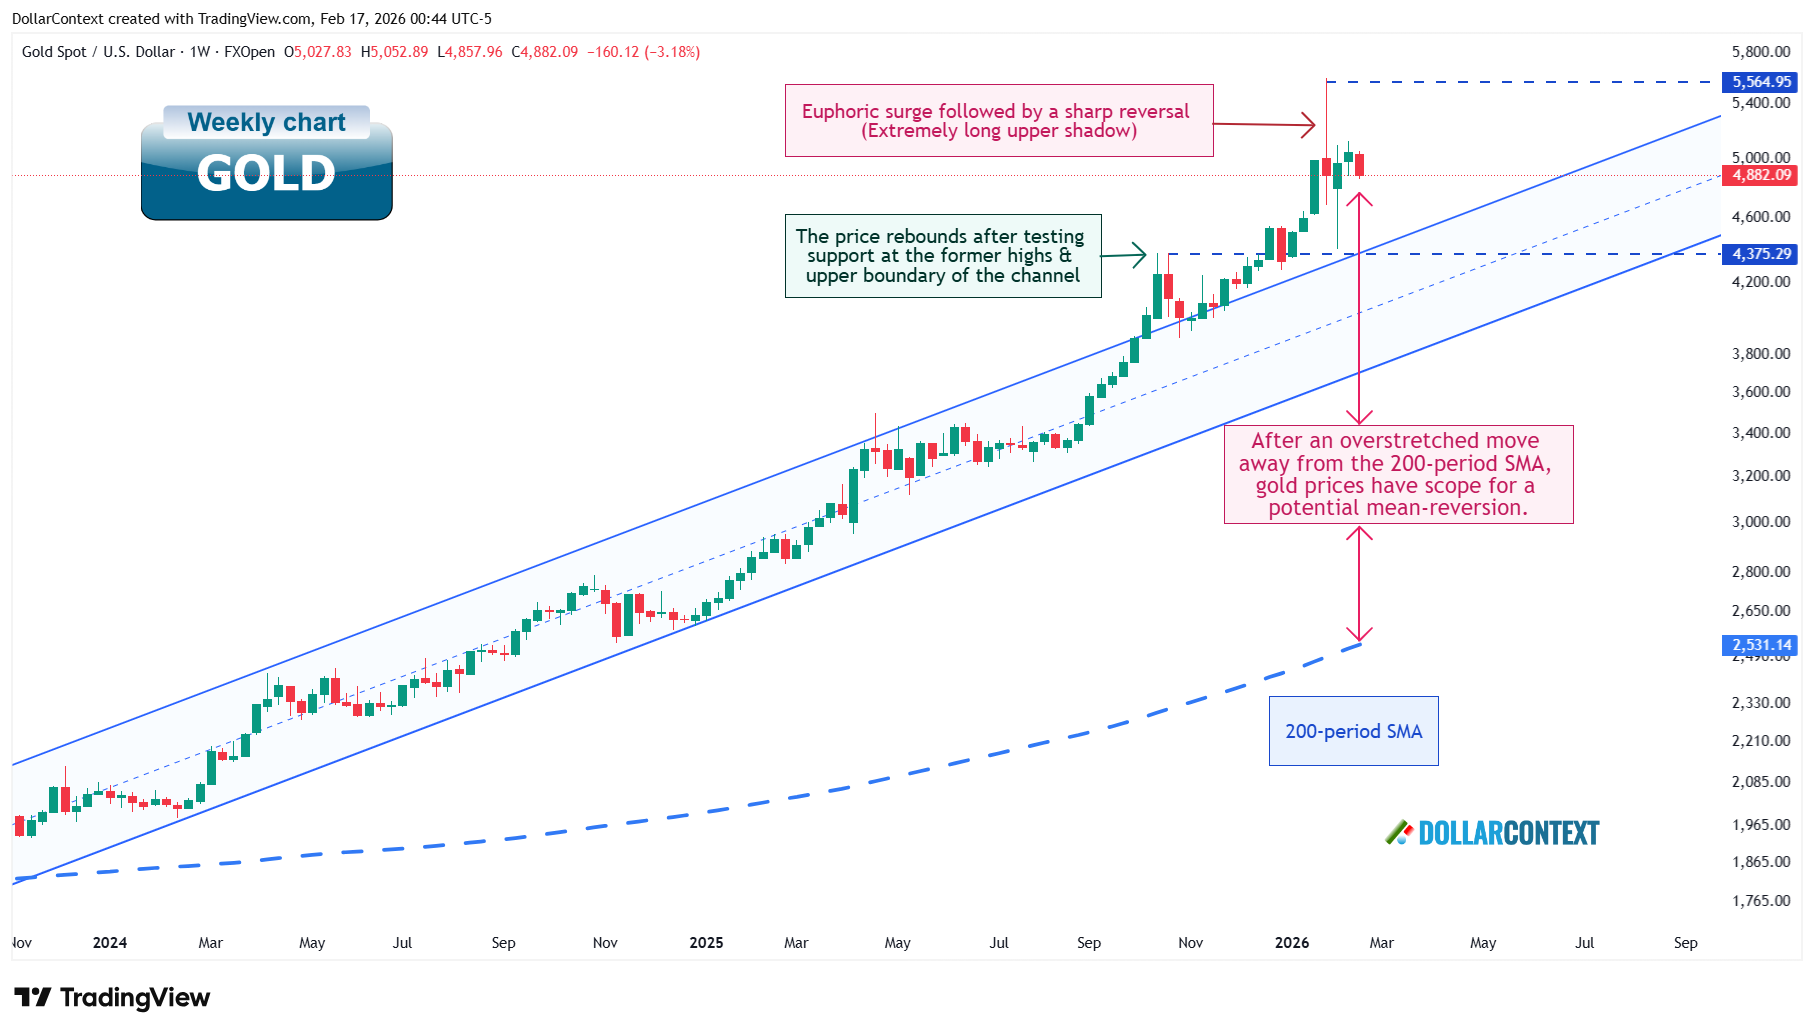
Stepping back to the weekly timeframe adds important context. Gold's rally from late 2024 into early 2026 was extraordinary by historical standards — but the weekly chart now shows an extremely long upper shadow on the most recent completed candle, a formation often associated with euphoric buying followed by swift rejection.
Equally notable: gold has stretched far above its 200-period weekly SMA (currently near 2,531). Historically, extreme deviations from this moving average have eventually resolved through either consolidation or a more meaningful pullback. This doesn't mean a correction to 2,531 is imminent or even likely in the near term — but it does underscore that the medium-term risk/reward is more complex than a simple continuation of the uptrend.
The Bull Case Isn't Dead: A Still-Supportive Macro Backdrop
Despite the technical warning signs, the macro environment that drove gold's historic rally hasn't materially changed. Several structural forces continue to provide a medium- to long-term floor under prices:
- The U.S. fiscal deficit remains large and shows few signs of meaningful contraction, sustaining demand for hard-asset alternatives.
- Dollar credibility concerns persist among global investors and sovereigns, with distrust in the dollar as a long-term store of value continuing to build.
- Central bank gold accumulation has remained a consistent feature of the global financial landscape, providing structural demand that doesn't evaporate with short-term price moves.
- Geopolitical tensions — including the still-evolving U.S.–Iran standoff, with Washington escalating military pressure ahead of high-stakes negotiations — add a near-term risk premium that historically benefits gold.
These aren't minor or fleeting factors. They represent the durable underpinning of the gold bull market — and they argue against any view that dismisses the current pause as the end of the story.
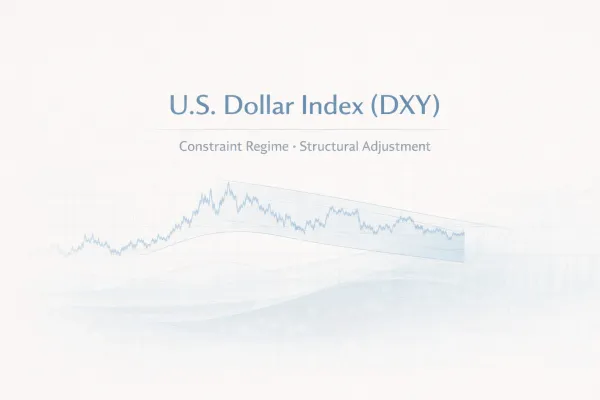
A Confirming Signal from the Dollar
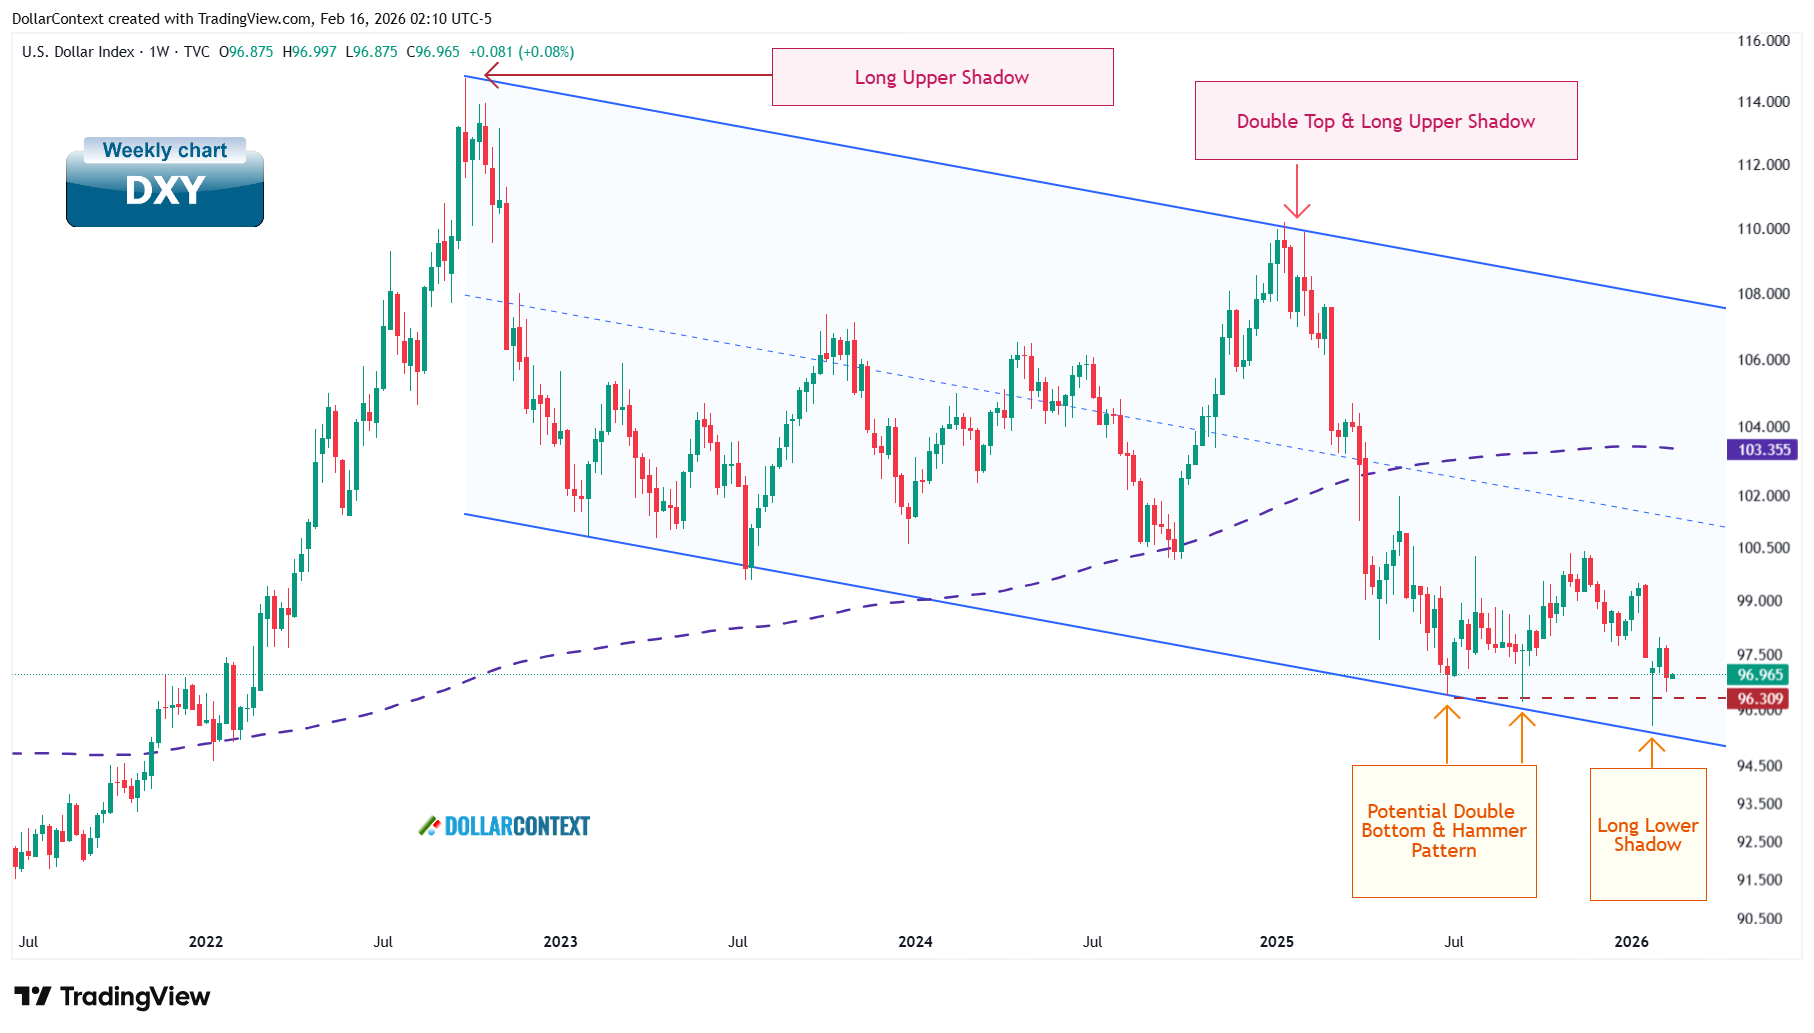
As discussed in our DXY analysis, the weekly dollar chart recently printed a long lower shadow candlestick — a sign of buying pressure and rejection at the lower boundary of a multi-year descending parallel channel. A potential double bottom pattern is forming near the 96 area, adding weight to the possibility of at least a near-term dollar recovery.
Gold and the dollar don't always move in perfect opposition, and short-term correlations can break down. But a dollar rebound from a technically significant support zone does raise the probability of renewed headwinds for gold — and in the current setup, it serves as a meaningful secondary confirmation that the path of least resistance for gold may not be straight up.
Three Scenarios to Watch
Scenario 1: Outright Reversal
A crash of this speed and depth — roughly 20% in two days after a prolonged, near-vertical uptrend — is a classic reversal signal in technical analysis. History doesn't repeat, but patterns like this have often marked at least an intermediate-term top. If gold continues to fail at 5,124 and begins making lower highs, the reversal thesis would gain further credibility. Under this scenario, the 4,375 support zone (the former channel highs visible on the weekly chart) becomes the first meaningful level to monitor on the downside.
Scenario 2: Broad Range Near the Highs
Perhaps the most plausible near-term outcome given the conflicting signals: gold enters a wide trading range between roughly 4,375 and 5,124, digesting the January surge without decisively breaking in either direction. This would allow the macro environment to remain supportive while technicals work off the excesses of the prior rally. Ranges of this kind after euphoric moves can persist for weeks or months before resolving.
Scenario 3: Resumption of the Uptrend
Of the three scenarios, this currently appears the least likely — though it cannot be dismissed outright. If gold manages a decisive and sustained break above 5,124, the technical picture would shift meaningfully, and the bull case would reassert itself with the macro tailwinds adding fuel. Until that break occurs, however, treating a resumption as the base case would require ignoring a significant weight of evidence pointing the other way.
Key Levels to Monitor
- 5,124: The Great Wall — prior resistance zone and approximate 50% mark of the January 30 bearish candle. A sustained break above this level would be the clearest signal that the uptrend is resuming.
- 4,375: Former channel highs and prior resistance-turned-support on the weekly chart. A breakdown below this area would significantly strengthen the reversal thesis.
- 2,531: The 200-period weekly SMA — a distant but structurally important reference for longer-term mean-reversion risk.
Bottom Line
The January–February crash did not break the structural case for gold — the macro backdrop remains intact, and geopolitical pressures continue to provide a near-term bid. But the technical damage is real: a 20% two-day drop after a near-vertical advance is not easily dismissed, and the repeated failure at 5,124 keeps the reversal and range-bound scenarios alive. The most likely path, given currently available data, is a protracted consolidation near the highs — with the resolution depending heavily on whether buyers can mount a convincing challenge to the Great Wall, or whether sellers reassert control below 4,375.
This analysis reflects market conditions and information available at the time of publication. It is provided for informational and educational purposes only and does not constitute financial, investment, or legal advice.
The financial markets are inherently volatile, and past performance is never a guarantee of future results. Readers should conduct their own independent research or consult with a licensed professional before making any investment decisions. Any actions taken based on the content of this report are at the sole discretion and risk of the reader, and the author assumes no liability for any potential losses or damages.