Nasdaq-100: Comprehensive Review and Outlook
The Nasdaq-100's 17-year ascending channel remains intact, with price consolidating near highs rather than showing reversal signals. Resilient growth supports earnings, but an evolving AI capex narrative and elevated sentiment argue for patience before the next leg higher.
✅ Last Reviewed: | 📝 Last Updated: | 📋 Full History →
Nasdaq-100 at a Glance
Directional Pressure on Nasdaq-100:
Resilient growth supports earnings; Fed policy priced in and not a major driver
🧠 SENTIMENT & POSITIONINGElevated conviction with growing cracks — invested but watching the exit
📈 TECHNICAL STRUCTURE17-year ascending channel intact; consolidating near highs with no reversal signals
🎯 FINAL VERDICTStrategic (medium/long term)
Structural bull market intact, supported by resilient growth and earnings. AI capex narrative is the key variable.
Tactical (near term)
Consolidating in 24,000-26,000 range near highs. Elevated sentiment reduces margin of safety; breakout above 26,000 would confirm next leg.
〰️ Forces Shaping the Nasdaq-100
The Nasdaq-100 enters 2026 supported by resilient economic growth and earnings delivery, but facing a shifting narrative around AI capital spending sustainability and elevated—though not yet extreme—sentiment. Fed policy is largely priced in and unlikely to be a major catalyst in either direction. The balance of forces remains constructive, though the index's reliance on a narrow group of mega-cap names and early questions about AI investment returns introduce vulnerabilities that bear monitoring.
| Component | Current Assessment |
|---|---|
| FED POLICY & RATE SENSITIVITY |
Largely priced in, not a major driver in either direction
|
| BROADER ECONOMIC GROWTH |
Resilient growth supports earnings and risk appetite
|
| AI CAPEX SUSTAINABILITY |
Narrative shifting, but not yet impacting earnings
|
| CONCENTRATION RISK (MAG 7 DOMINANCE) |
Moderate concern — watching but not critical
|
🧠 Sentiment & Positioning
Fund manager sentiment is rotating away from dollar dominance and toward a more constructive euro outlook. The shift is meaningful but not extreme—positioning favors EUR/USD recovery over the medium term while leaving room for near-term dollar strength to play out first.
| Component | Current Assessment |
|---|---|
| Bank of America Global Fund Manager Survey Jan 2026 |
Elevated conviction with growing cracks — invested but watching the exit
|
📈 Technical Structure
Technical structure remains firmly bullish, with the Nasdaq-100 advancing within a 17-year ascending channel and consolidating near highs rather than showing reversal signals. The following analysis examines monthly and weekly charts to assess the uptrend's health and identify key levels that define the path forward.
| Technical Factor | Current Status | Structural Signal |
|---|---|---|
| LONG-TERM ASCENDING CHANNEL (2009-PRESENT) | Price trading in the upper portion near ~25,200 |
Structural bull market confirmed, 17-year framework intact
The ascending channel has contained most rallies and corrections since 2009. Both boundaries provide a reliable structural framework. Current position in the upper half is consistent with continued upside, though the rate of advance may moderate as price approaches the upper boundary. |
| CANDLESTICK BEHAVIOR | Piercing pattern confirmed at channel floor; bearish engulfing near highs failed to produce reversal |
Bullish absorption at lows, no confirmed reversal at highs
The piercing pattern at the channel's lower boundary in early 2025 confirmed structural support and fueled the current advance. The bearish engulfing near the highs transitioned into a trading range rather than a breakdown—reducing its significance as a reversal signal. |
| NEAR-TERM RANGE FORMATION (24,000-26,000) | Sideways consolidation near highs since late 2025; no directional resolution yet |
Digestion within uptrend, favors eventual upside resolution
The range is forming near highs rather than after a breakdown, which is characteristic of a pause within a bull market rather than distribution ahead of a decline. However, the range has not resolved, leaving near-term direction uncertain until a breakout above 26,000 or break below 24,000 provides clarity. |
| KEY SUPPORT LEVELS | Horizontal support at ~22,287; deeper structural floor at ~16,569 and channel lower boundary |
Multiple layers of support reinforce structural integrity
The 22,287 level—former resistance turned support—provides a meaningful floor beneath the current range. The channel's lower boundary and the 16,569 horizontal offer deeper structural support. This layered support structure limits downside risk and reinforces the bull market's foundation. |
Monthly Chart — Long-Term Ascending Channel and Upper Boundary Approach
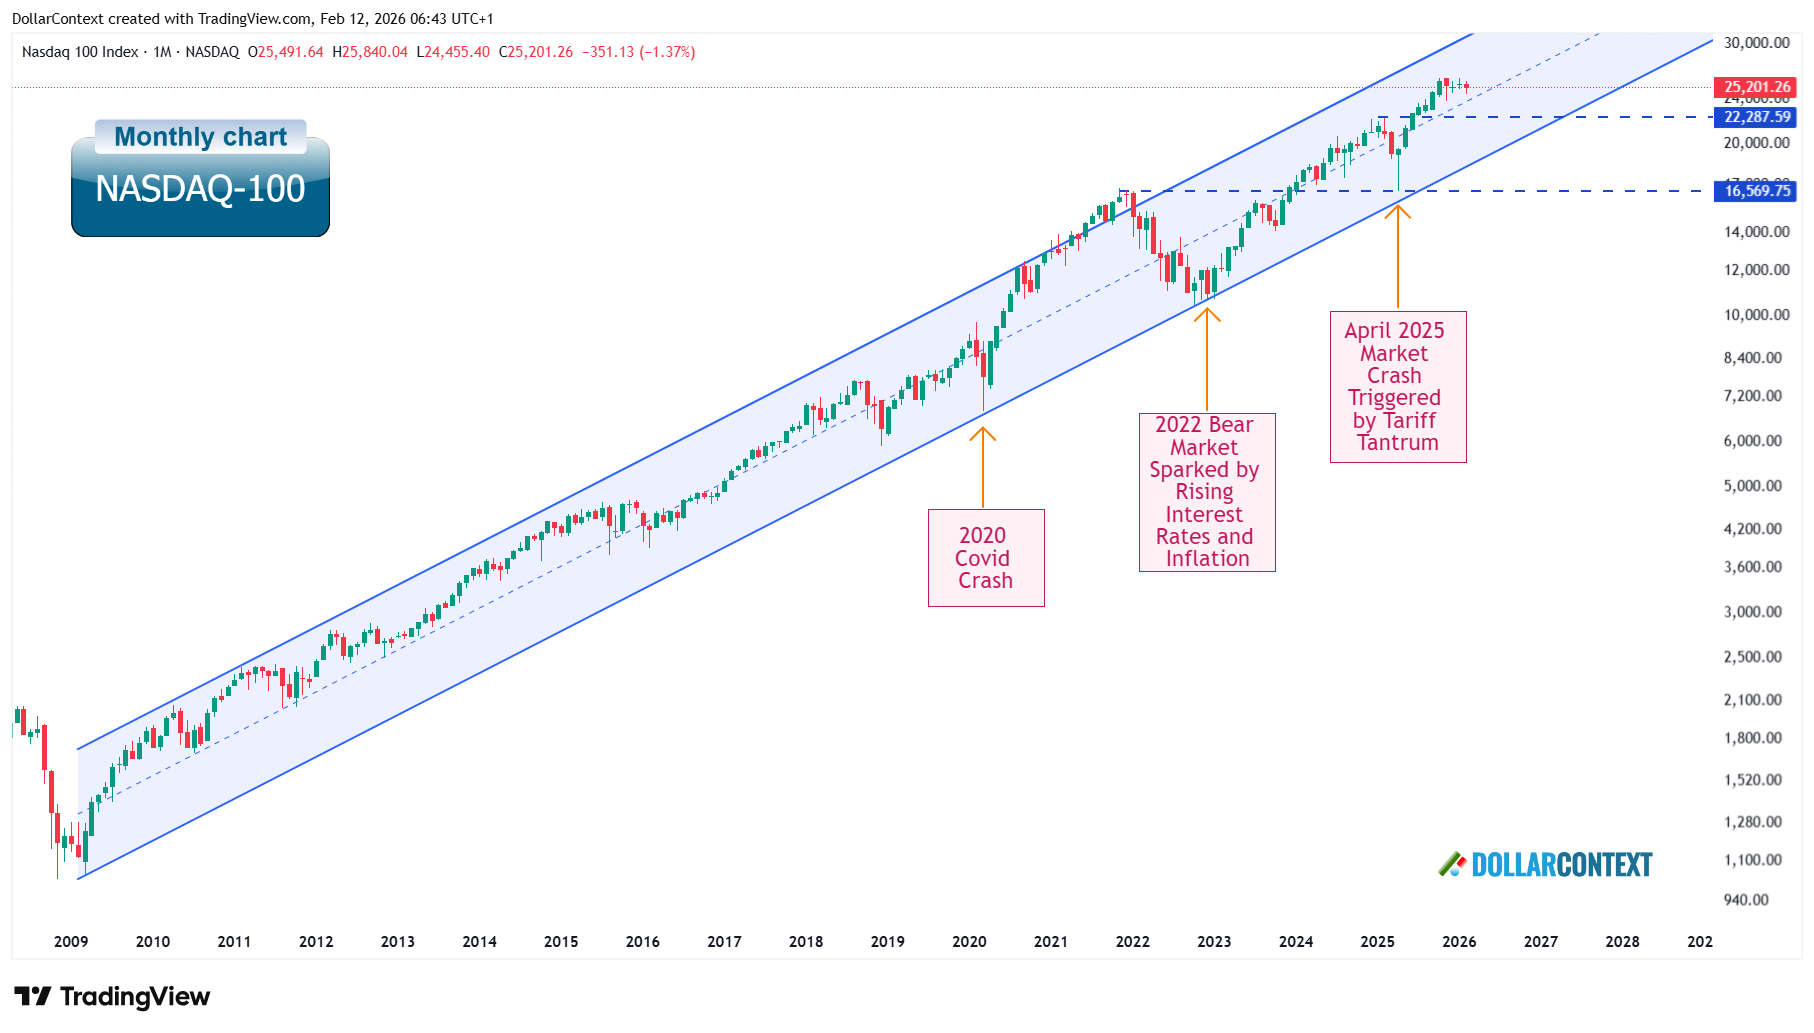
Since the 2009 lows, the Nasdaq-100 has advanced within a well-defined ascending parallel channel that has contained most major rallies and corrections over the past 17 years. The index is currently trading at ~25,200, in the upper portion of this channel and approaching a zone where prior advances have historically stalled or corrected.
Ascending channel structure (2009–Present)
The ascending channel has provided a remarkably consistent framework for the Nasdaq-100's structural advance. The lower boundary caught major corrections—including the 2020 COVID crash and the 2022 bear market—while the upper boundary capped rallies in 2020 and 2024-2025. This multi-decade structure remains the dominant technical reference for the index.
Current position: upper half of channel, approaching resistance
The Nasdaq-100 is trading in the upper portion of its ascending channel, with recent price action showing some hesitation near current levels:
- Upper channel boundary (~29,000-30,000): The ascending channel's upper boundary sits above current prices and has historically marked zones where rallies decelerate or reverse. While not an immediate ceiling, proximity to this boundary suggests the rate of gains may slow even if the uptrend continues.
- Horizontal support at ~22,287: This level acted as resistance in early 2025. It represents the first major structural floor beneath current prices and a level where buyers would likely re-emerge on a correction.
- Deeper support at ~16,569: A longer-term horizontal reference aligned with the 2025 market crash lows.
Key takeaway (monthly chart)
The monthly chart confirms a structural bull market that has been intact since 2009. Current levels in the upper portion of the channel are consistent with continued upside, though the rate of advance is likely to moderate as the index approaches the upper boundary. Horizontal support at ~22,287 provides a meaningful floor on any correction, while the channel's lower boundary offers deeper structural support.
Weekly Chart — Channel Advance, Candlestick Signals, and Range Formation
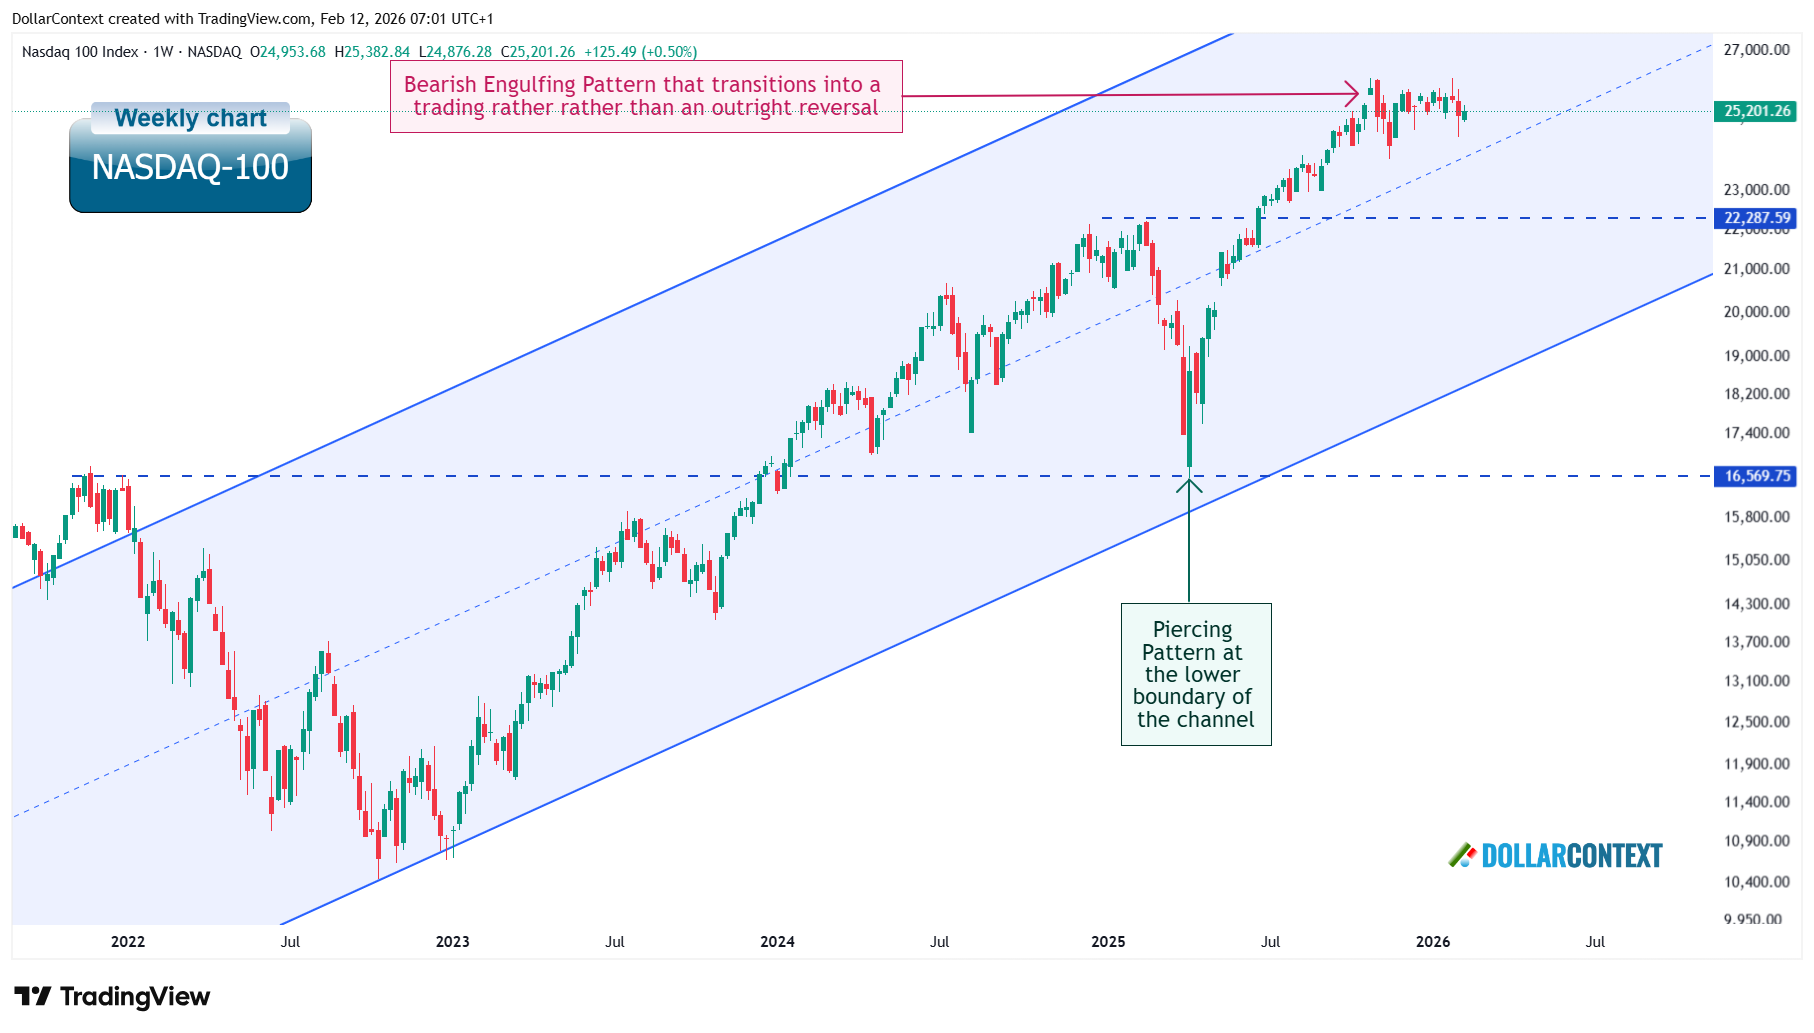
The weekly chart provides a closer look at the Nasdaq-100's advance within the ascending channel, highlighting two notable candlestick patterns that clarifies the current technical picture.
Bullish absorption at the channel floor (early 2025)
During the correction into early 2025, the Nasdaq-100 formed a piercing pattern at the ascending channel's lower boundary—a bullish reversal signal where price opens below the prior candle's close but recovers to close well into its upper half. This pattern confirmed the channel floor as active structural support and launched the rally that carried the index back toward current levels near 25,200.
Bearish engulfing transitions into range, not reversal (late 2025)
Near the recent highs, the Nasdaq-100 produced a bearish engulfing pattern—typically a reversal signal. However, the follow-through has been notably absent:
- Range formation rather than breakdown: Instead of triggering a sustained decline, the bearish engulfing led to a sideways consolidation roughly between 24,000 and 26,000.
- Holding above 22,287 is constructive: The horizontal reference at ~22,287 sits well below the current range and has not been threatened. As long as this level holds, the consolidation near highs reads as digestion within an uptrend rather than distribution ahead of a breakdown.
Key takeaway (weekly chart)
The weekly chart shows a market that is consolidating near highs rather than reversing. The piercing pattern at the channel floor confirmed structural support and fueled the current advance, while the bearish engulfing near the highs has failed to produce meaningful downside follow-through—transitioning into a trading range instead. This pattern of bullish absorption at lows and range formation at highs is consistent with a market that needs time to digest gains before the next directional move, favoring eventual upside resolution as long as the 22,287 support holds.
🎯 Final Verdict
Our comprehensive analysis across four key dimensions—domestic drivers, global factors, technical structure, and positioning—reveals a market that remains structurally sound but is digesting its gains near highs. The bull case is intact, supported by resilient growth and a 17-year ascending channel, though an evolving AI capex narrative and elevated sentiment argue for moderated near-term expectations.
Medium/Long-Term Outlook
Structural bull market is firmly intact. The Nasdaq-100's ascending channel since 2009 has contained every correction and remains well-respected. Multiple layers of support—horizontal at 22,287 and the channel floor—provide a robust foundation. No reversal signals are present at the structural level.
Resilient economic growth sustains earnings. The U.S. economy continues to deliver durable growth that supports the tech earnings trajectory underlying the index. As long as the economy avoids recession, the Nasdaq-100's premium valuations remain justifiable—even if the pace of gains moderates from the 2023-2024 surge.
AI capex narrative is the key variable to monitor. The early stage debate about whether massive AI capital expenditure will generate proportionate returns is the most important fundamental development for the medium-term outlook. This is not yet an earnings problem—but if the narrative shift intensifies through 2026, it could gradually erode the valuation premium the market assigns to AI-driven growth.
Near-Term Tactical View
Range formation near highs suggests digestion, not distribution. The Nasdaq-100 is consolidating between roughly 24,000 and 26,000 following the recovery from the early 2025 correction. This range is forming near highs and above key support—a pattern more consistent with a pause within an uptrend than a topping process.
Elevated sentiment reduces the margin of safety. Fund managers remain overweight tech at 32% net, but conviction is increasingly tactical—"renting, not owning." Record low cash levels and minimal hedging leave the market vulnerable to negative surprises, even if positioning has not reached the kind of extremes that reliably signal reversals.
Breakout above 26,000 would confirm the next leg higher. Resolution of the current range to the upside would signal that the digestion phase is complete and open the path toward the upper channel boundary near 29,000-30,000. Until then, the near-term outlook favors patience within a constructive setup rather than aggressive positioning.
📝 Update History
- February 12, 2026: Initial publication
This analysis reflects market conditions and information available at the time of publication. It is provided for informational and educational purposes only and does not constitute financial, investment, or legal advice.
The financial markets are inherently volatile, and past performance is never a guarantee of future results. Readers should conduct their own independent research or consult with a licensed professional before making any investment decisions. Any actions taken based on the content of this report are at the sole discretion and risk of the reader, and the author assumes no liability for any potential losses or damages.