S&P 500: Comprehensive Review and Outlook
Comprehensive analysis of domestic drivers, global factors, sentiment, and technicals reveals a bullish S&P 500 outlook for early 2026. Despite extreme investor optimism, strong fundamentals and supportive technicals suggest the path remains higher.
✅ Last Reviewed: | 📝 Last Updated: | 📋 Full History →
S&P 500 at a Glance
Fiscal stimulus and AI capex drive earnings growth
🌎 GLOBAL FACTORSDollar weakness supports valuations despite fiat currency concerns
🧠 SENTIMENT & POSITIONINGHyper-bull extremes, minimal hedging, record optimism
📈 TECHNICAL STRUCTUREConsolidation within durable uptrend, not distribution
🎯 FINAL VERDICTStrategic (medium/long term)
Fundamentals, technicals, and currency dynamics support continued gains. Path of least resistance: higher.
Tactical (near term)
Extreme positioning and potential dollar rally toward 104-106 create headwinds for increased volatility over next 2-3 months.
〰️ Forces Shaping the S&P 500
The S&P 500's trajectory in 2026 will be shaped by several key forces operating within the current market regime. While strong earnings expectations and supportive fiscal policy provide tailwinds, elevated valuations leave little room for disappointment. More critically, emerging signs of monetary system stress—from unsustainable deficits to the flight toward hard assets—may not be fully reflected in current prices.
| Component | Current Assessment |
|---|---|
| FISCAL STIMULUS |
Fiscal-backed growth outlook supports rich multiples
|
| AI INVESTMENT |
AI capex surge driving structural transformation
|
| SUPPORTIVE MONETARY POLICY |
Markets are pricing modest rate cuts in 2026
|
| STRONG EARNINGS EXPECTED |
Analysts expect strong earnings growth in 2026
|
| THE FIAT UNRAVELING |
Emerging signs of monetary regime breakdown
|
🧠 Sentiment & Positioning
In late-cycle regimes, sentiment and positioning dynamics reveal whether market participants are leaning into risk with conviction or maintaining defensive hedges despite upward price action. For the S&P 500, the current picture shows elevated exposure with balanced sentiment. However, this relative stability is tempered by persistent demand for downside protection. This configuration supports continued upside until volatility or macro shocks force repositioning.
| Component | Current Assessment |
|---|---|
| Bank of America Global Fund Manager Survey Jan 2026 |
Investors at a “hyper-bull” extreme, with very low recession fears and aggressive pro‑risk positioning
Macro Outlook
Inflation and policy views
Sentiment and risk appetite
Positioning and asset allocation
Hedging and style preferences
|
| DAILY NEWS SENTIMENT INDEX (DNSI) |
DNSI readings better than historical average
|
📈 Technical Structure
Technical structure provides critical insight into whether the S&P 500 is consolidating within a durable trend or showing early signs of reversal. The following analysis examines monthly and weekly charts to distinguish between trend stability and trend breakdown.
| Technical Factor | Current Status | Structural Signal |
|---|---|---|
| RISING CHANNEL | Rising channel since 2009; price near upper quartile |
Intact but extended
April 2025 test validated January 2022 breakout + channel boundary as primary support. Current positioning near upper quartile suggests limited upside room within channel—correction toward midline or lower boundary remains possible without invalidating structure. |
| BULLISH REVERSAL SIGNALS | Long shadows and piercing patterns at major lows (March 2020 and April 2025) |
Supportive
Major lows show aggressive buying at structural support, with large real bodies and rapid reversals demonstrating institutional conviction. |
| BEARISH REVERSAL SIGNALS | No meaningful bearish candlestick patterns at peaks |
Supportive
Major peaks lack evening stars, bearish engulfing, or exhaustion patterns. Double tops reflect gradual rotation rather than structural reversal. |
| MOMENTUM DETERIORATION | No consecutive bearish monthly closes or expanding selling pressure below support |
Supportive
Channel failures require momentum breakdown. Current structure shows consolidation, not distribution. |
Monthly Chart
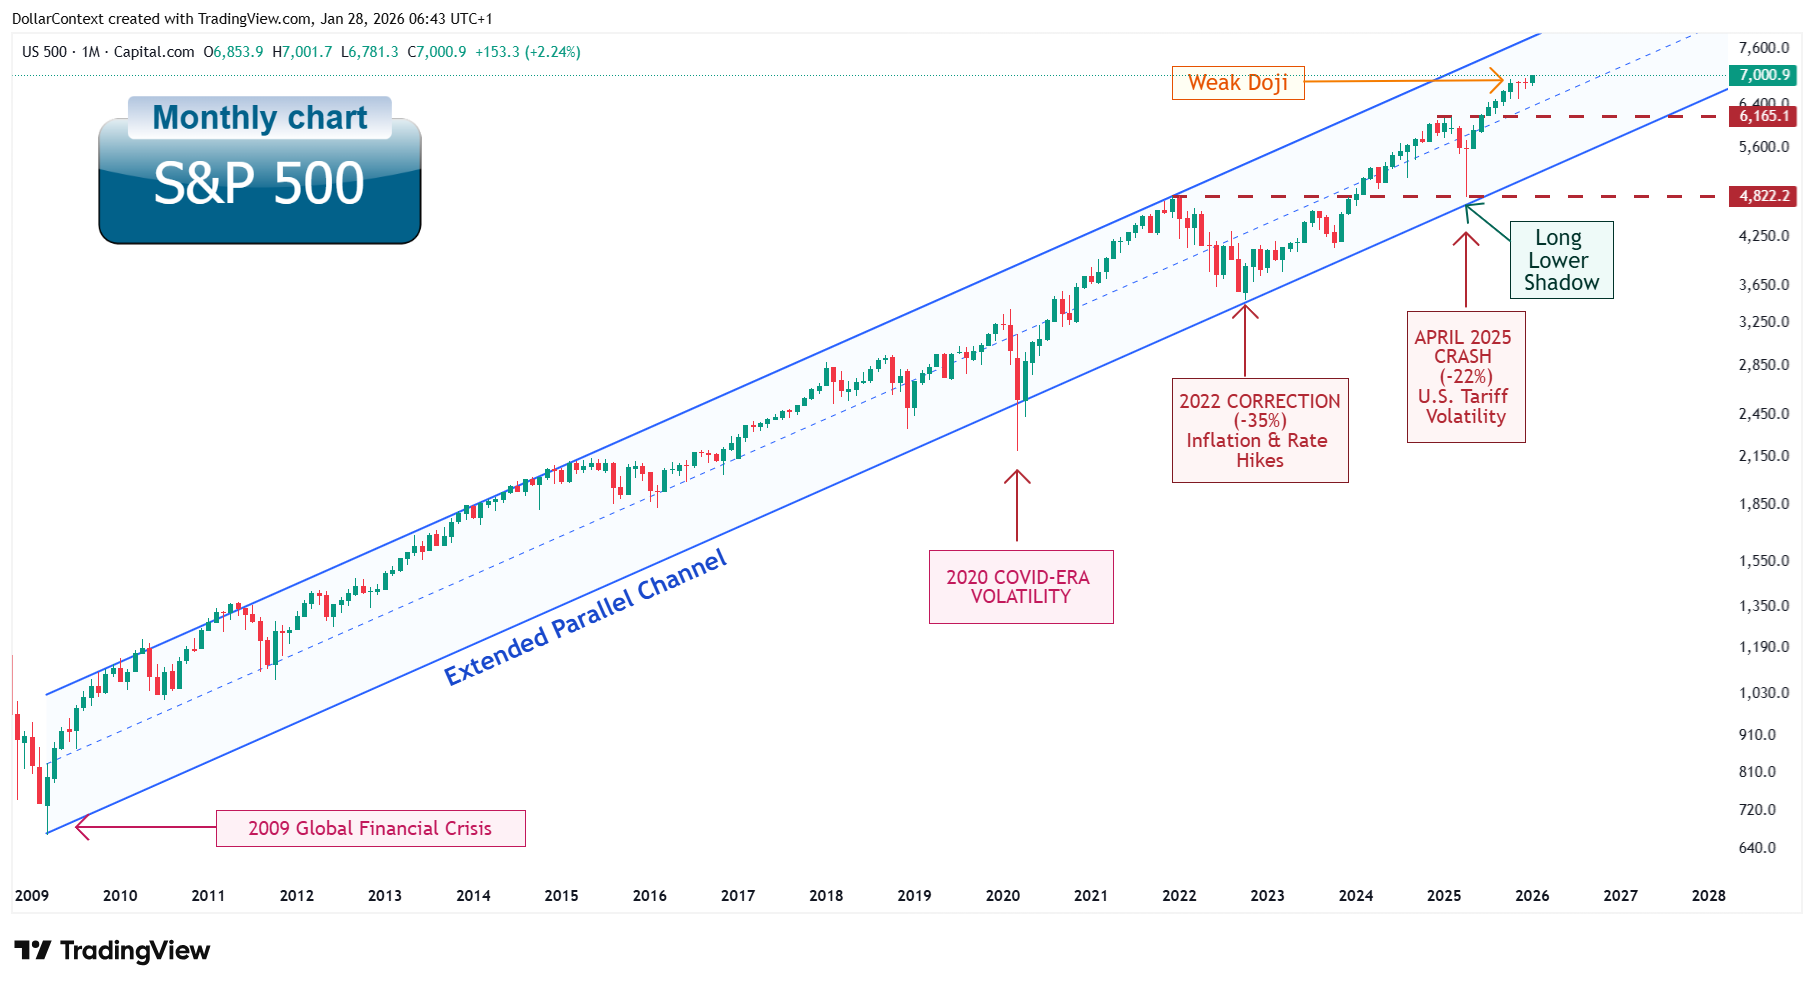
Rising parallel channel since 2009
On a monthly logarithmic chart, the S&P 500 has traded within a rising parallel channel since 2009, defining the boundaries of the secular bull market. The upper boundary connects major bull market peaks, while the lower boundary has been validated by crisis lows in March 2009 and March 2020, as well as policy-driven drawdowns in September 2022 and April 2025. The channel's midline has repeatedly acted as a mean-reversion anchor during corrective phases since 2020, confirming its structural significance.
The April 2025 drawdown rigorously tested this framework, finding support precisely at the confluence of the January 2022 breakout peak and the channel's lower boundary. Price has since recovered to consolidate near the upper quartile of the channel range measured from the lower boundary.
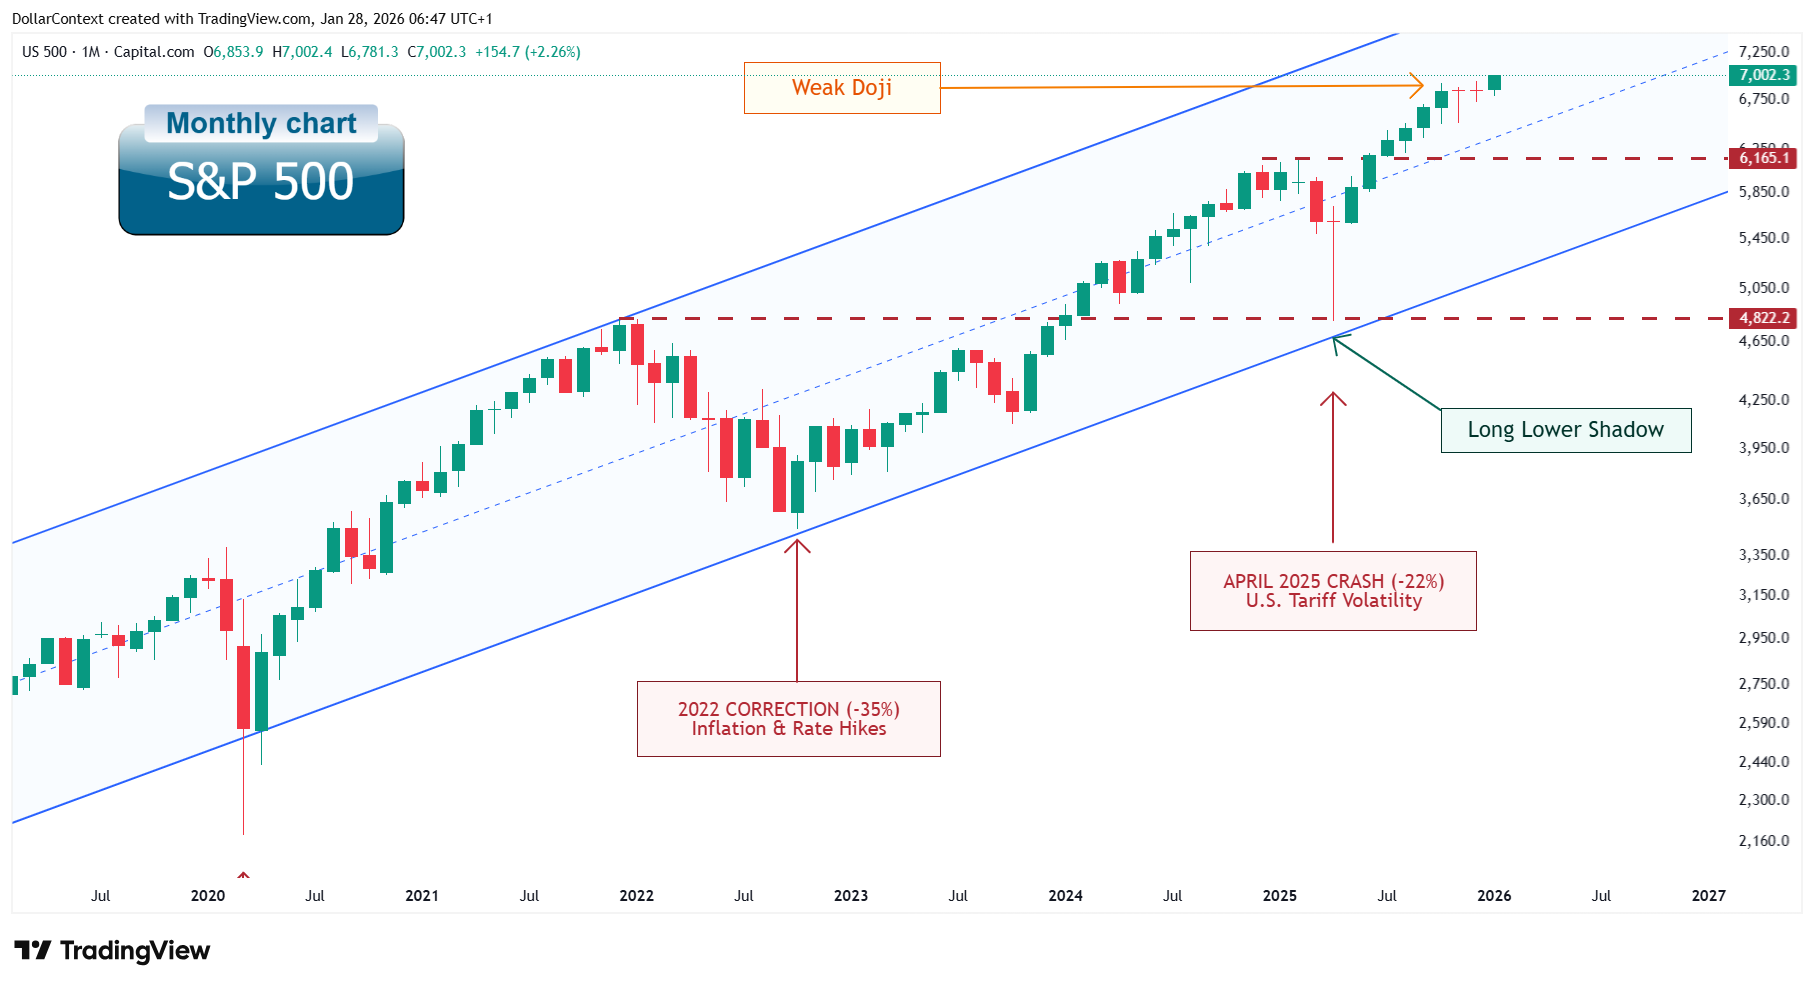
Candlestick behavior reveals aggressive buying at support
Candlestick formations at key inflection points reveal how participants have responded to structural levels. The April 2025 monthly candle formed a long lower shadow—a pattern that emerges when aggressive selling is met with equally aggressive buying, leaving intramonth panic unresolved in the final settlement. This formation validated both the technical support zone and the behavioral conviction of buyers at that confluence.
Doji candles at highs reflect consolidation
In contrast, the November and December 2025 candles took the form of dojis. However, dojis signal indecision or potential reversal primarily when they appear after extended impulsive advances, where they reflect exhaustion of buying momentum. Here, the dojis emerged after moderate candles following a retracement. In this context, such formations more often reflect consolidation than exhaustion. The pattern's ambiguity aligns with the broader late-cycle environment, where neither bulls nor bears have established decisive control.
Weekly Chart
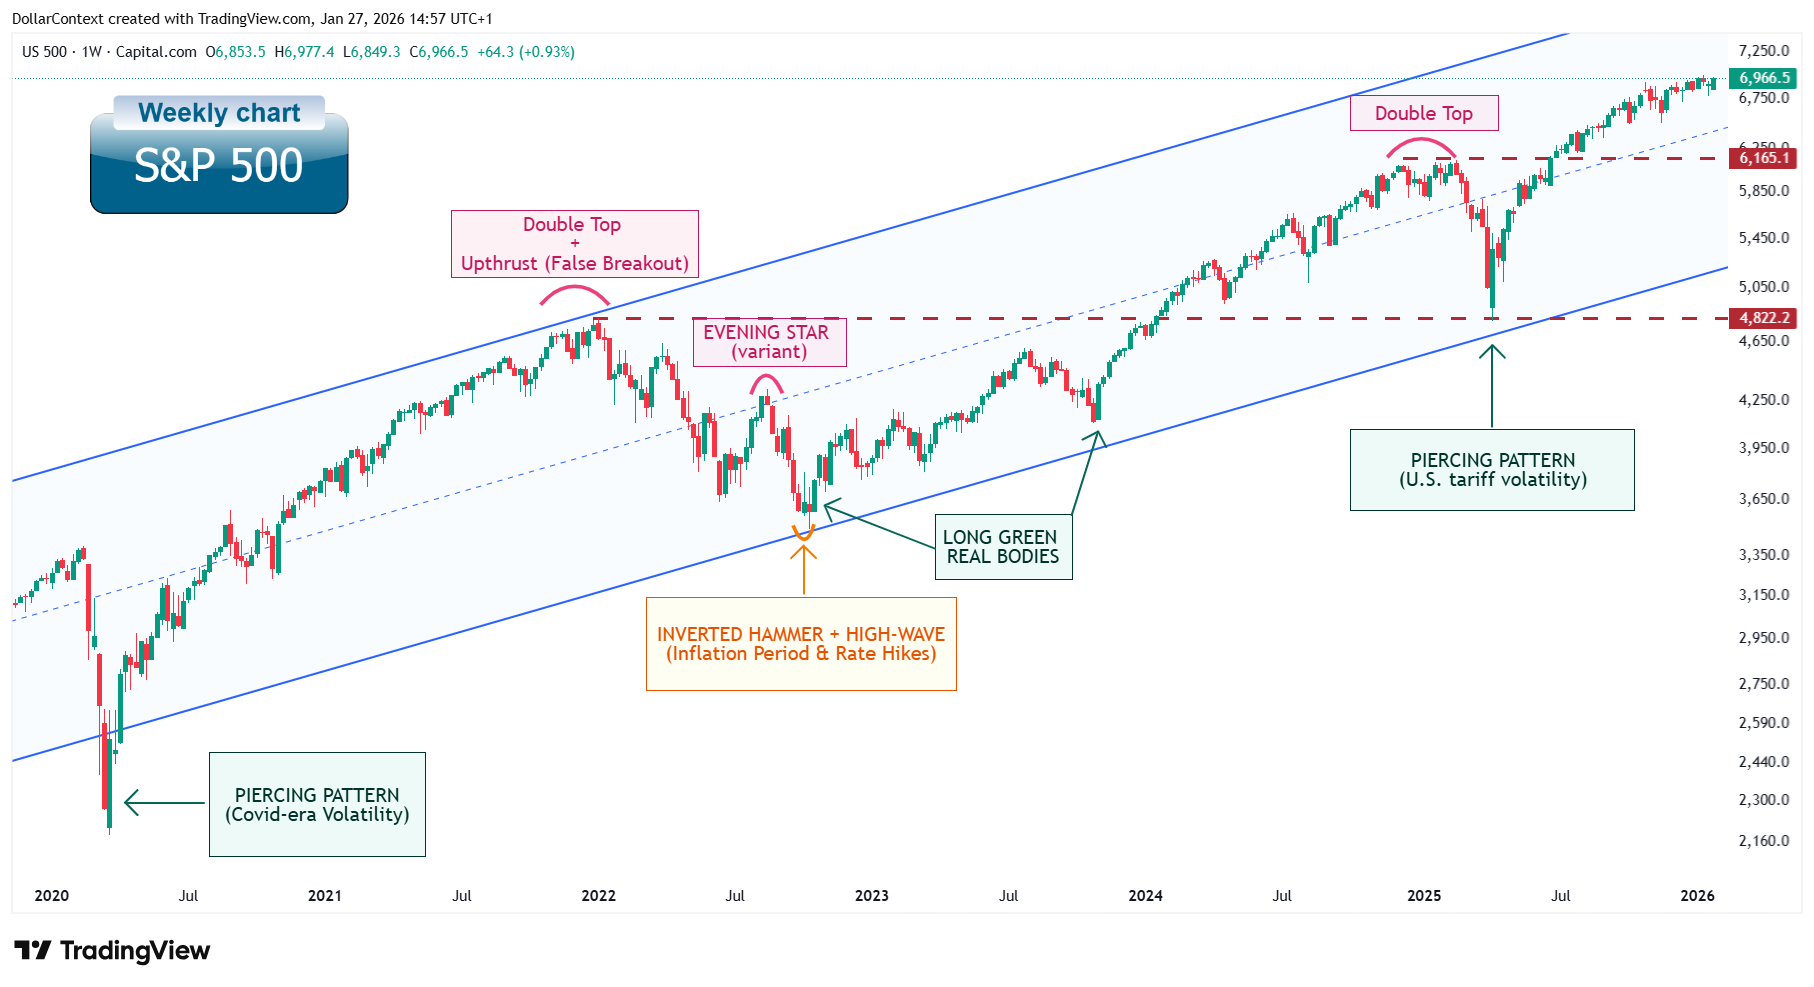
Weekly timeframe confirming support at channel boundaries and former resistance
The weekly timeframe refines the monthly view, revealing how intermediate corrections have been contained. Price action has repeatedly found support near the channel's lower boundary, with two levels emerging as particularly significant: the 4,822 zone (former resistance now acting as medium-term support) and the 6,165 level (former consolidation ceiling now functioning as structural support following the upside break). These levels have defined acceptance zones during corrections rather than marking points of trend failure.
Pattern asymmetry: explicit bullish signals at lows, rotation without panic at highs
Pattern behavior at peaks and troughs clarifies the character of this market. Two of the three major historical peaks on the weekly chart formed double-top structures, indicating that distribution at significant highs has tended to be gradual rather than climactic. Only the August 2022 minor peak displayed bearish candlestick confirmation—a variant of the evening star pattern. Other highs lacked decisive reversal signals.
At major correction lows, the evidence is more explicit. The March 2020 and April 2025 lows both formed through piercing patterns featuring unusually large real bodies, reflecting aggressive dip-buying that rapidly reversed downside momentum. The October 2022 low displayed a more nuanced confluence—an inverted hammer followed by a high-wave candle with strong bullish follow-through at cycle lows.
Conclusion
This asymmetry—explicit reversal signals at lows, ambiguous or absent signals at highs—reveals how participants have behaved: buyers step in decisively at structural support, while sellers at peaks take profits gradually rather than panic.
Key Technical Levels
Primary support: January 2022 breakout zone reinforced by channel boundary
The primary structural support zone lies at the January 2022 breakout area, reinforced by the lower boundary of the long-term rising channel. This confluence absorbed major stress during the April 2025 drawdown, where aggressive buying emerged precisely at this level and reversed a ~20% decline within weeks. The speed and decisiveness of that reversal demonstrated that this support represents a price level where institutional capital views risk/reward as compelling.
Intermediate support: channel midline as mean-reversion anchor
The intermediate trend support is defined by the channel midline on both monthly and weekly timeframes, which has repeatedly acted as a mean-reversion anchor during corrective phases. This level represents the equilibrium point within the secular channel—neither overextended nor oversold relative to the long-term trend trajectory. Corrections that reach this midline without breaking below it have historically resolved through renewed upside rather than accelerated decline.
Invalidation threshold: sustained monthly close below channel support
The structural invalidation zone would be marked by a sustained break below the long-term channel support on a monthly closing basis—specifically, two or more consecutive monthly closes below this level—particularly if accompanied by expanding bearish real bodies. Such a breakdown would indicate not merely a correction within the trend, but a fundamental shift in market structure where former support becomes new resistance. Importantly, intramonth volatility or single-week breakdowns do not constitute invalidation—what matters is monthly settlement behavior, which reflects institutional positioning rather than short-term noise.
How to distinguish consolidation from distribution
Channel failures typically occur through momentum deterioration—consecutive bearish real bodies, expanding selling pressure, or breakdowns below former support on monthly closing bases. In contrast, consolidation within a durable uptrend is characterized by support holding at structural levels, corrections being met with aggressive buying, and rallies stalling through rotation rather than panic selling. The double-top formations at major peaks exemplify this distinction: they reflect gradual profit-taking distributed over time rather than climactic reversal events. None of these levels should be viewed as mechanical signals; instead, they provide a framework for interpreting whether volatility reflects healthy digestion or structural breakdown.
Technical Bottom Line for the S&P 500
Current structure consistent with consolidation, not distribution
The weight of evidence across multiple timeframes points to consolidation within a durable uptrend rather than distribution preceding a major reversal. Monthly and weekly charts show price contained within the secular rising channel, supported by historically significant levels. Corrections have been met with aggressive buying at structural support zones—evidenced by piercing patterns and long lower shadows at key lows. Rallies have stalled through gradual rotation and profit-taking rather than panic selling—evidenced by the absence of decisive bearish candlestick patterns at major peaks and the prevalence of double-top structures that reflect distribution over time rather than climactic reversals.
🎯 Final Verdict
Our comprehensive analysis across four key dimensions—domestic drivers, global factors, sentiment and positioning, and technical structure—points to a bullish outlook for the S&P 500, though near-term dynamics introduce potential for increased volatility.
Medium/Long-Term Outlook
Fundamental tailwinds remain robust. Fiscal stimulus, expanding AI investment across multiple sectors, and accommodative monetary policy create a powerful foundation for earnings growth and market strength throughout 2026. These domestic drivers represent tangible, structural forces rather than speculative momentum.
Global currency dynamics add complexity. While large fiscal deficits and central banks' pivot toward hard assets (evidenced by gold's historic rally) signal long-term concerns about fiat currency stability, the near-term effect of dollar weakness paradoxically supports higher U.S. equity valuations in nominal terms. This creates an unusual dynamic where currency distrust may actually fuel further stock market gains.
Technical evidence supports continuation. Across multiple timeframes, the weight of technical evidence suggests ongoing consolidation within a durable uptrend rather than distribution patterns that typically precede major reversals. This reinforces the view that any medium-term weakness likely represents healthy pullbacks within an intact bull market.
Near-Term Tactical View
Updated: February 5, 2026
Extreme optimism warrants heightened caution. The analysis reveals investors positioned at "hyper-bull" extremes with record-low cash levels, aggressive risk-taking, and minimal hedging. While such sentiment extremes can persist during sustained bull runs when supported by strong fundamentals, they amplify vulnerability to any negative catalysts.
Potential dollar strength could introduce headwinds. Recent technical signals (DXY hammer at ~96 confluence support), cross-asset developments (Bitcoin correlation breakdown, gold's violent reversal following Warsh nomination), and positioning dynamics suggest the dollar may rally toward 104-106 over the next 2-3 months. Dollar strength typically weighs on multinational earnings and risk sentiment, potentially creating near-term pressure on equity valuations despite strong fundamentals.
This tactical consideration doesn't invalidate the medium-term bull case—fundamentals and technical structure remain constructive. However, the combination of extreme positioning and potential dollar strength suggests increased volatility and possible consolidation or modest corrections over the next 2-3 months before the uptrend resumes. Key levels to monitor: sustained dollar strength above 102 would increase equity market pressure, while dollar breakdown below 95.5 would remove this headwind.
📝 Update History
- February 5, 2026: Added Near-Term Tactical View section addressing potential dollar rally headwinds and positioning extremes
- January 29, 2026: Initial publication
This analysis reflects market conditions and information available at the time of publication. It is provided for informational and educational purposes only and does not constitute financial, investment, or legal advice.
The financial markets are inherently volatile, and past performance is never a guarantee of future results. Readers should conduct their own independent research or consult with a licensed professional before making any investment decisions. Any actions taken based on the content of this report are at the sole discretion and risk of the reader, and the author assumes no liability for any potential losses or damages.