S&P 500 Performance After Yield Curve Inversions
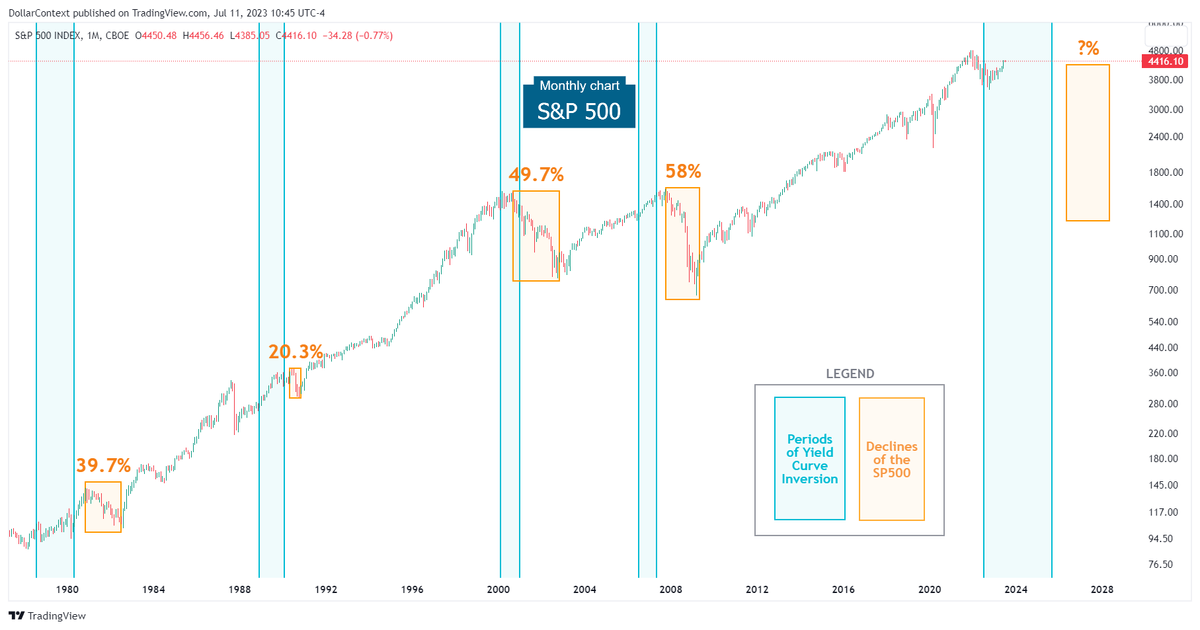
The SP500 typically experiences a decline within a range of 6 to 18 months after reaching the low point of the yield curve. The magnitude of these declines range approximately from 20% to 60%.
This article examines historical market behavior across multiple cycles to identify recurring patterns and structural tendencies. It is intended for educational and analytical purposes and does not reflect current market conditions.
The yield curve has been an accurate indicator to predict recessions. In addition, there has always been a strong correlation between recessions and S&P 500 downtrends. Not surprisingly, there should be a significant connection between yield curve inversions and stock market performance as well.
Today we’re going to discuss different timing strategies to buy or sell the S&P 500 when the bond market, specifically the 10-2 year treasury yield spread, displays an inversion.
Overview
We’ll examine the S&P 500's performance during the past five instances of yield curve inversion by presenting the following two charts for each period:
- S&P 500 chart where the periods of inversion are indicated by blue shaded areas while subsequent market downtrends are represented by orange shaded areas.
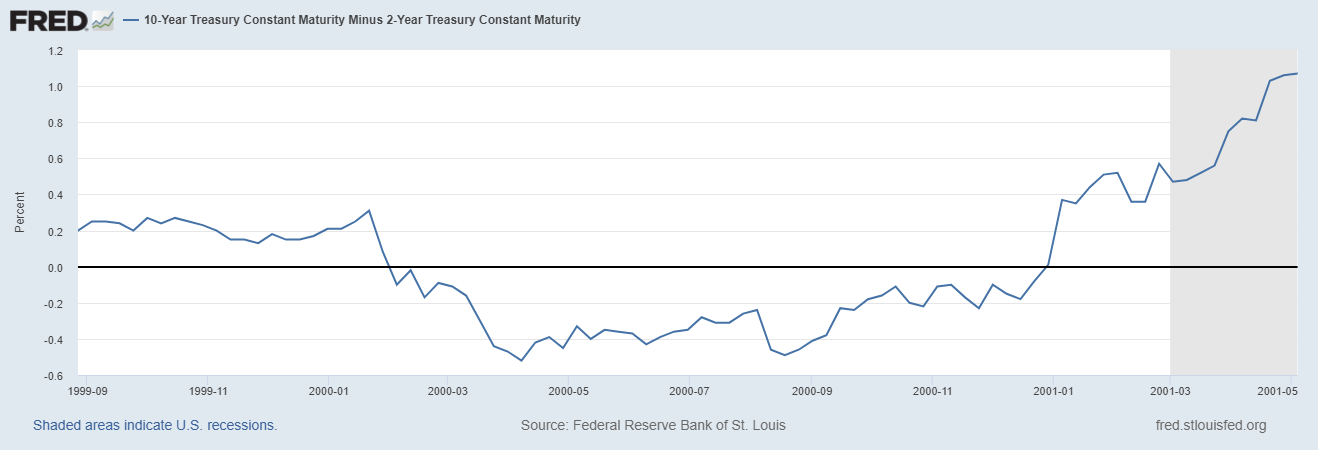
- 10-2 Year Treasury Yield Spread
CONCLUSION 1: Historically, the stock market has shown strong performance either during the first half or throughout the entire duration of a yield curve inversion.
CONCLUSION 2: The S&P 500 typically experiences a decline after a period spanning from 6 to 18 months from the lowest point of the yield curve. The magnitude of these declines ranges approximately from 20% to 60%.
August 1978–July 1982
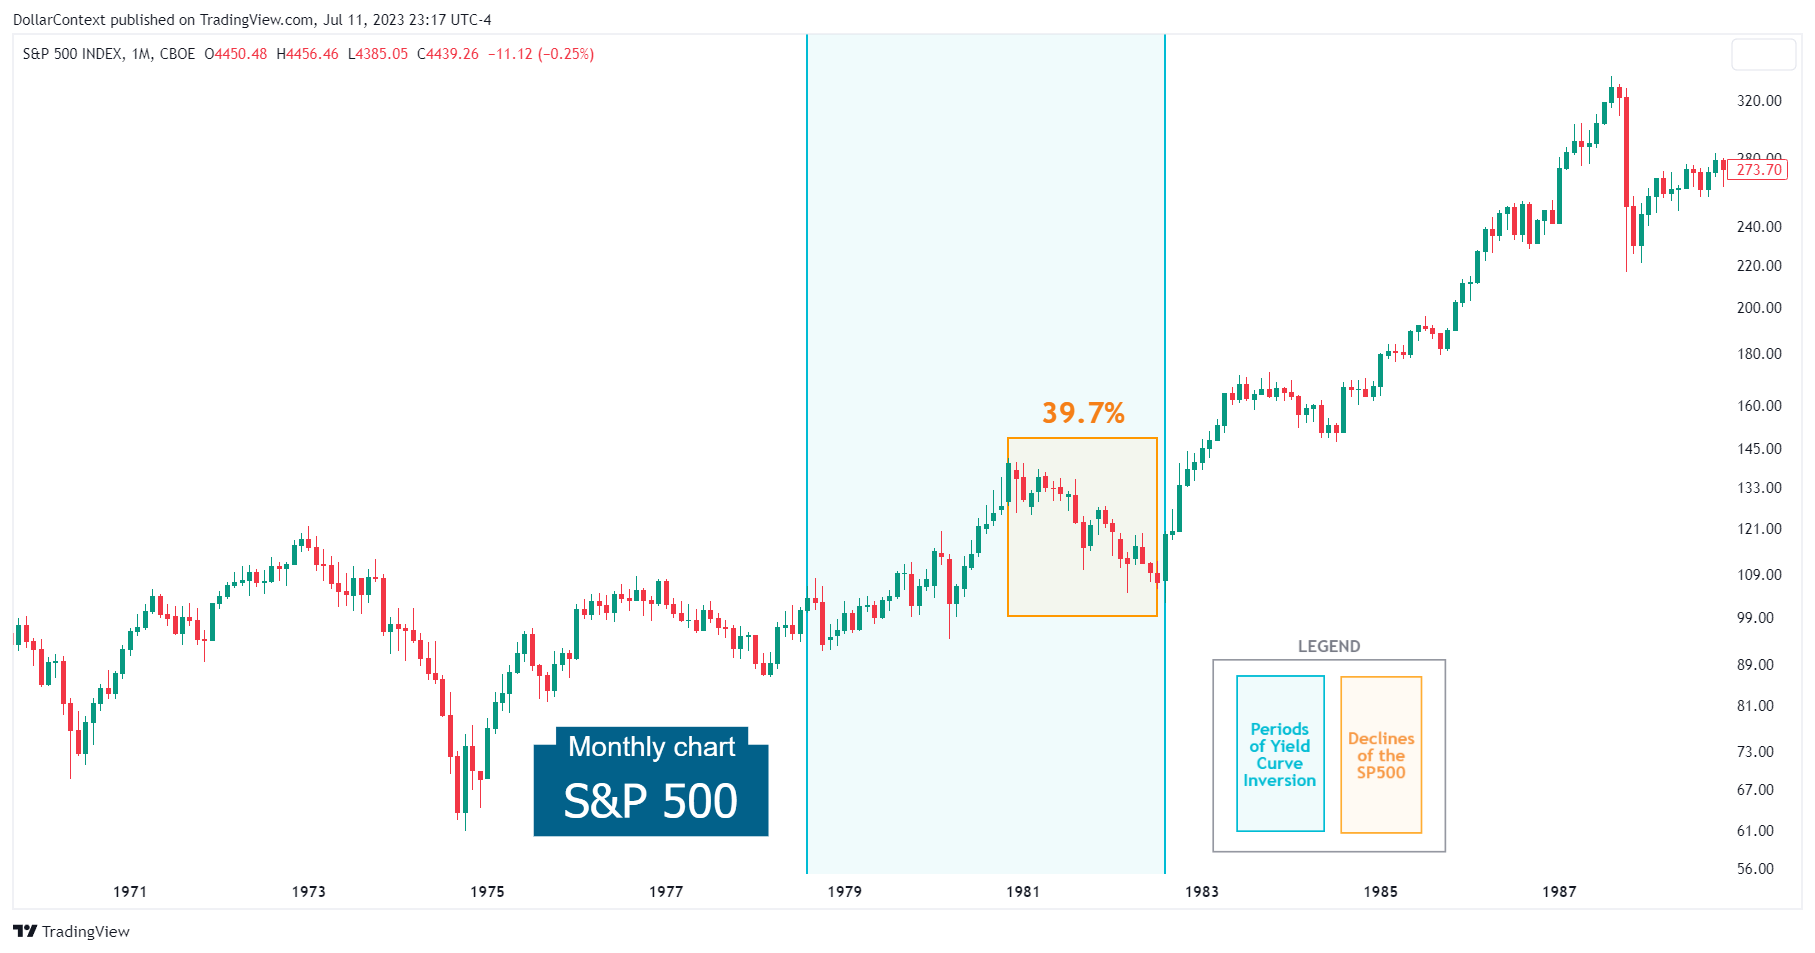
SUMMARY:
- The inversion begins in August 1978
- Yield curve bottomed in April 1980
- S&P 500 decline begins in November 1980
- Bottom of the inversion to the onset of the S&P 500 downtrend: 7 months
- S&P 500 decline: 39.7%
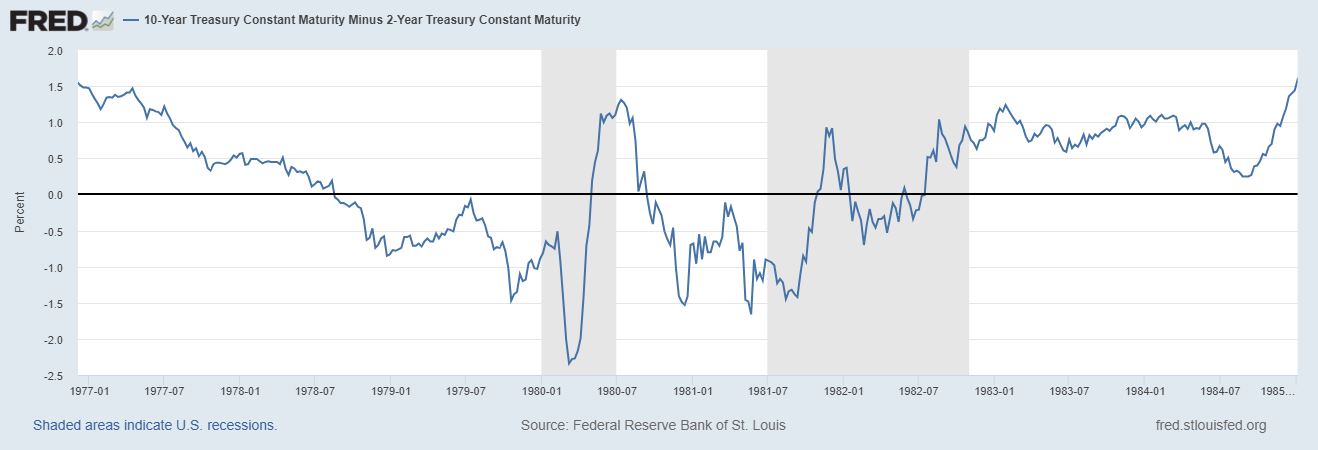
Source: Federal Reserve Bank of St. Louis
December 1988–October 1989
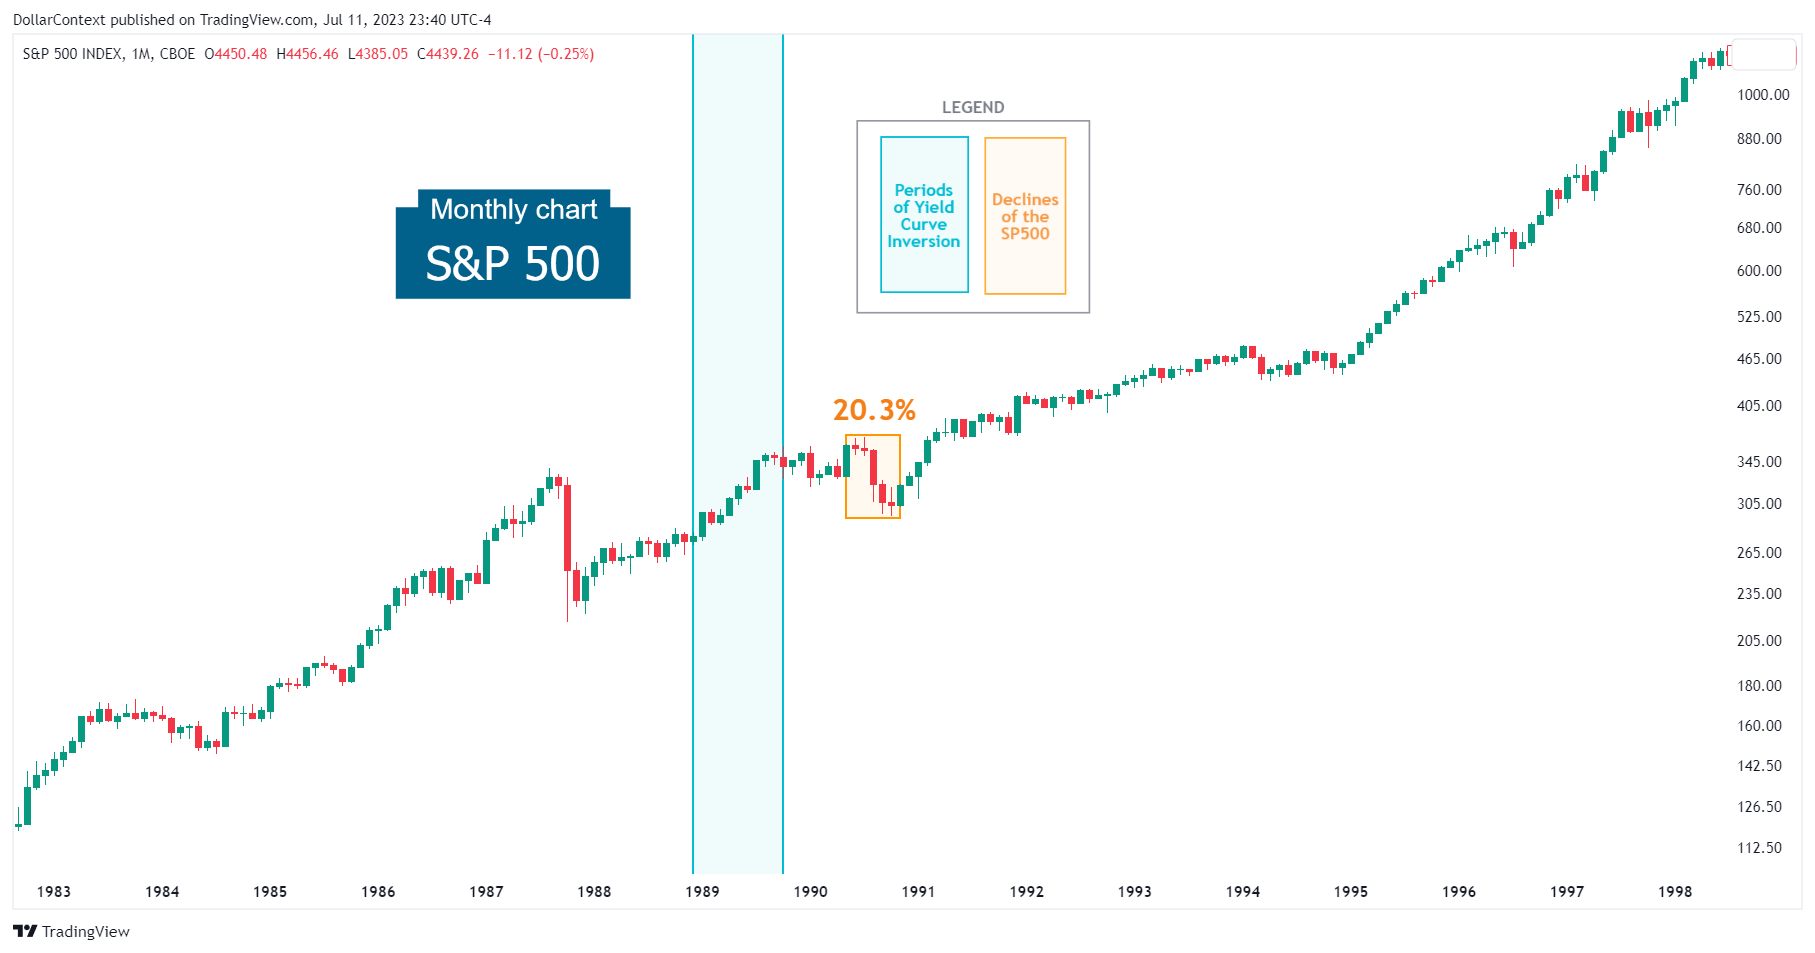
SUMMARY:
- The inversion begins in December 1988
- Yield curve bottomed in April 1989
- S&P 500 decline begins in May 1990
- Bottom of the inversion to the onset of the S&P 500 downtrend: 14 months
- S&P 500 decline: 20.3%
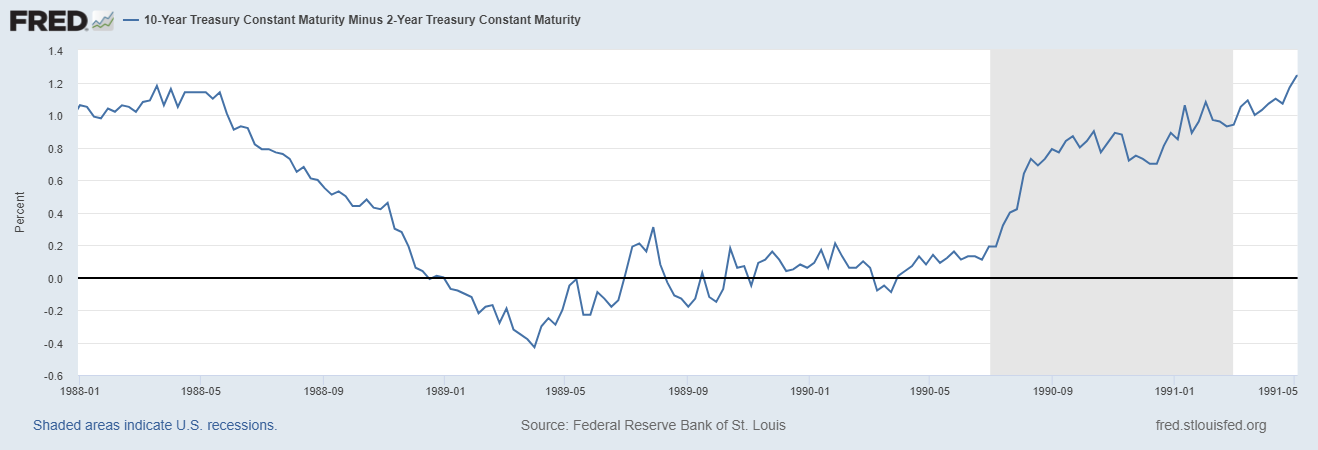
Source: Federal Reserve Bank of St. Louis
February 2000–December 2000
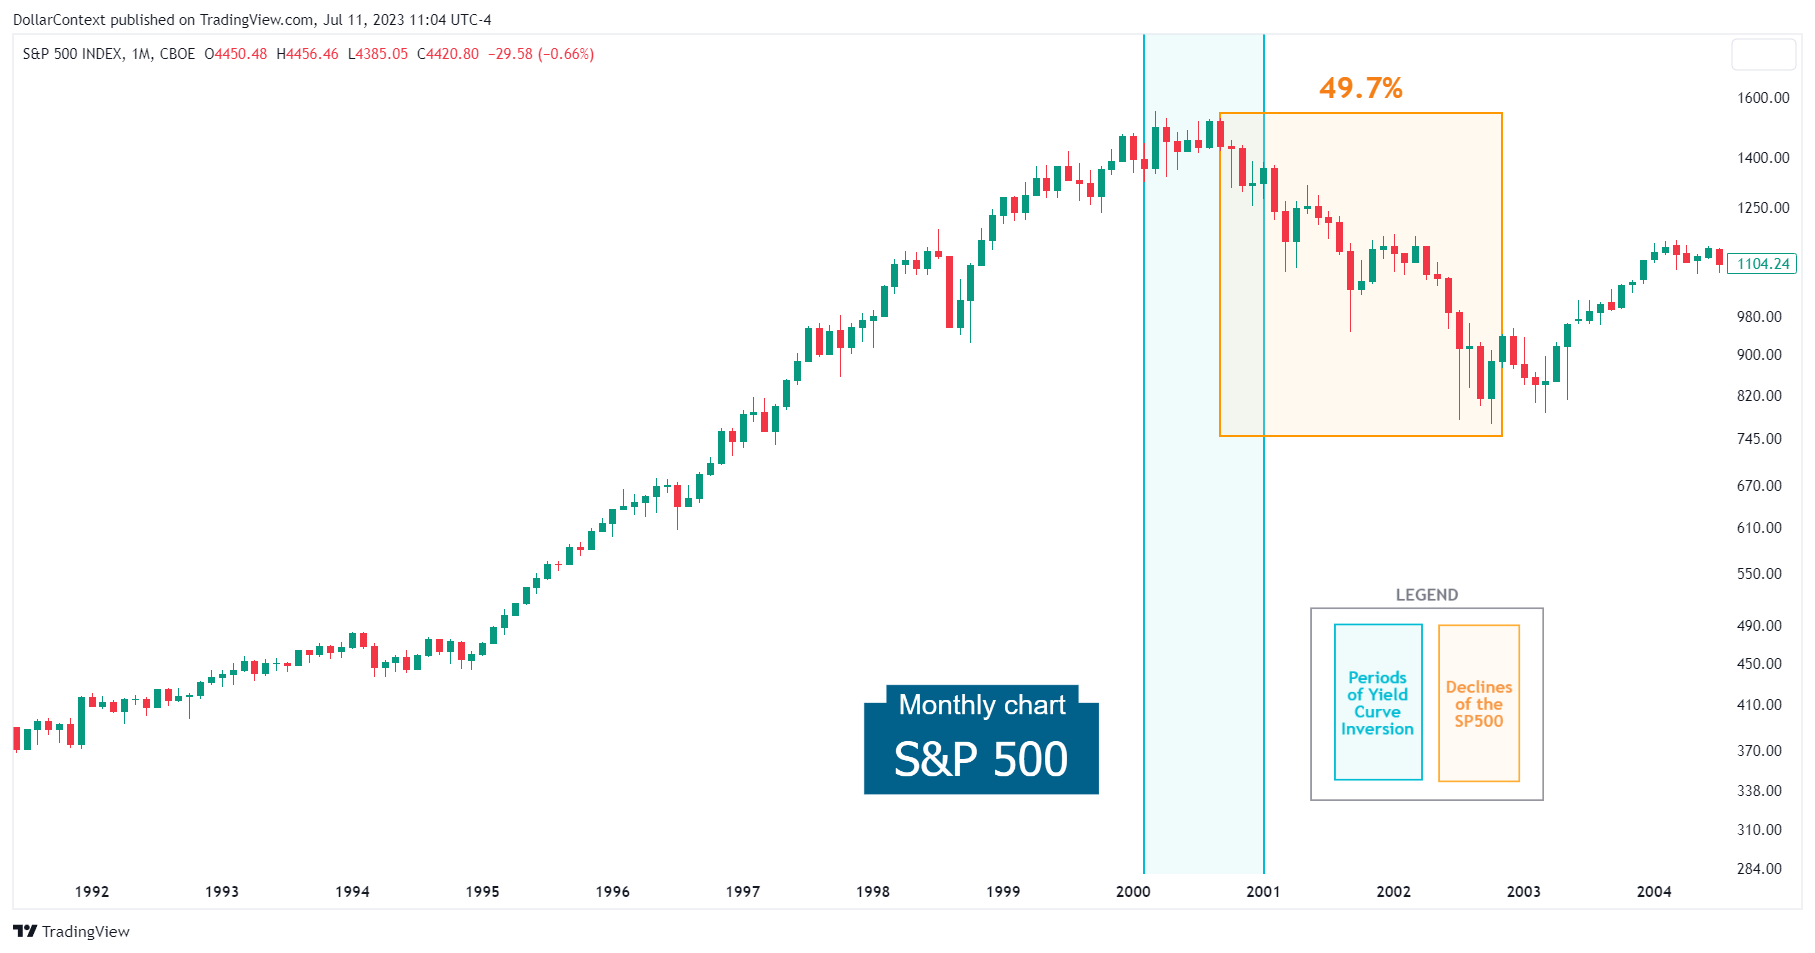
SUMMARY:
- The inversion begins in February 2000
- Yield curve bottomed in April 2000
- S&P 500 decline begins in September 2000
- Bottom of the inversion to the onset of the S&P 500 downtrend: 6 months
- S&P 500 decline: 49.7%
Source: Federal Reserve Bank of St. Louis
February 2006–April 2007
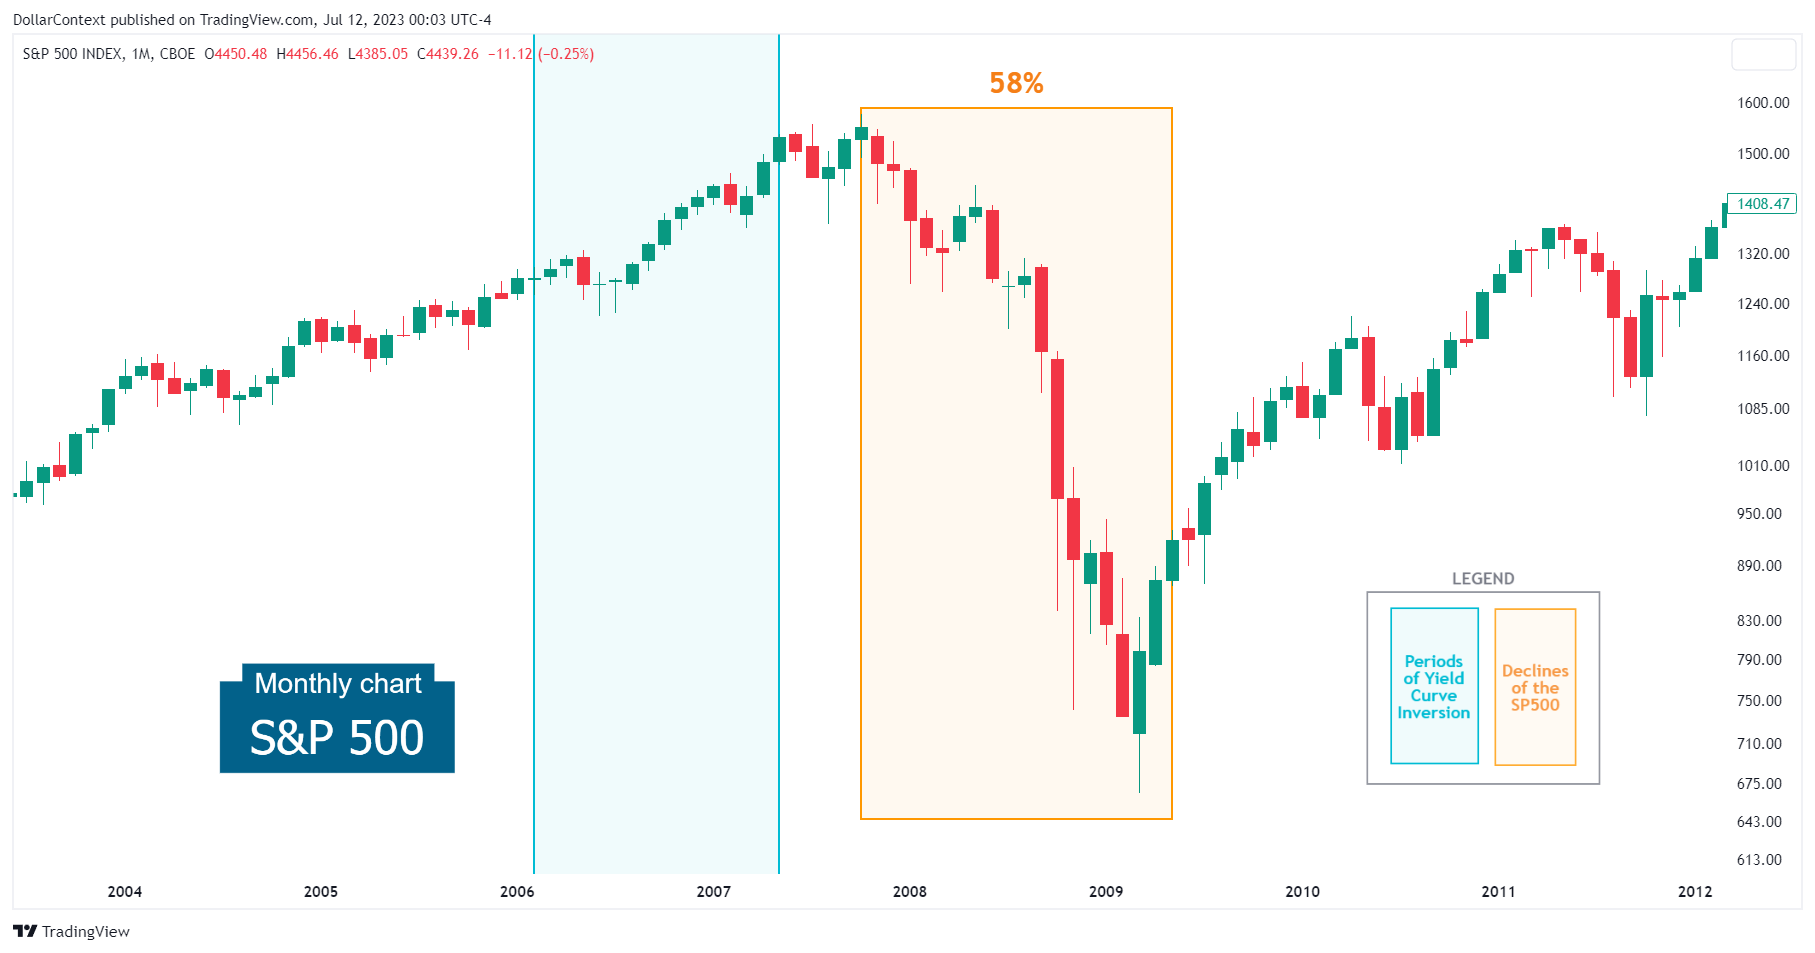
SUMMARY:
- The inversion begins in February 2006
- Yield curve bottomed in December 2006
- S&P 500 decline begins in October 2007
- Bottom of the inversion to the onset of the S&P 500 downtrend: 11 months
- S&P 500 decline: 58%
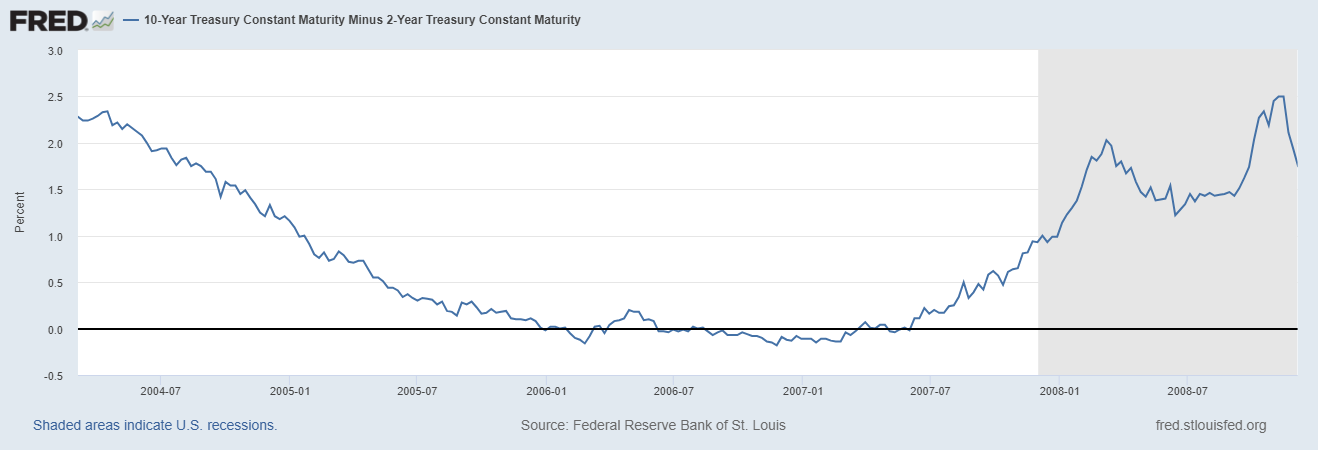
Source: Federal Reserve Bank of St. Louis