CANDLESTICK
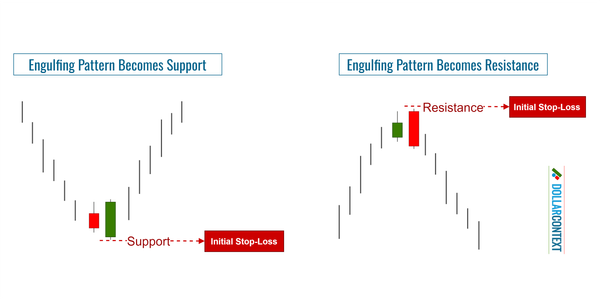
Engulfing Pattern to Identify Support or Resistance
After an uptrend, the price range associated with a bearish engulfing pattern becomes resistance. The same applies in reverse.
CANDLESTICK
After an uptrend, the price range associated with a bearish engulfing pattern becomes resistance. The same applies in reverse.
CANDLESTICK
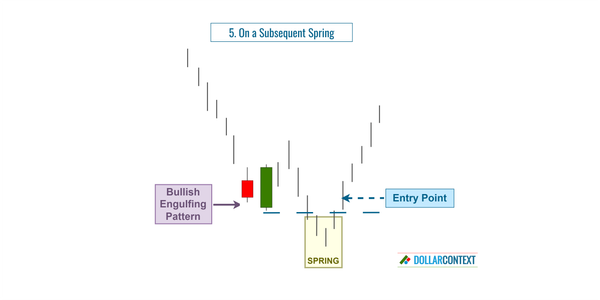
In this article, we discuss the different options for entry points after the appearance of an engulfing pattern.
CANDLESTICK
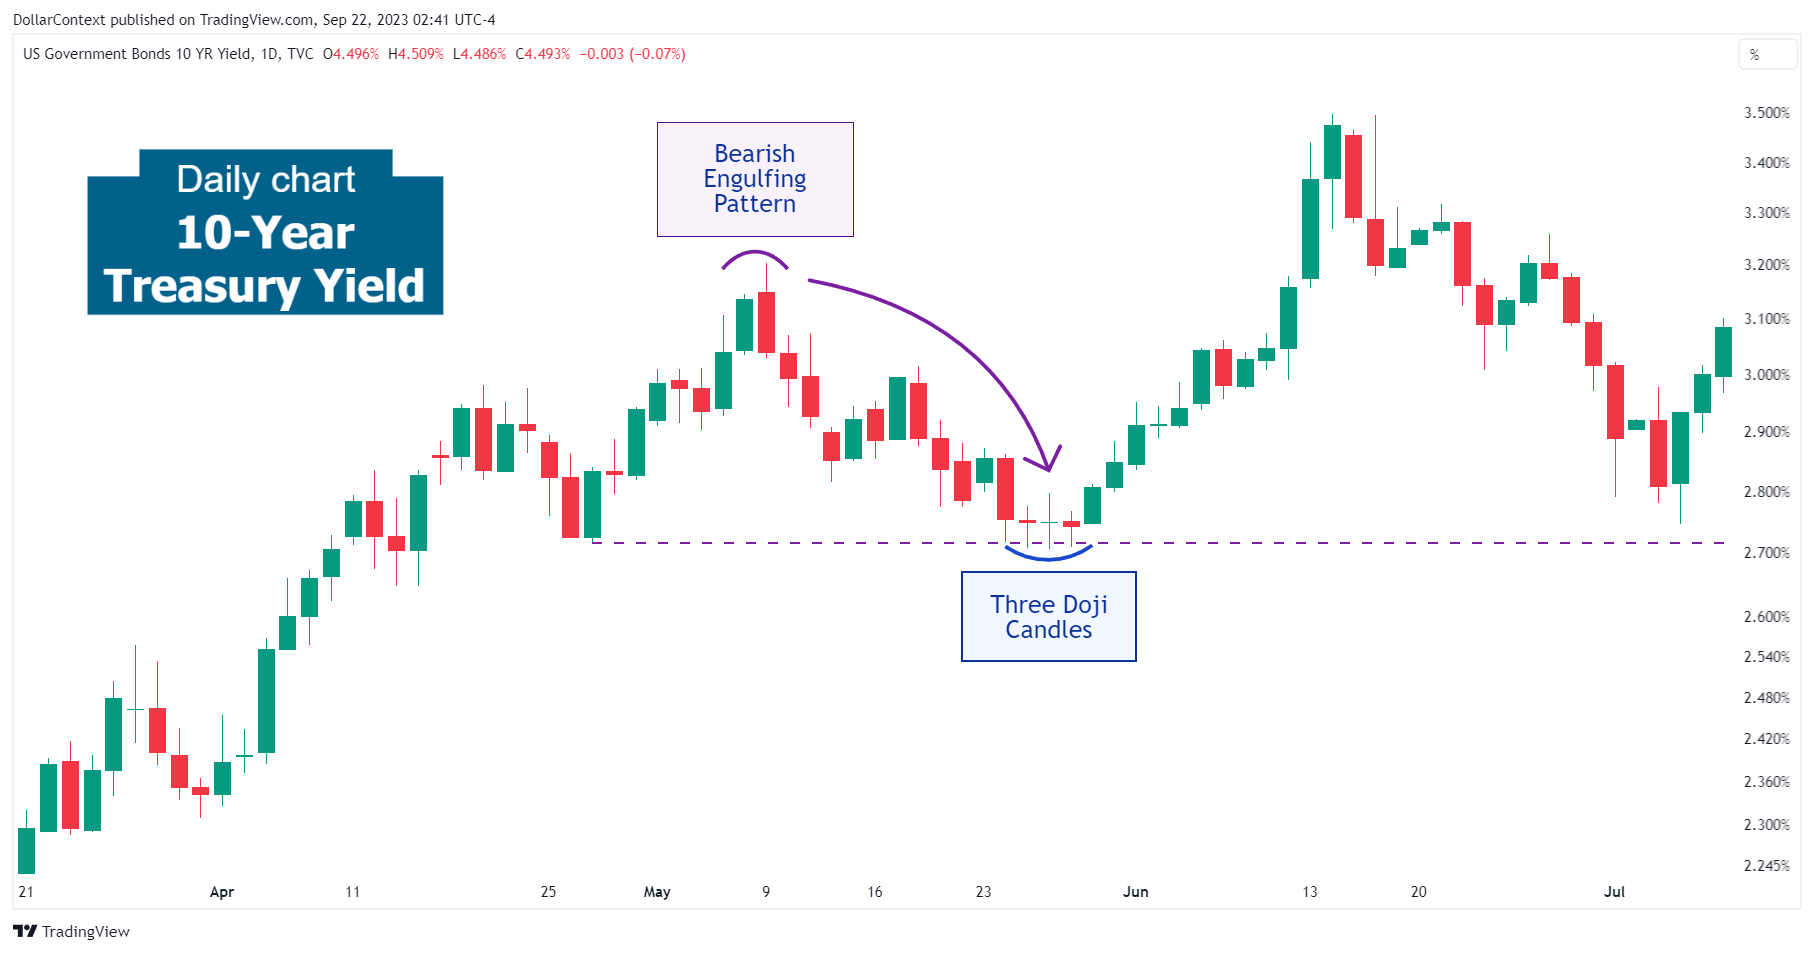
Following the appearance of the bearish engulfing pattern, there was a high likelihood of either a sideways trading range or a minor retracement.

CANDLESTICK
By understanding these psychological aspects, traders can better anticipate the potential market's response to an engulfing pattern and adjust their strategies accordingly.
CANDLESTICK
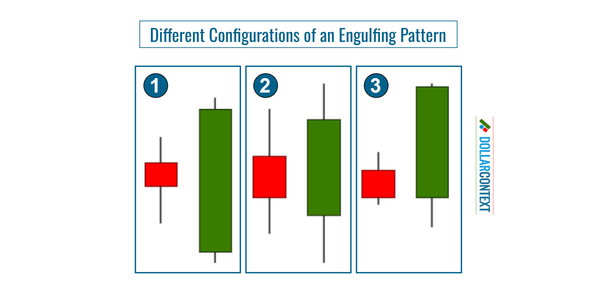
In this article, we'll explore the different shapes of an engulfing pattern and how to identify this candlestick indicator.
CANDLESTICK
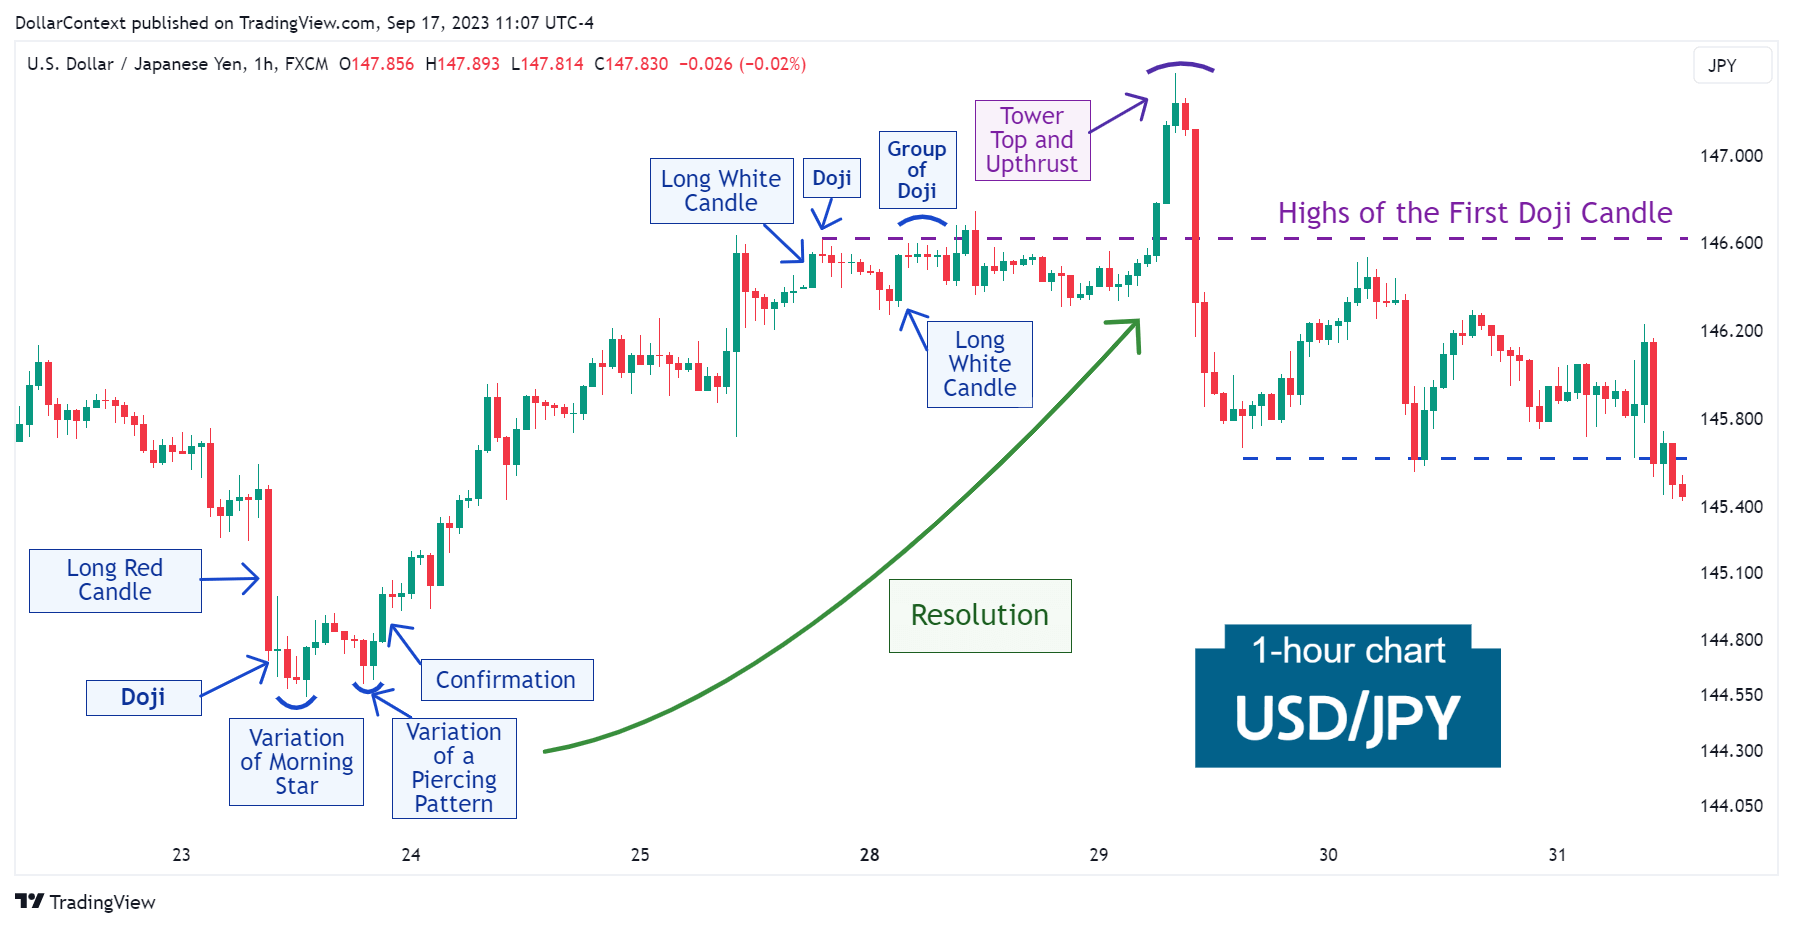
After an extended downtrend, the USD/JPY exhibited an exceptionally long red candle followed by a doji.
CANDLESTICK
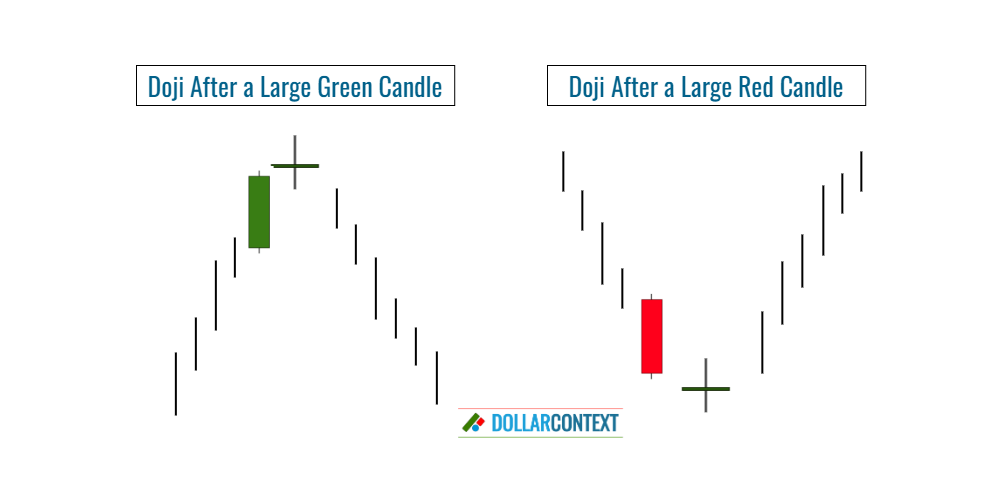
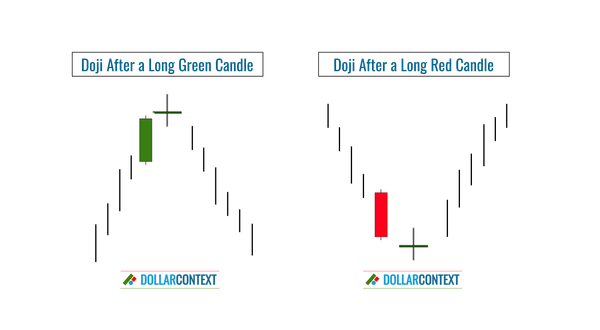
Today, we'll examine a crucial indicator of Japanese candlestick charting: the doji.
DOJI
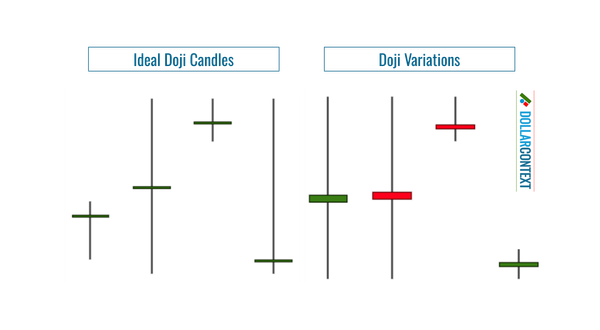
The configuration of a doji candle has resemblances to other candlestick patterns, including spinning tops, stars, and hammers.
DOJI
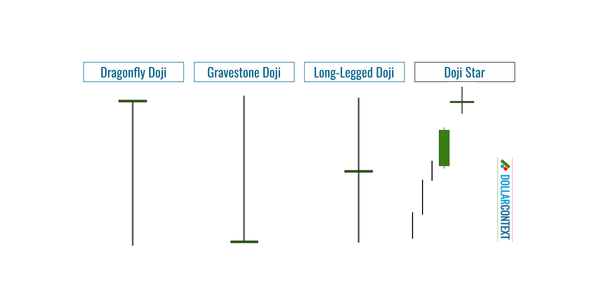
Five basic types of doji sessions are commonly identified: standard doji, dragonfly, gravestone, long-legged doji, and doji star.
DOJI
While doji candles can be a valuable tool in a trader's arsenal, it's crucial to understand their limitations and the criticisms surrounding them.
DOJI
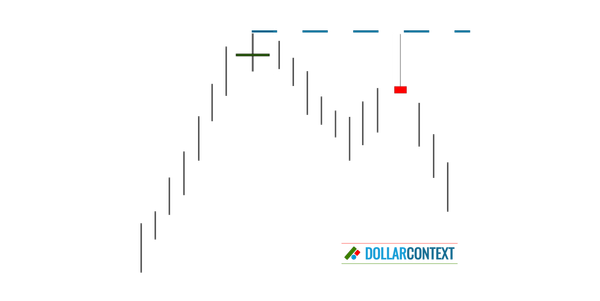
We discuss the implications of a doji candlestick in different market scenarios, including uptrends, downtrends, and trading ranges.
DOJI
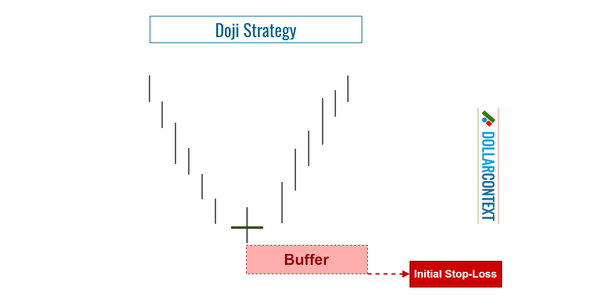
How can one determine if a near-doji session, where the opening and closing prices are similar but not the same, qualifies as a genuine doji?