DOJI
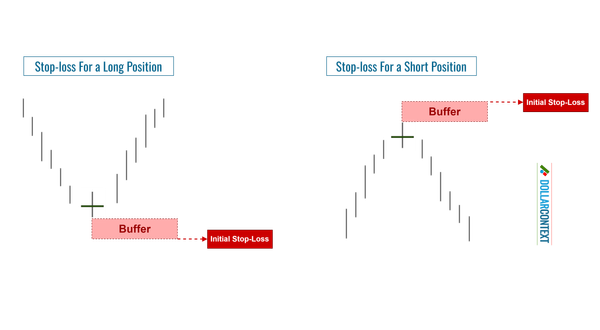
Doji Candlestick: How to Set Your Stop-Loss
In this post, we'll explore effective methods to set a stop-loss when leveraging a doji candle to initiate a market position.
DOJI
In this post, we'll explore effective methods to set a stop-loss when leveraging a doji candle to initiate a market position.
DOJI
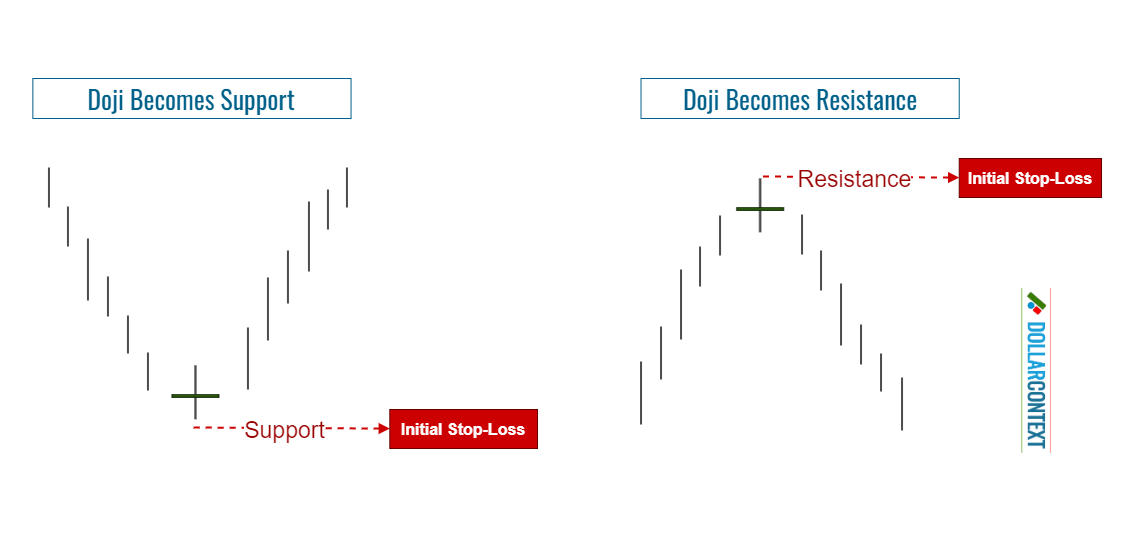
After an uptrend, the price range associated with a doji candle typically evolves into a resistance area. The same works in reverse.
DOJI
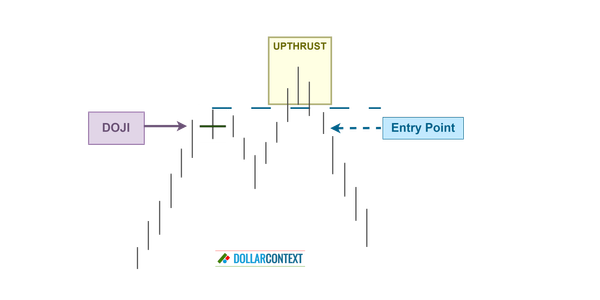
Here are different options for entry points after the appearance of a doji.

DOJI
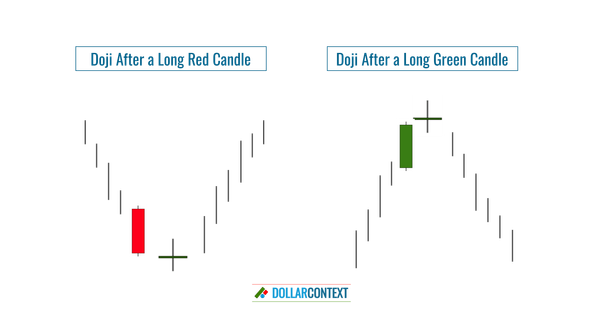
Today we examine the implications of a doji candle in market psychology.
DOJI
A doji is a candlestick where the opening and closing prices are the same. That is, a doji session displays a horizontal line instead of a real body.
CANDLESTICK
Today we're exploring an important indicator of Japanese candlestick charting: the piercing pattern.
CANDLESTICK
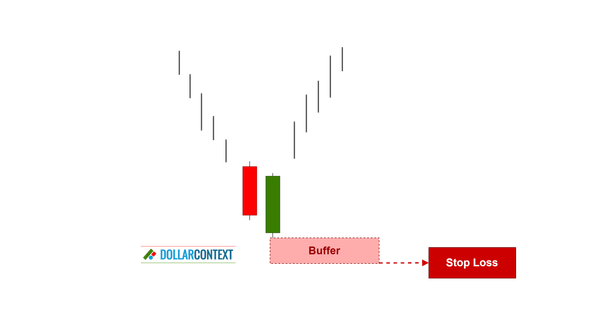
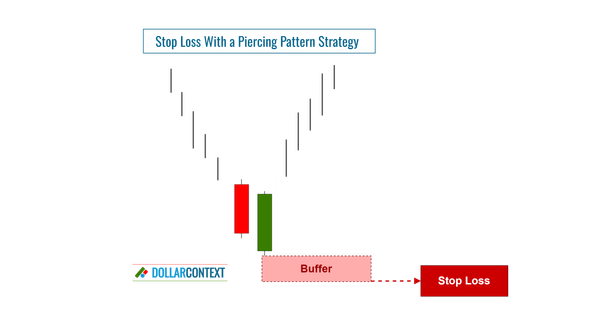
Set the stop-loss level below the low of the piercing pattern to protect you against potential downside risk.
CANDLESTICK
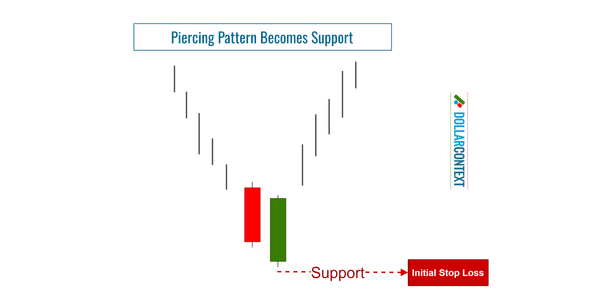
The price range associated with a piercing pattern frequently evolves into a support area.
CANDLESTICK
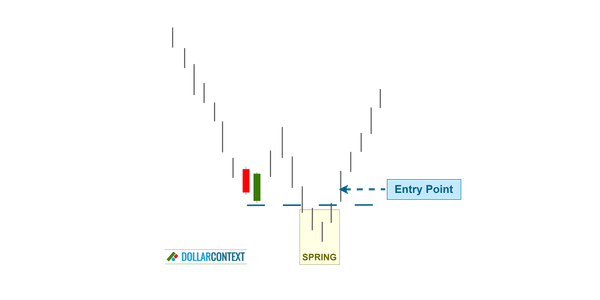
When a piercing pattern emerges, it signals a potential bullish reversal. Here are different options for entry points after this pattern.

CANDLESTICK
Understanding the psychology behind the piercing pattern requires dissecting its two-candle formation and the investor sentiment driving each candlestick.
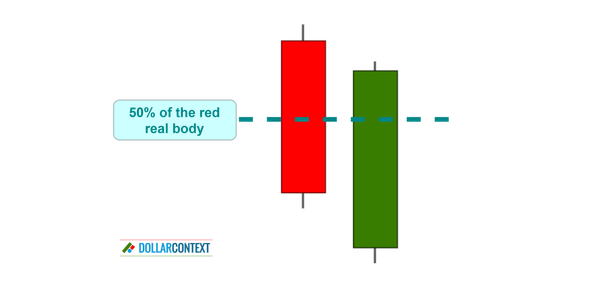
CANDLESTICK
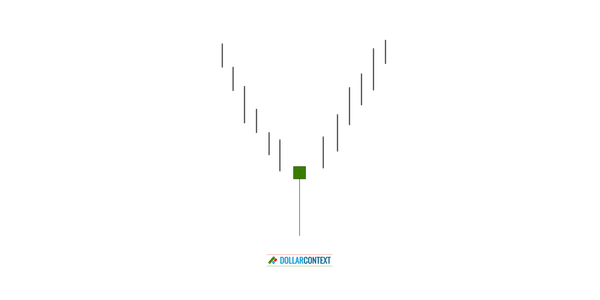
A piercing pattern is a two-candle combination that occurs at the end of a downtrend, signaling a potential bullish reversal.
HAMMER
Today, we're going to explore a crucial pattern in the realm of Japanese candlestick analysis: the hammer.