CANDLESTICK
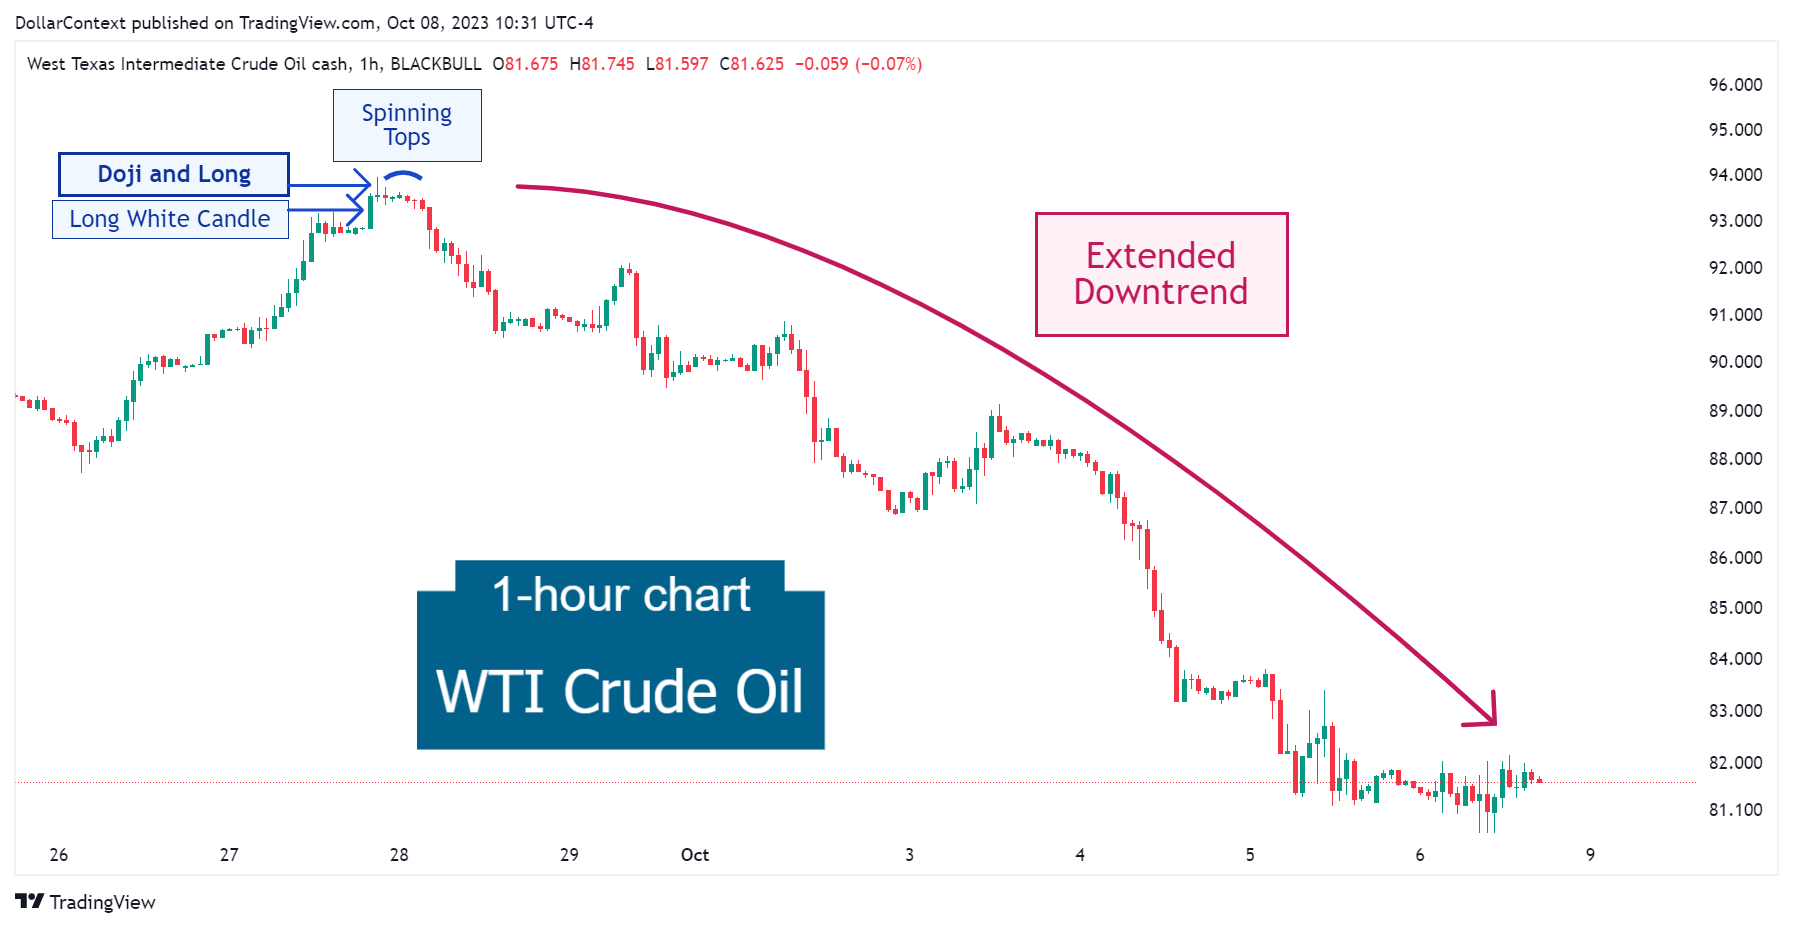
Case Study 0006: Doji After a Long White Candlestick (WTI)
In this article, we will examine the performance of the WTI market after the emergence of a doji pattern.
A series delving into numerous Japanese candlestick techniques illustrated with historical chart examples.
CANDLESTICK
In this article, we will examine the performance of the WTI market after the emergence of a doji pattern.
CANDLESTICK
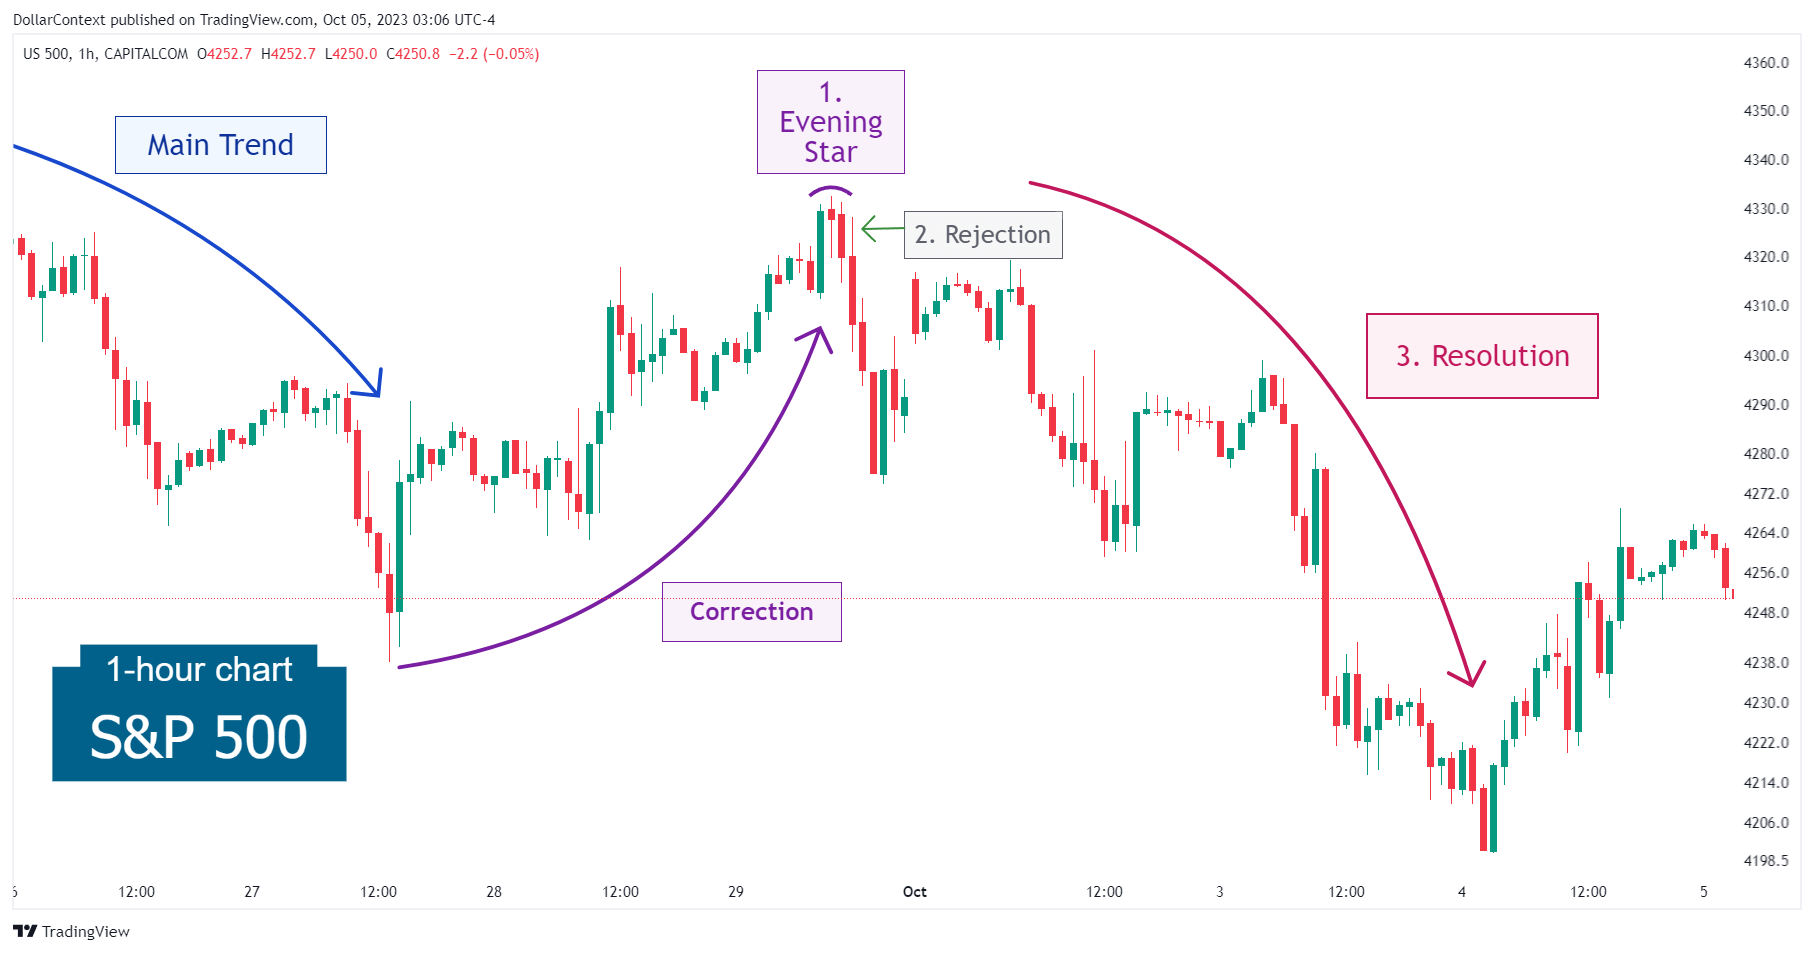
In this article, we will discuss the performance of the S&P 500 after the appearance of an evening star.
CANDLESTICK
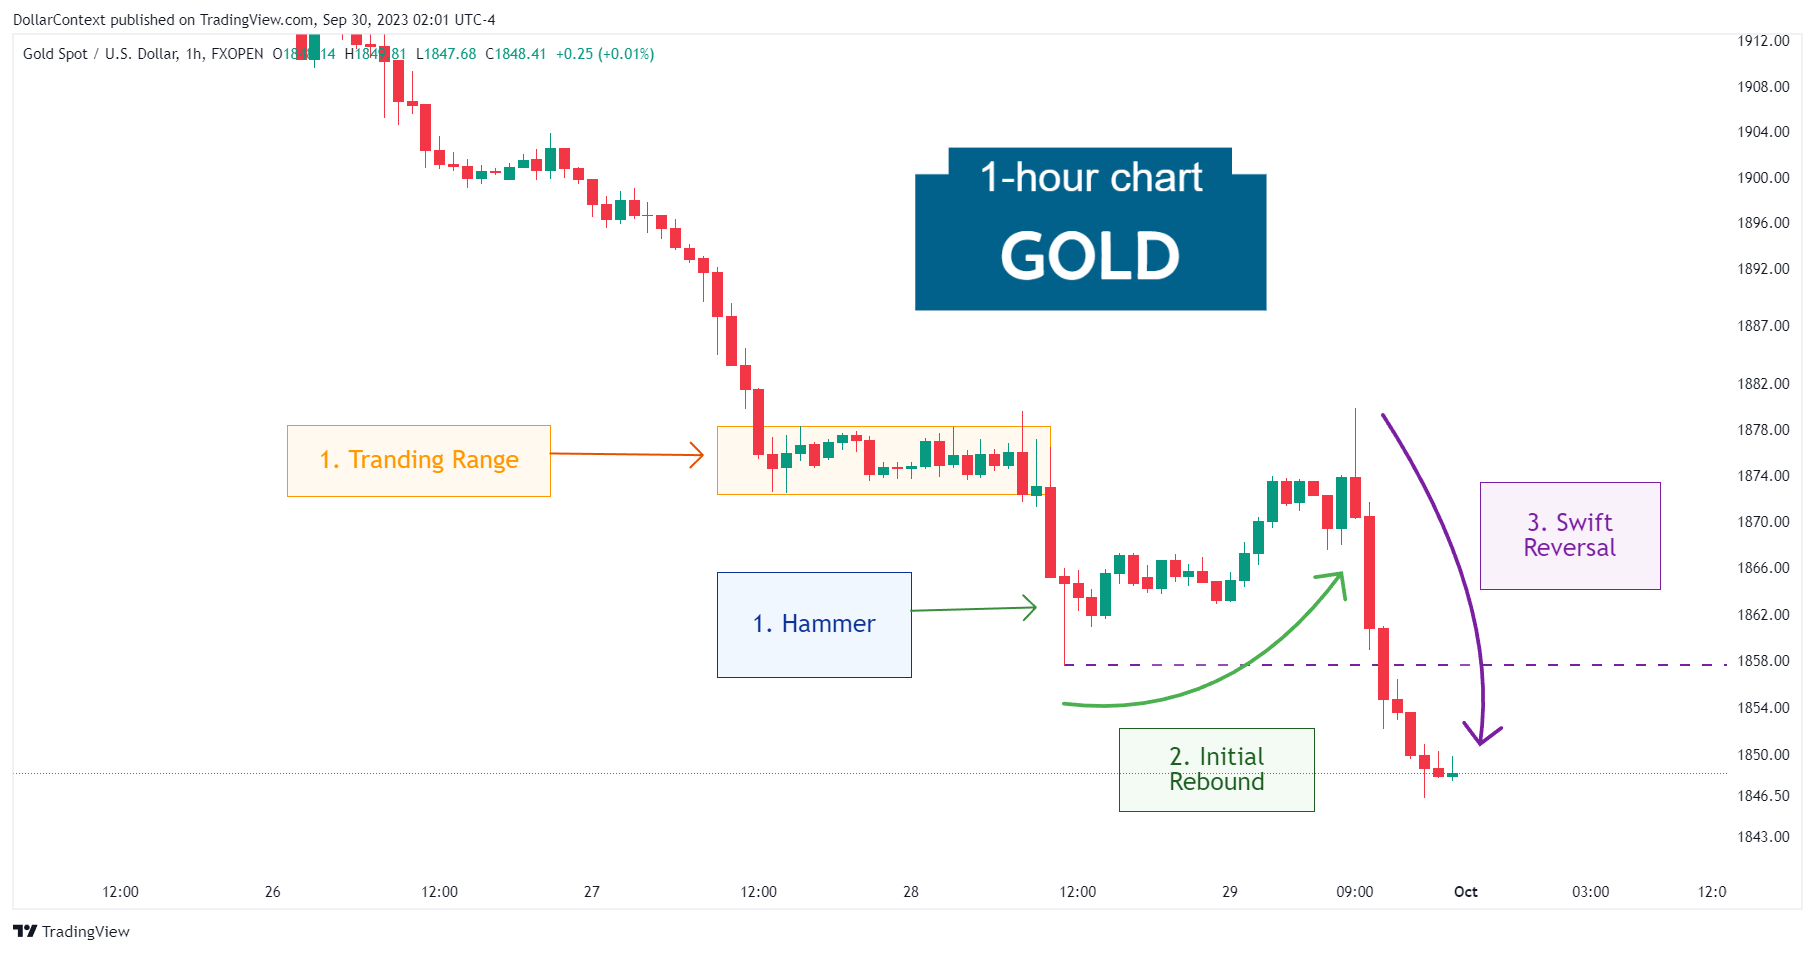
In this article, we will discuss the performance of the gold market after the appearance of a hammer pattern.
CANDLESTICK
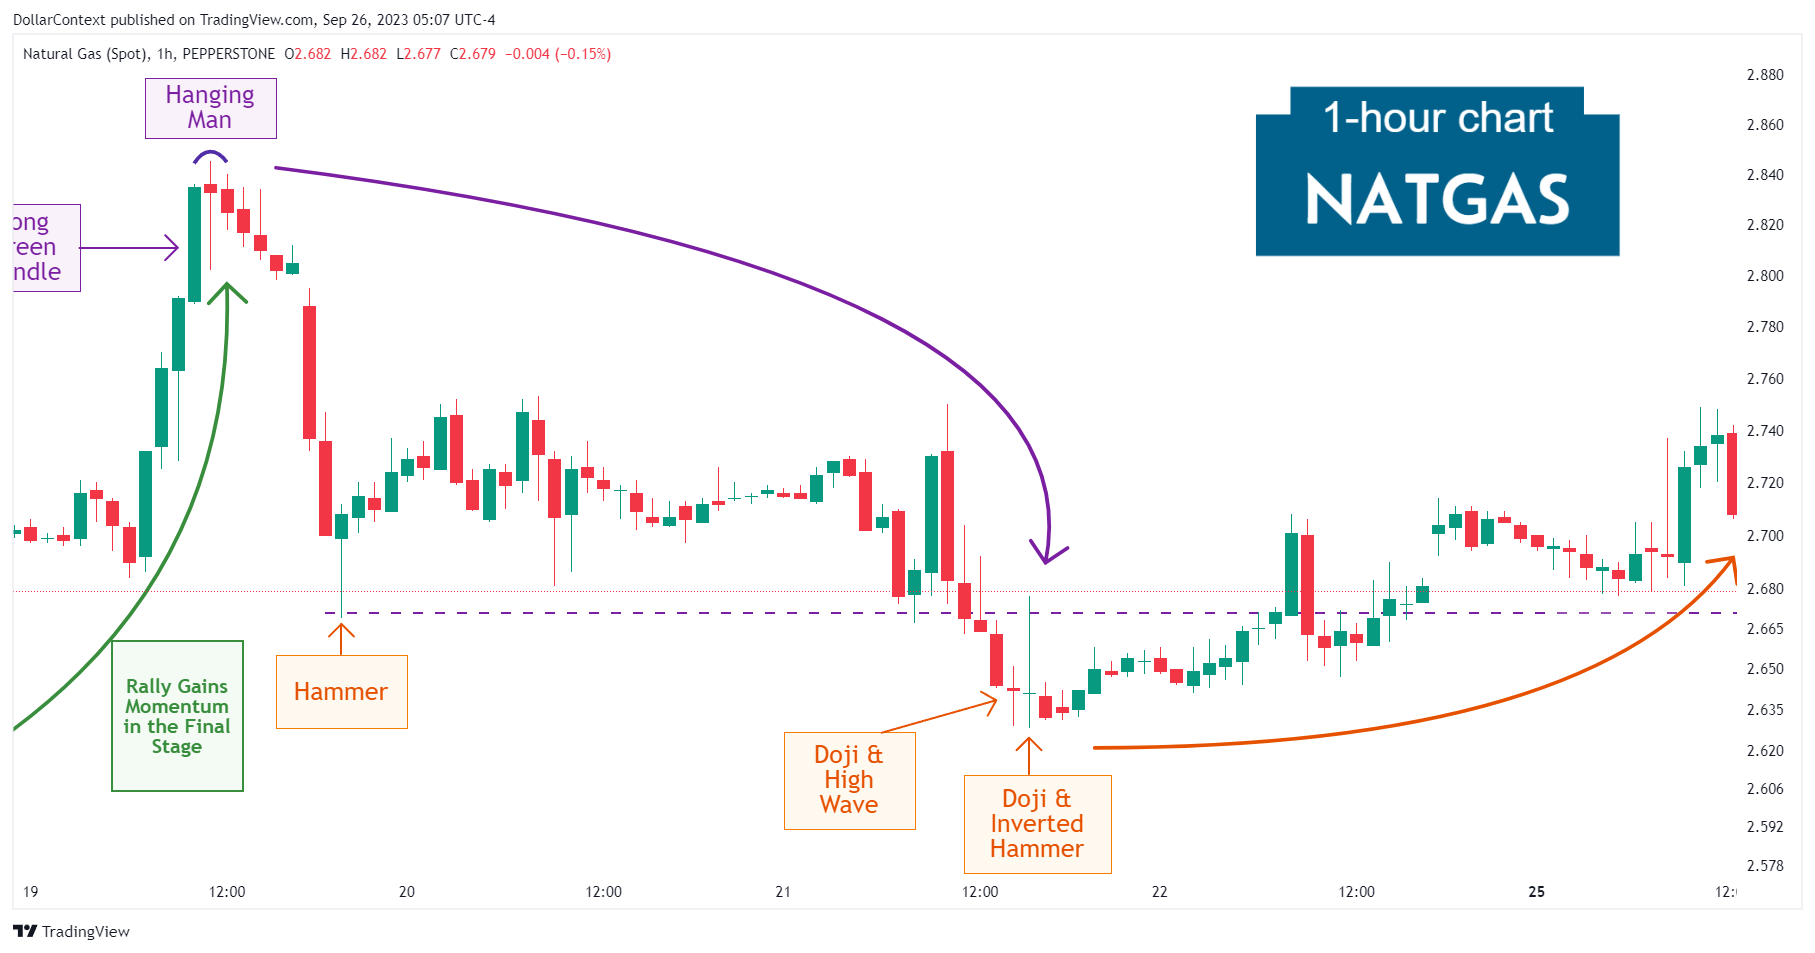
In this article, we will discuss the performance of a highly volatile market in which specific candlestick patterns effectively signaled price tops and bottoms.
CANDLESTICK
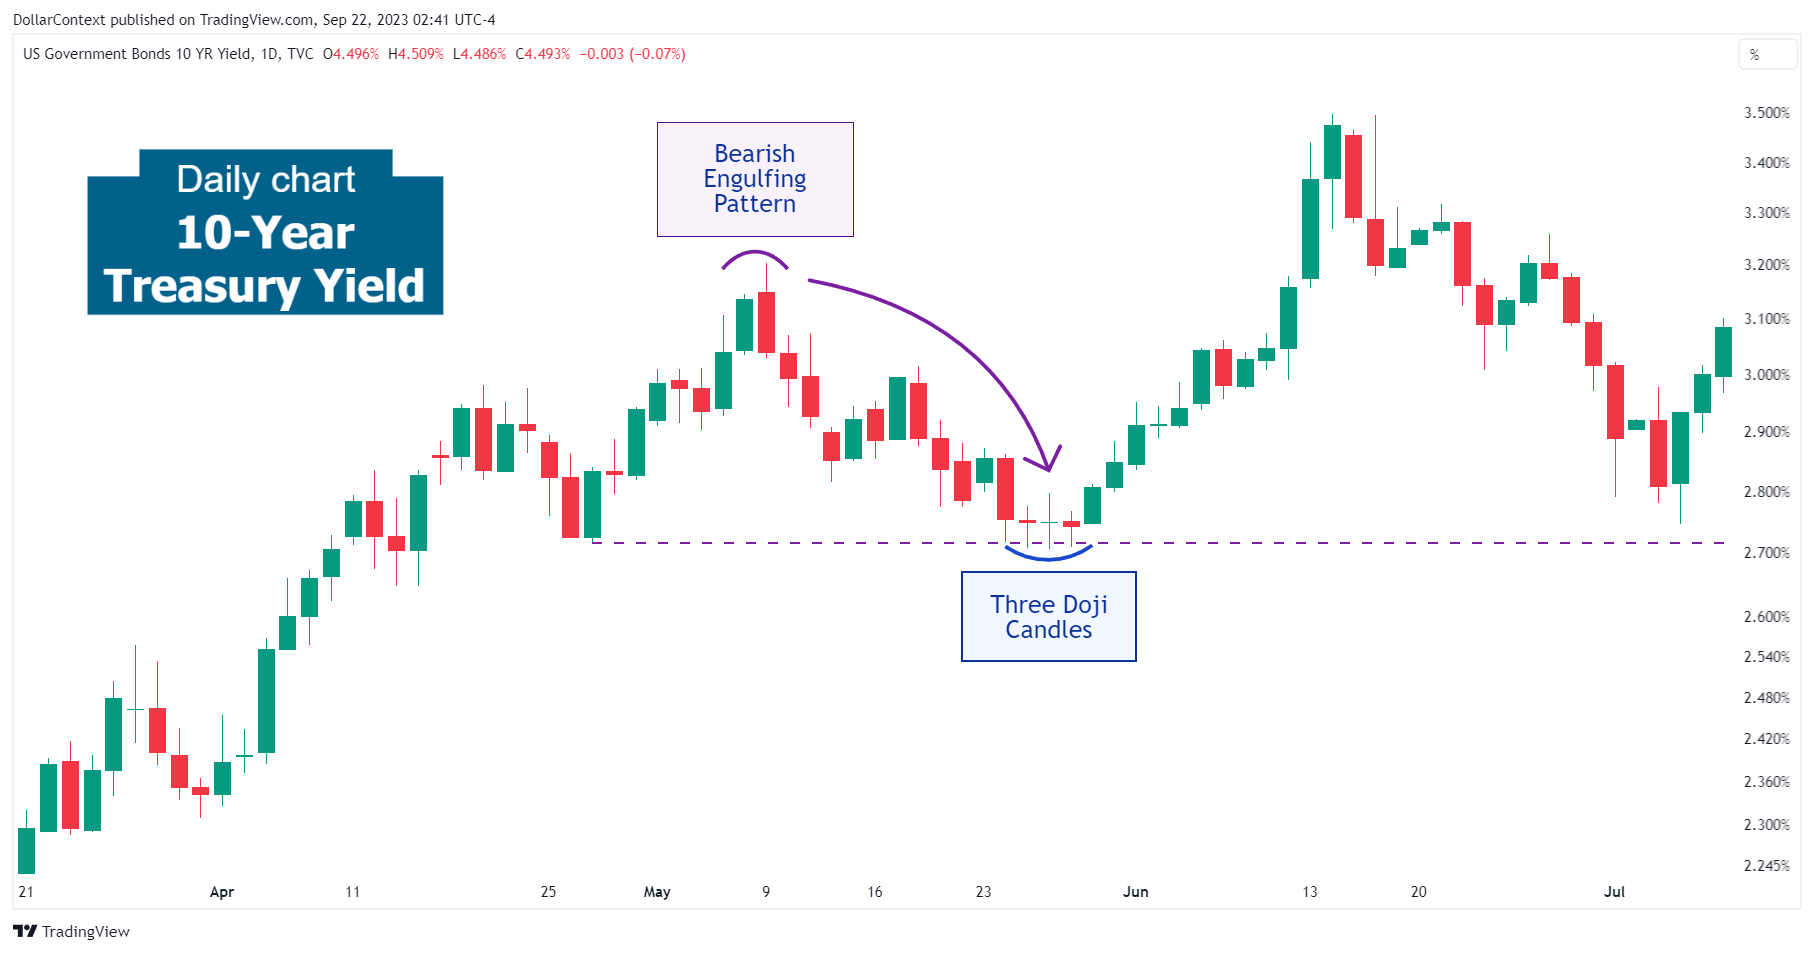
Following the appearance of the bearish engulfing pattern, there was a high likelihood of either a sideways trading range or a minor retracement.
CANDLESTICK
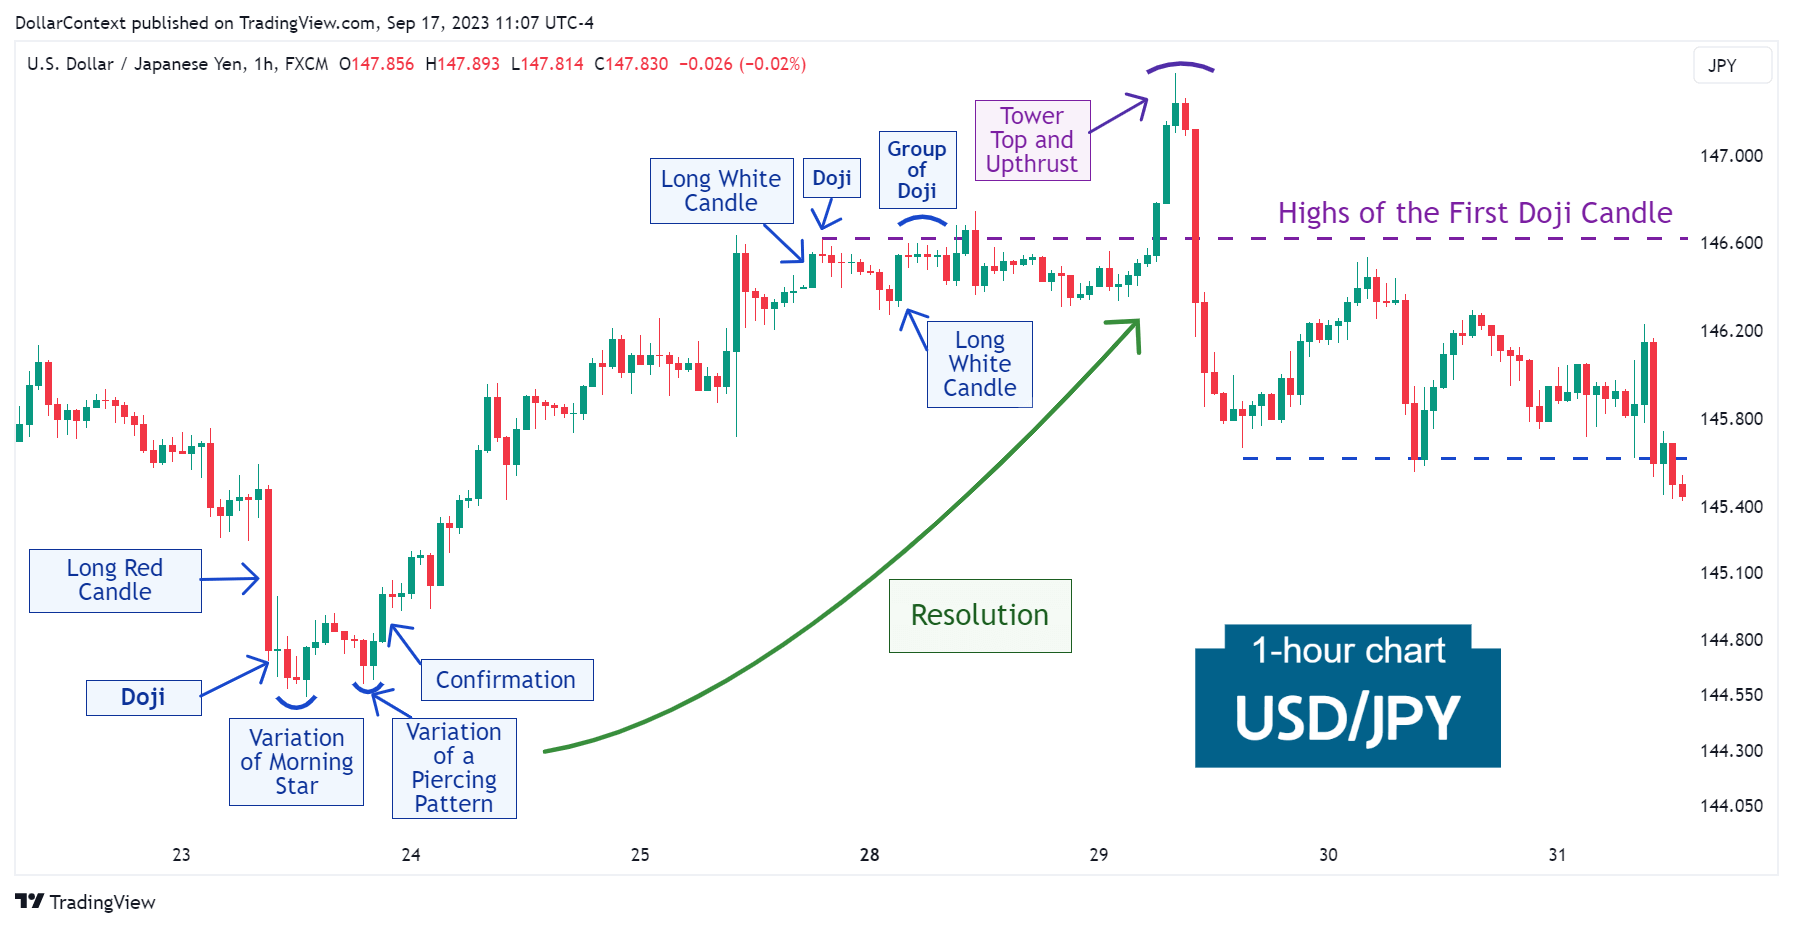
After an extended downtrend, the USD/JPY exhibited an exceptionally long red candle followed by a doji.