CANDLESTICK
Case Study 0023: Dark Cloud Cover and Spinning Tops (Natural Gas)
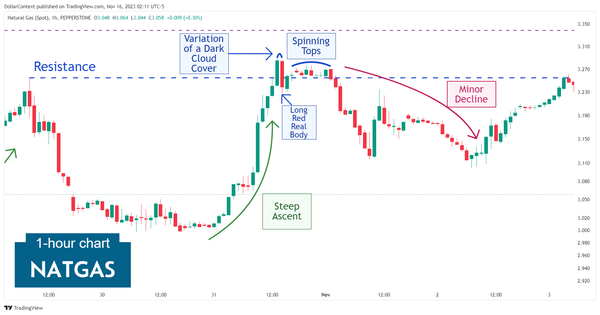
In this article, we will examine the performance of the natural gas market after the emergence of a dark cloud cover and a long black real body.
CANDLESTICK
In this article, we will examine the performance of the natural gas market after the emergence of a dark cloud cover and a long black real body.
CANDLESTICK
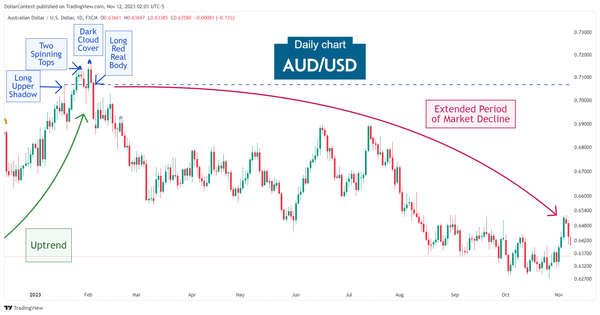
In this article, we will cover the performance of the AUD/USD after the emergence of a long upper shadow and a dark cloud cover.
CANDLESTICK
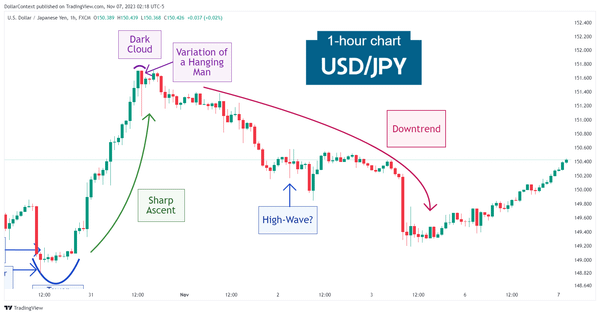
After a sharp rise of approximately 1.8 percent within an 18-hour timeframe, the USD/JPY presented a dark cloud cover and a hanging man candle line.
CANDLESTICK
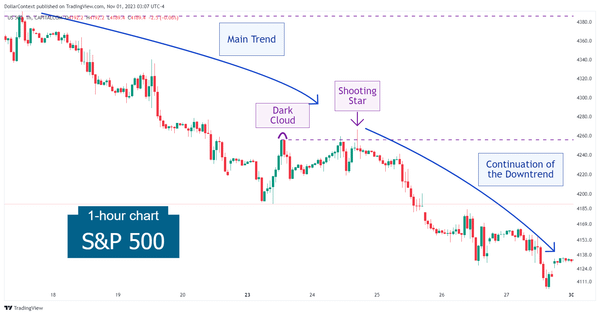
In this article, we will cover the performance of the S&P 500 after the emergence of a dark cloud cover and a shooting star.
CANDLESTICK
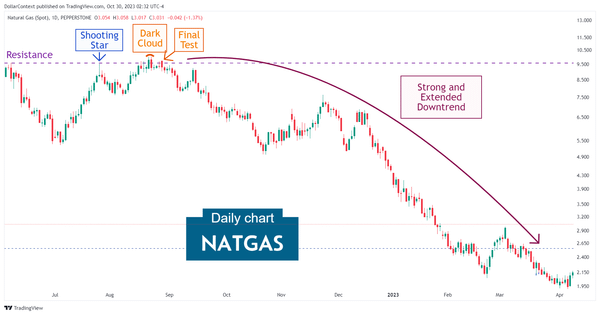
In this article, we will discuss the performance of natural gas prices after the emergence of a shooting star and a dark cloud cover.
CANDLESTICK
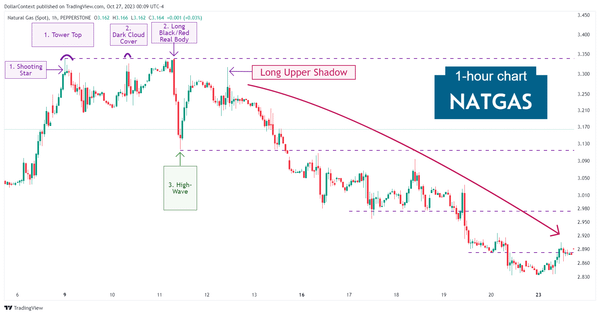
In this article, we will examine the performance of the natural gas market after the emergence of a tower top.
CANDLESTICK
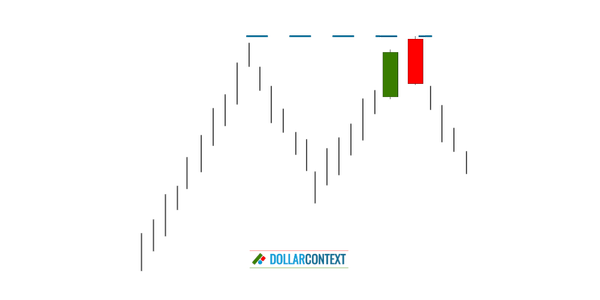
After either a mature or a sharp uptrend, a dark cloud cover can act as an indicator of reversal. This presents a potential opportunity for traders to establish short positions in the market.
CANDLESTICK
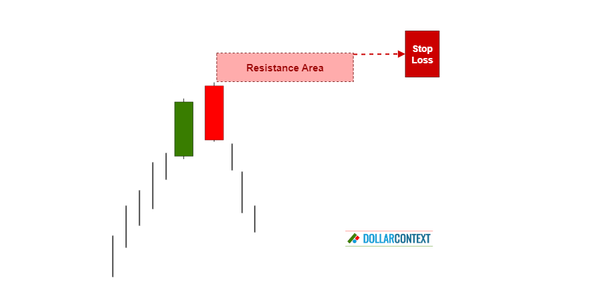
The highs of a dark cloud cover usually becomes resistance. This level acts as a ceiling that price struggles to break through.
CANDLESTICK
The highs of the dark cloud cover creates a resistance area. This resistance level represents your initial stop loss.

CANDLESTICK
This sudden reversal surprises those participants who had been expecting the upward trend to continue.
CANDLESTICK
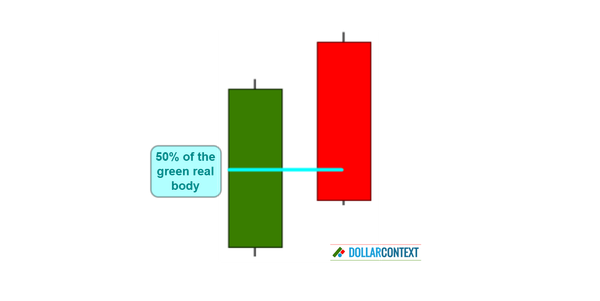
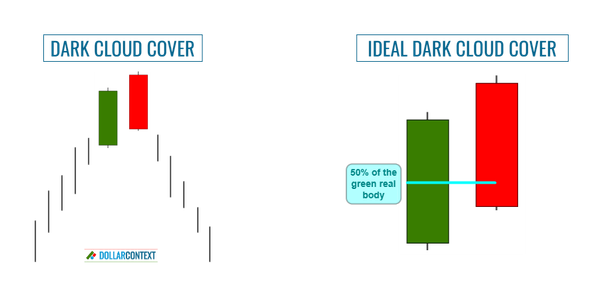
For an optimal dark cloud cover, the second session should ideally conclude below the midpoint of the preceding white/green candle.