Hammer: How to Set Your Stop loss
Set the stop-loss level below the low of the hammer pattern to protect against potential downside risk.
This article is part of the Hammer candlestick pattern tutorial series. For the complete guide, see the Hammer Candlestick Pattern — Complete Guide.
Setting a stop-loss level is a crucial aspect of trading, and it becomes especially important when considering the implementation of a hammer strategy. A hammer is a candlestick pattern that typically indicates a potential reversal in a downtrend.
In this post, we'll explain how you can effectively set a stop-loss when using the hammer pattern in your trading strategy.
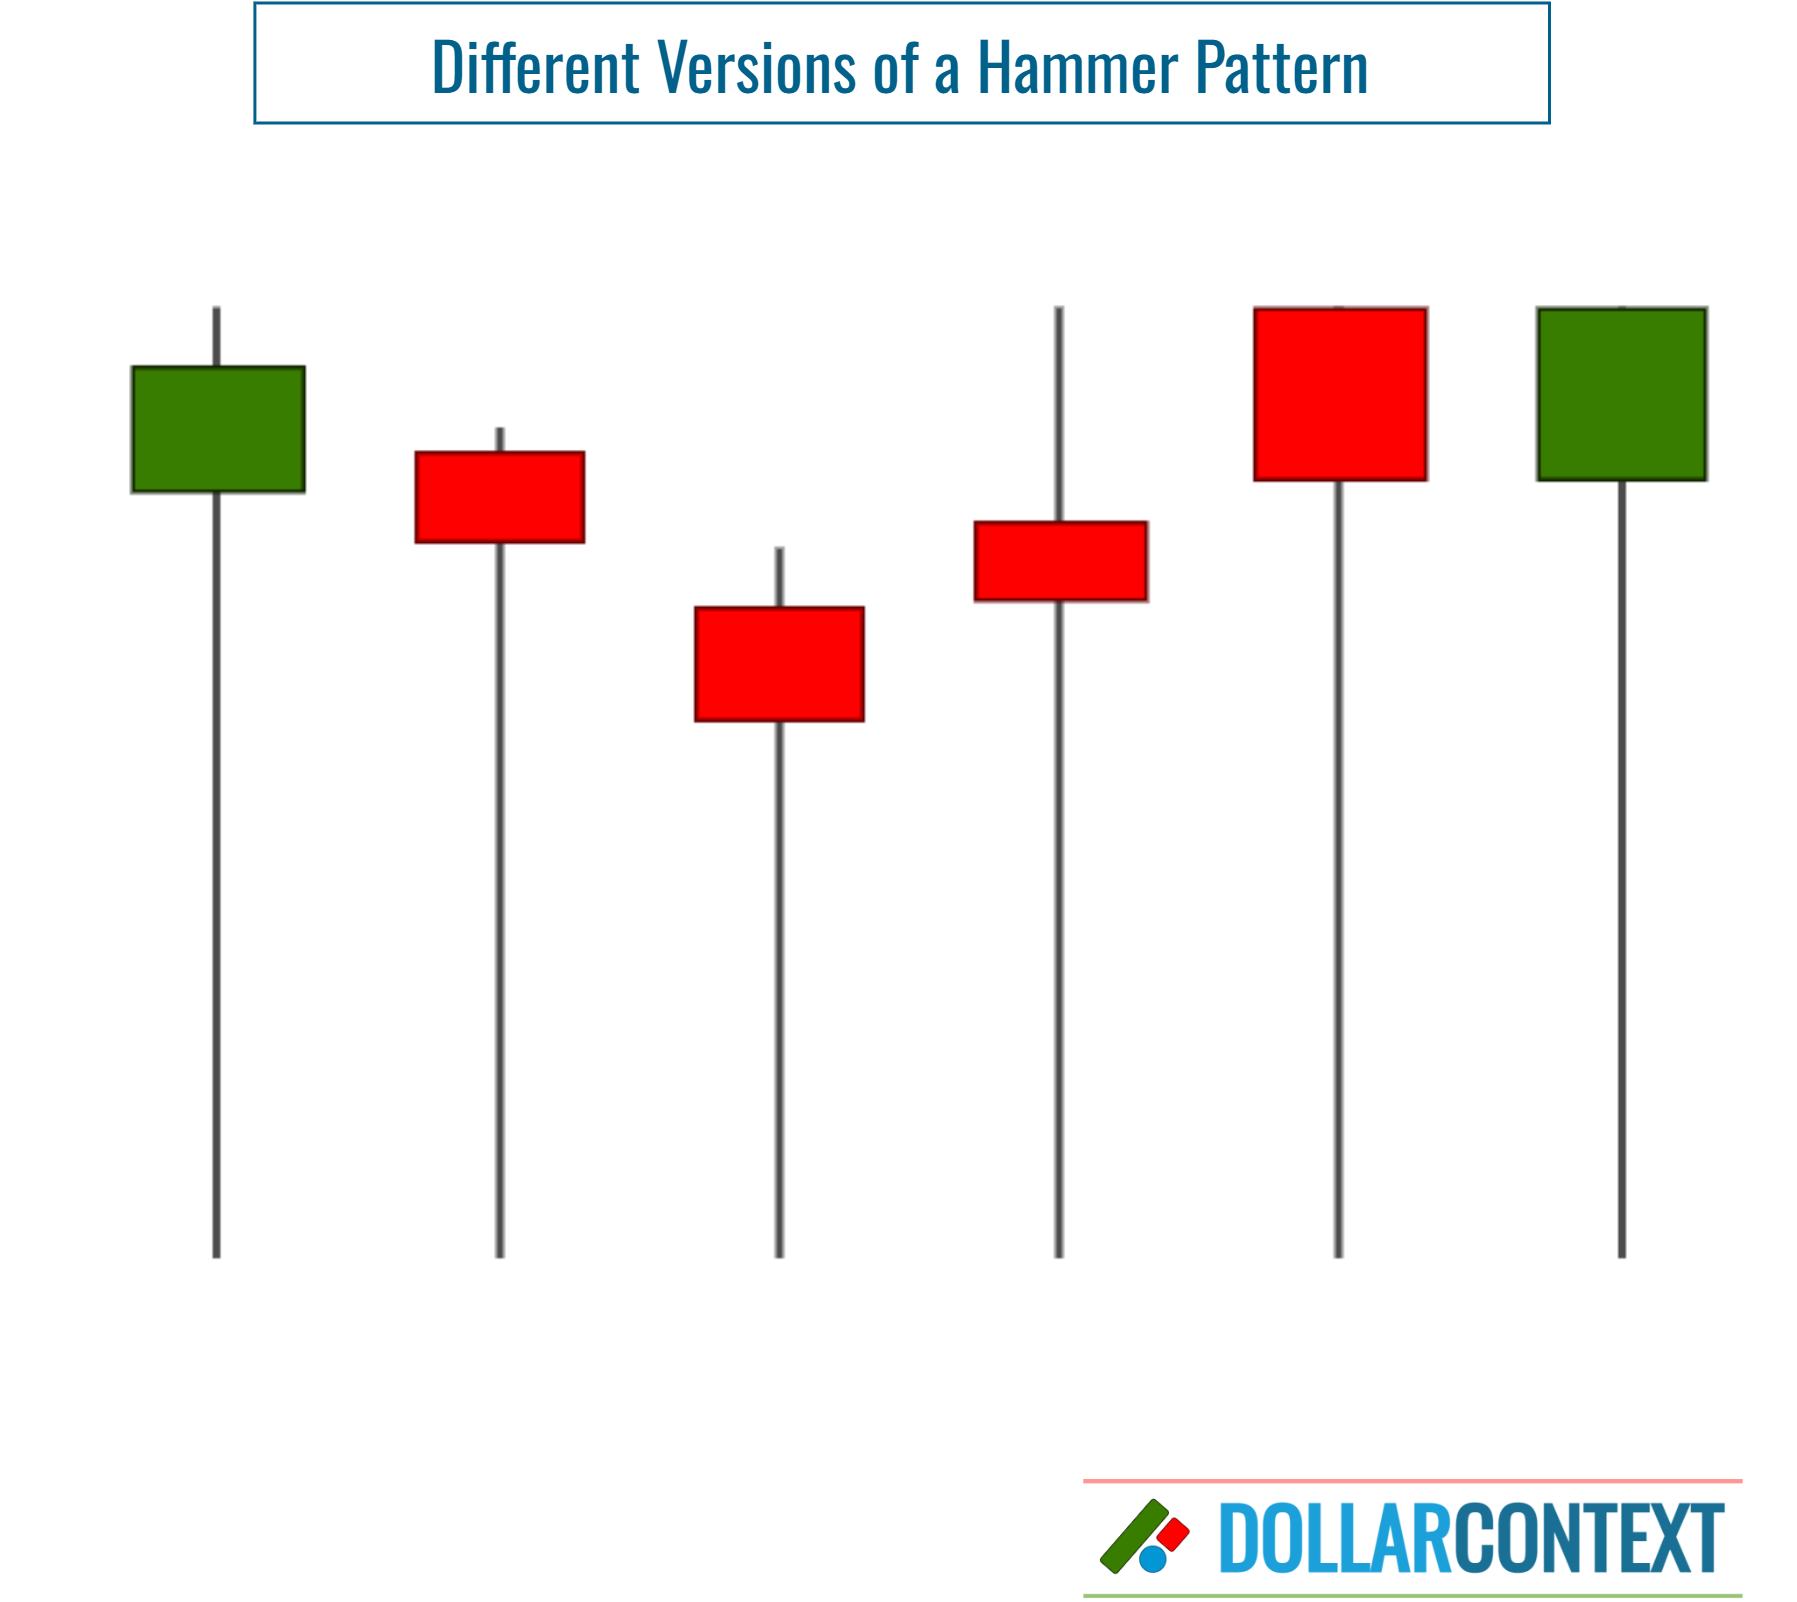
1. Correct Identification
Make sure you correctly recognize the hammer pattern on your chart. This is a single-candle pattern characterized by:
- a small real body at the higher end of the candle,
- an elongated lower shadow, and
- a very short (or nonexistent) upper shadow.
2. Verify the Preceding Trajectory
Psychologically, a hammer indicates a change in market sentiment. The market transitions from a bear to a bull trend; and as a reversal indicator, it requires a previous downward trend to reverse.
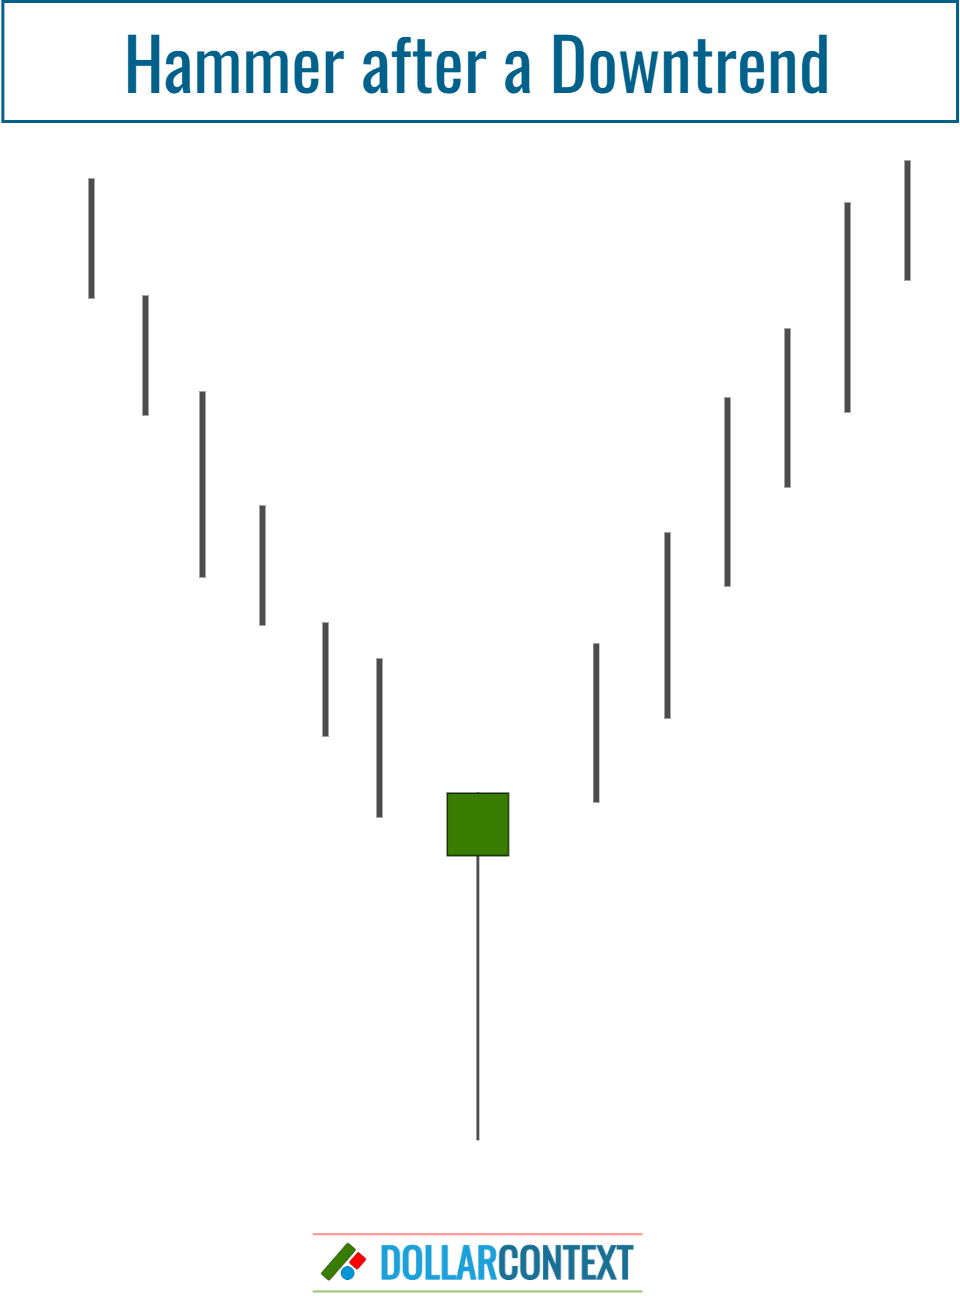
When the market is either confined within a narrow range or undergoing an uptrend, a hammer generally lacks meaningful significance.
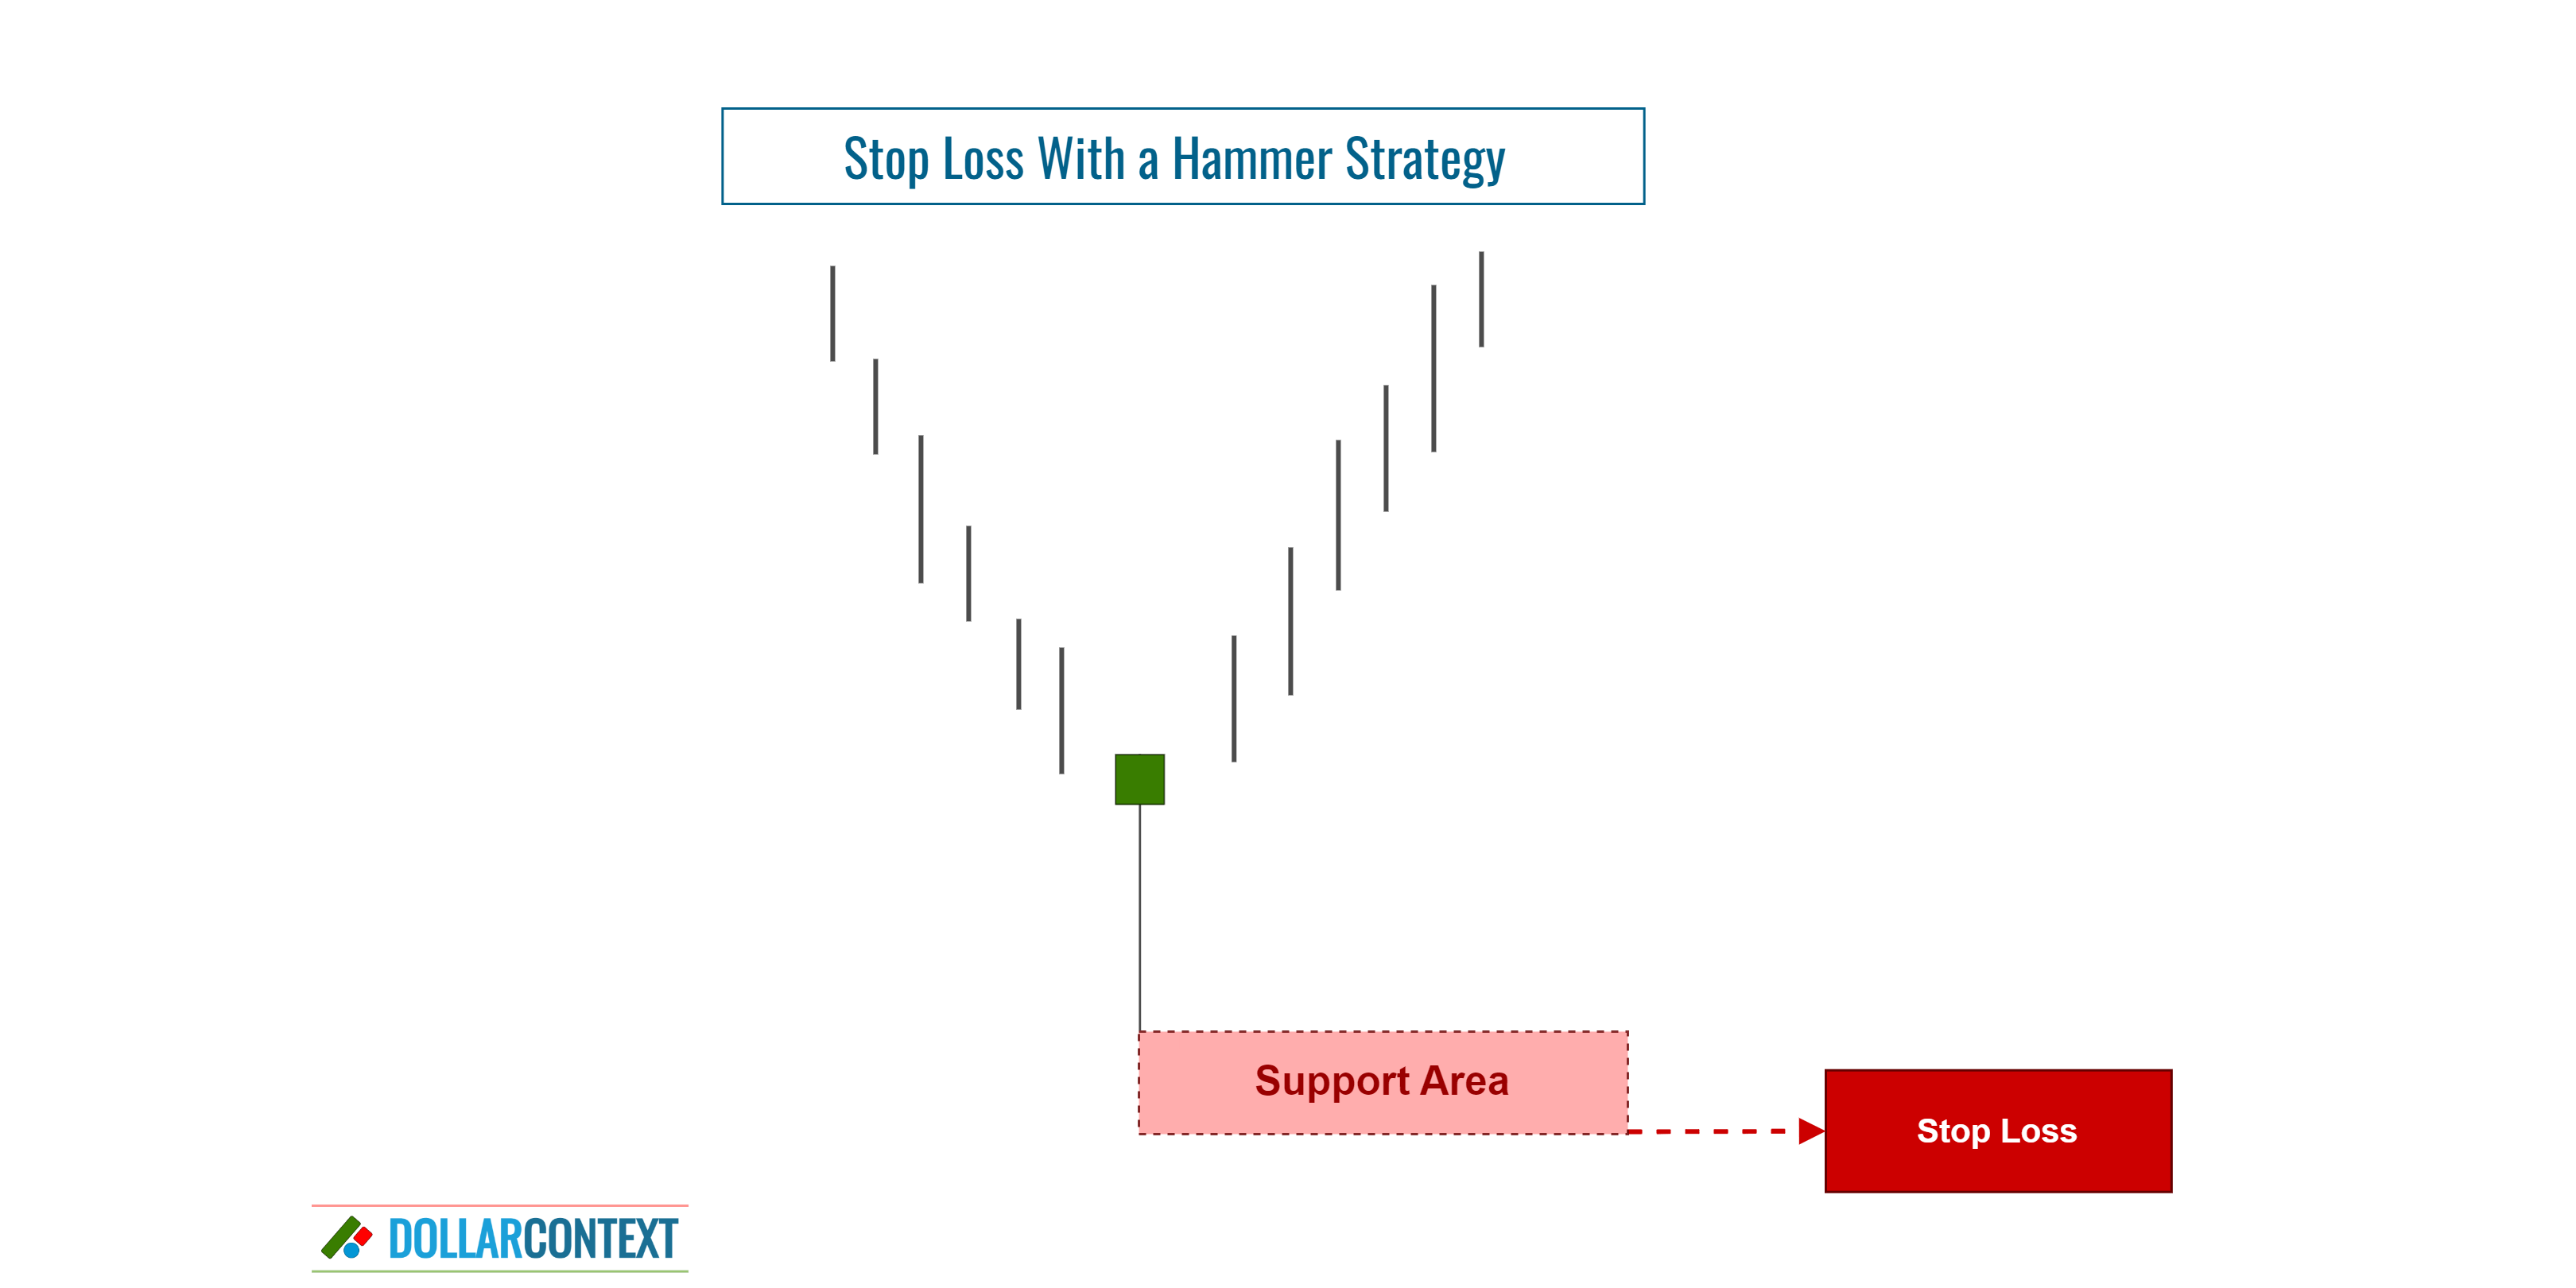
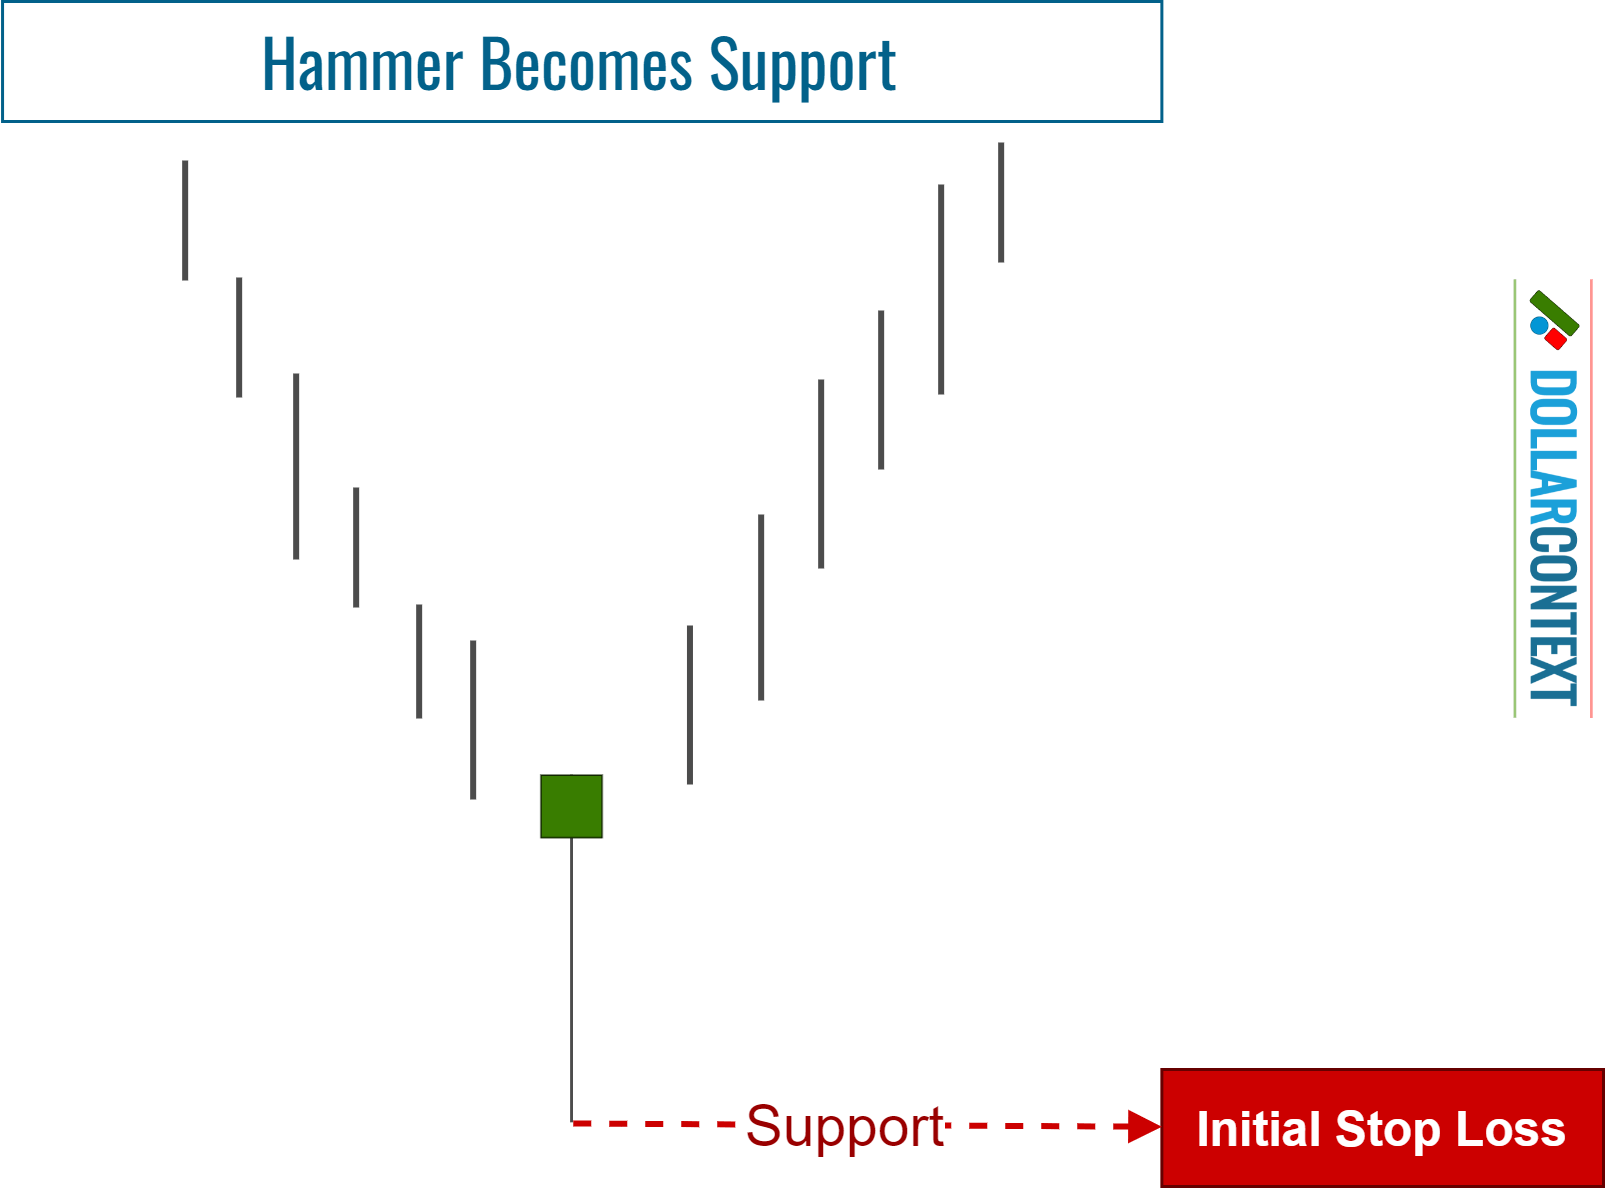
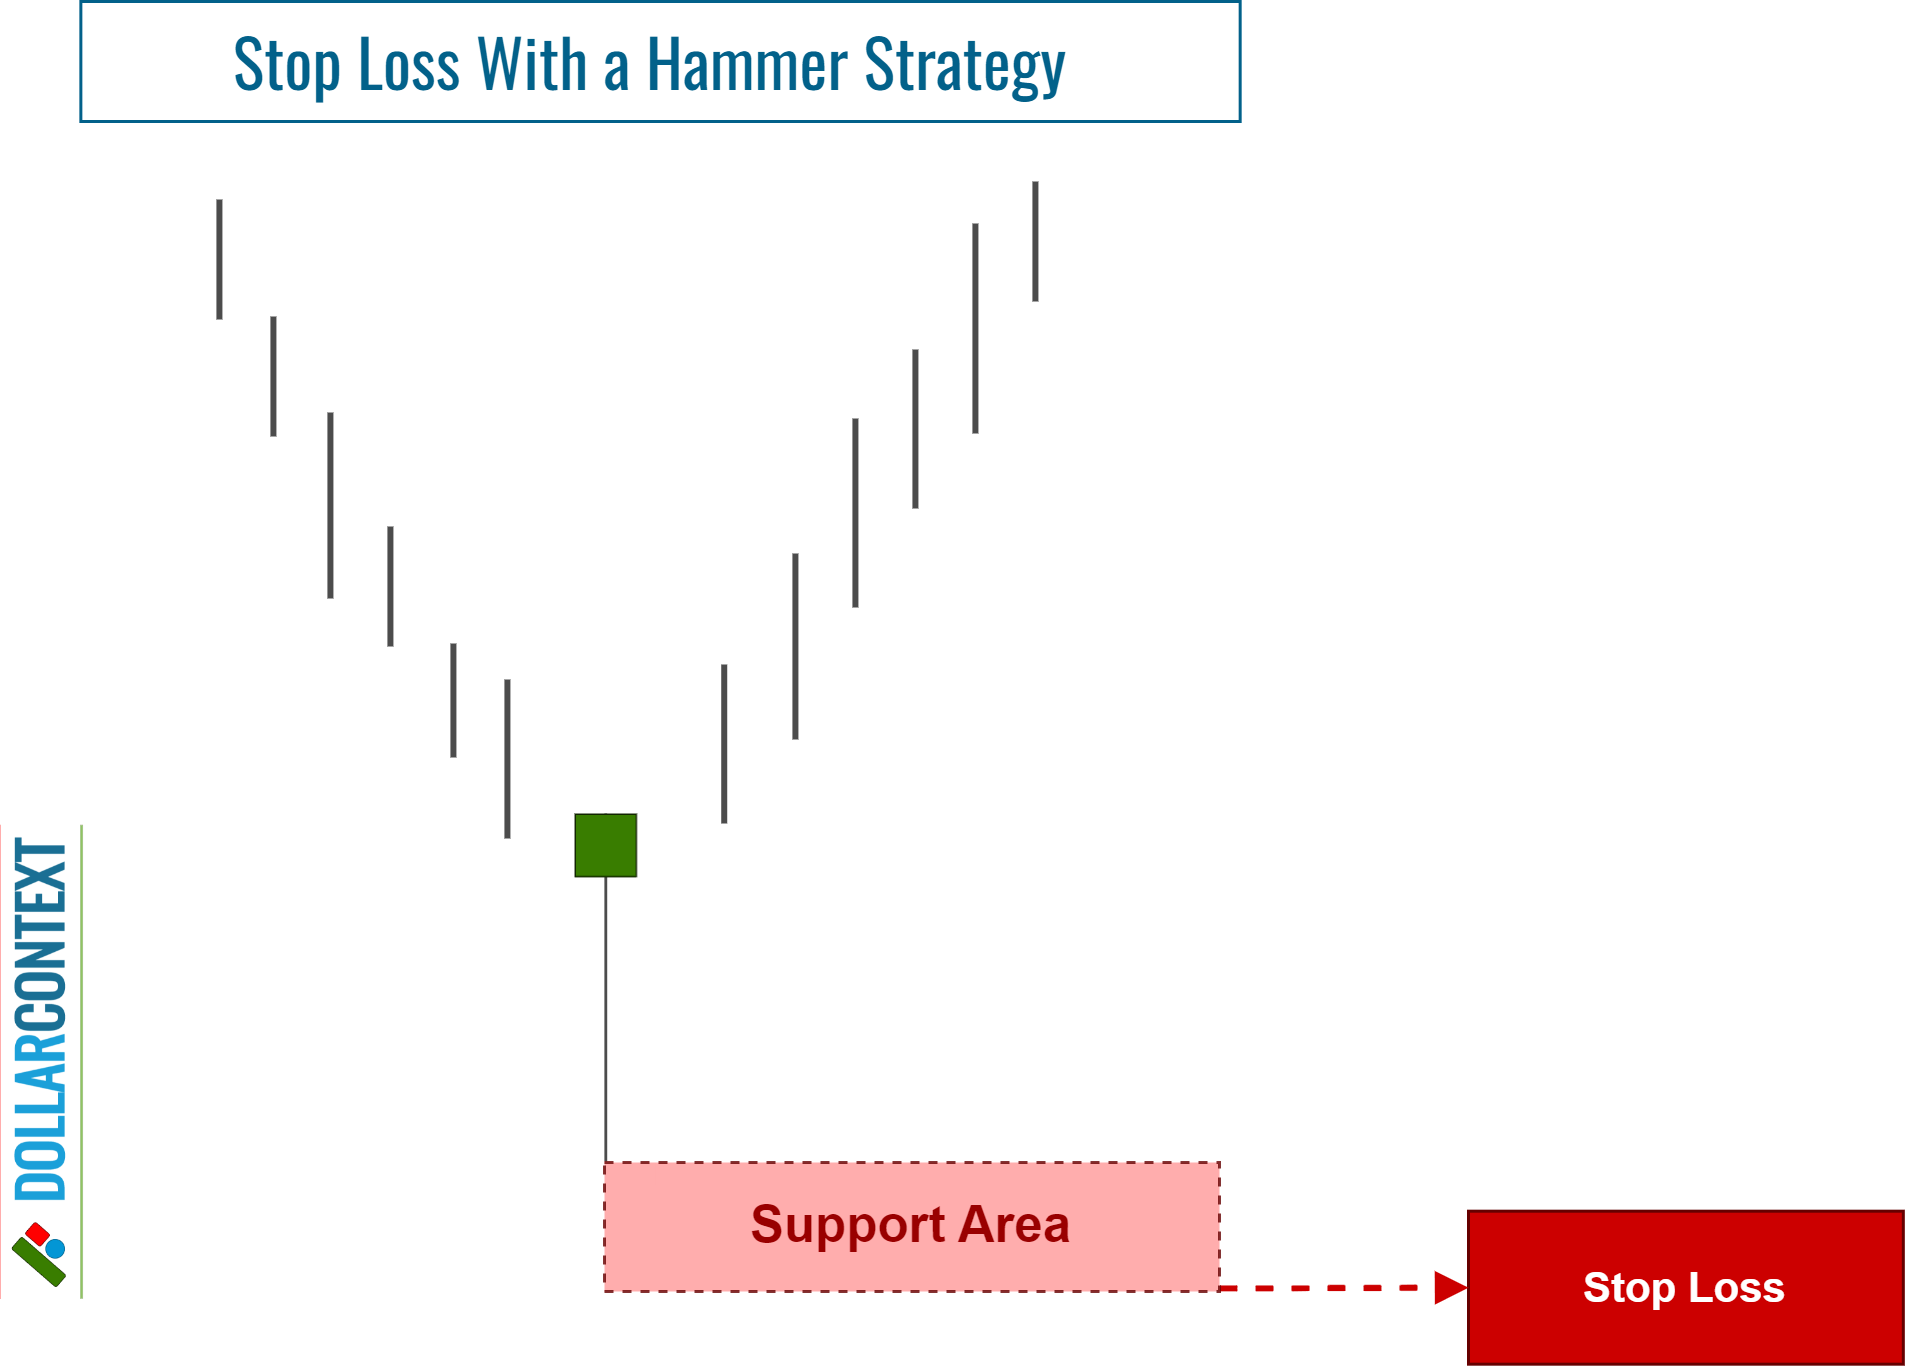
3. Determine the Support Threshold
The price range of a hammer becomes support. Specifically, the low of the session represents a support level that you can use as your initial stop loss point.
4. Consider Adding a Buffer
After evaluating factors like market volatility, risk management strategies, and various market conditions, it may be prudent to incorporate a buffer into your initial stop-loss level. This extra layer of protection can effectively help shield you from the consequences of false breakouts.
5. Is Your Stop Based on the Close?
A stop activated upon closing takes place when the closing price of a trading session exceeds the stop-loss limit, instead of merely depending on intra-session price movements.
It is generally recommended to set a stop at a close when working with candlestick charts, especially if you're using a hammer pattern to initiate your position.
6. Monitor the Trade
Continuously observe the market and your position to ensure they remain in harmony with your hammer strategy:
- Adjust your stop-loss level as needed. The market is ever-changing, and new candlestick patterns may develop as your trade unfolds. In such cases, consider fine-tuning your stop-loss point to align with the evolving conditions. For instance, if a new candlestick pattern forms around the same level as your hammer, it would be wise to adjust your stop to the lowest point of both patterns.
- When the price movement is favorable, contemplate implementing a trailing stop-loss to safeguard profits and effectively manage risk.
- Maintain discipline. Steer clear of emotion-driven decisions, regardless of market volatility.
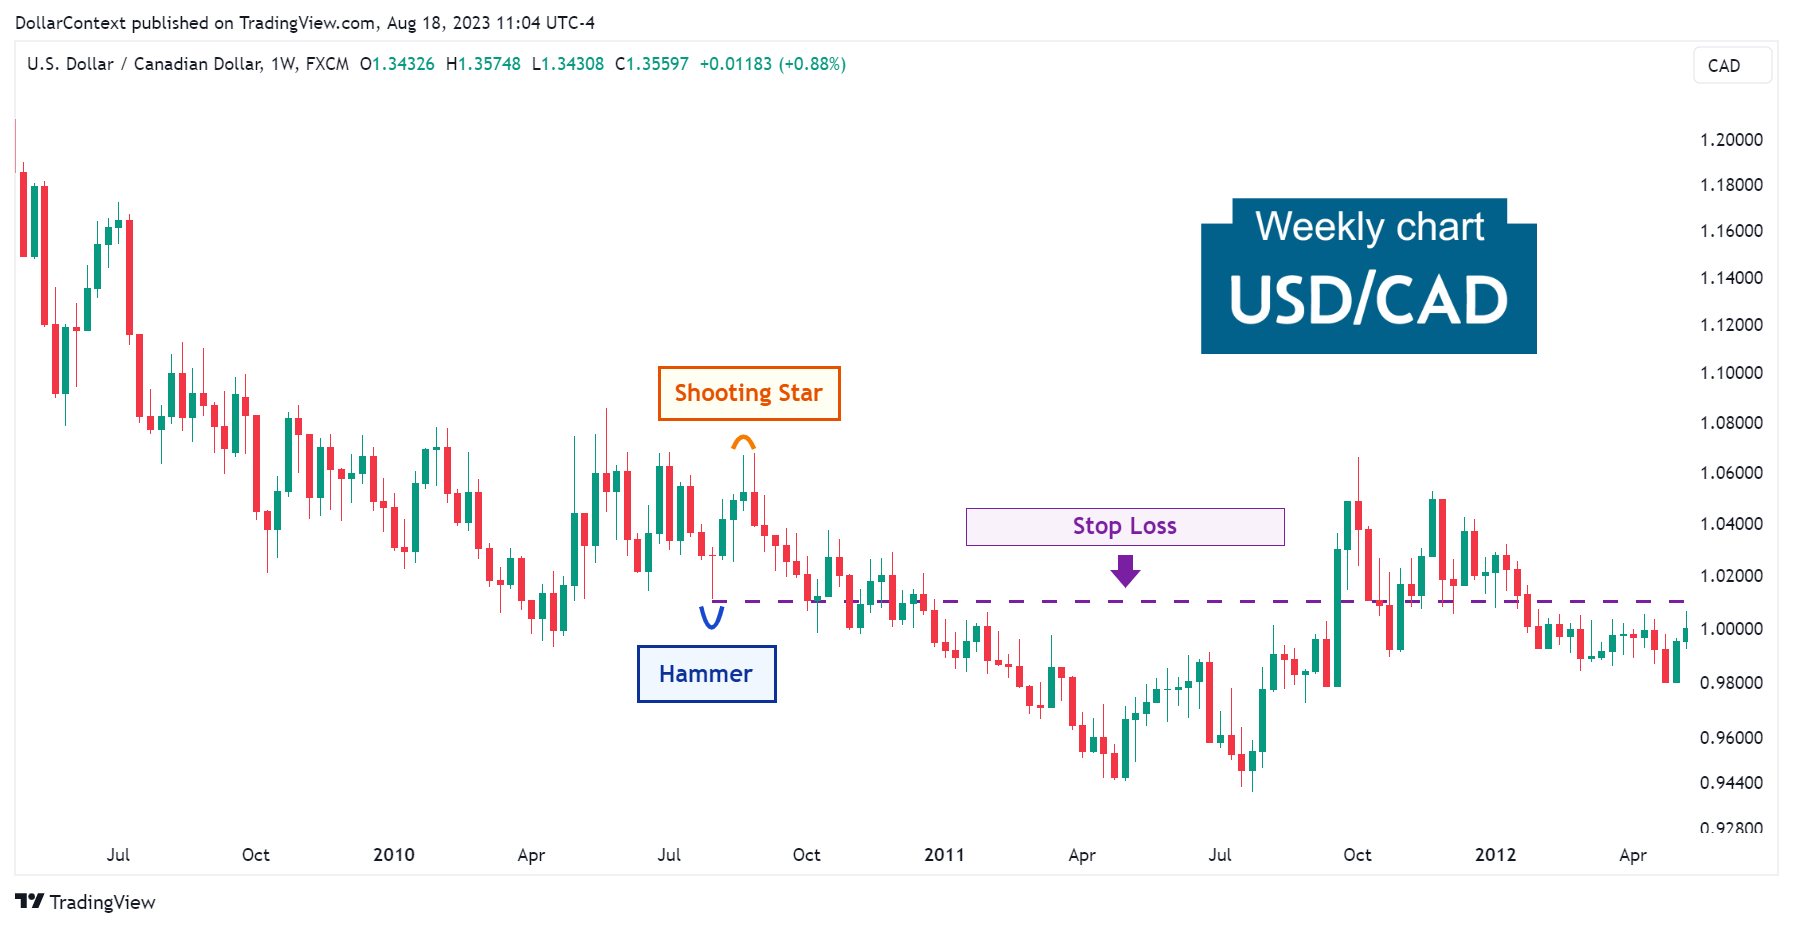
The USD/CAD chart below illustrates the importance of using a stop-loss strategy and maintaining a cautious stance regarding bullish predictions after the appearance of a hammer pattern.
In the first week of August 2010, the USD/CAD chart revealed a hammer pattern, which initiated a minor rally. The emergence of a shooting star candle just three sessions after the rally sent out a warning that the bullish momentum could be countered by prevailing bearish forces.