High-wave Candlestick Strategy: A Comprehensive Tutorial
The high-wave candle is characterized by its distinct long upper and lower shadows, which are significantly longer than the candle's real body.
Today we’re going to look at a crucial candle within the realm of Japanese candlestick analysis: the high-wave. Often overlooked by many investors, this line holds unique characteristics that can provide valuable insights into market sentiment and potential price reversals.
Before delving into the specifics of this significant candle, let's bear in mind two essential aspects of most candlestick signals, including the high-wave:
- Candlestick patterns function as reversal signals, suggesting that the current trend may be coming to an end, and a new trend in the opposite direction could be starting.
- Candlestick patterns work in all timeframes, including minutes, hours, days, or months.
Contents
1. Shape
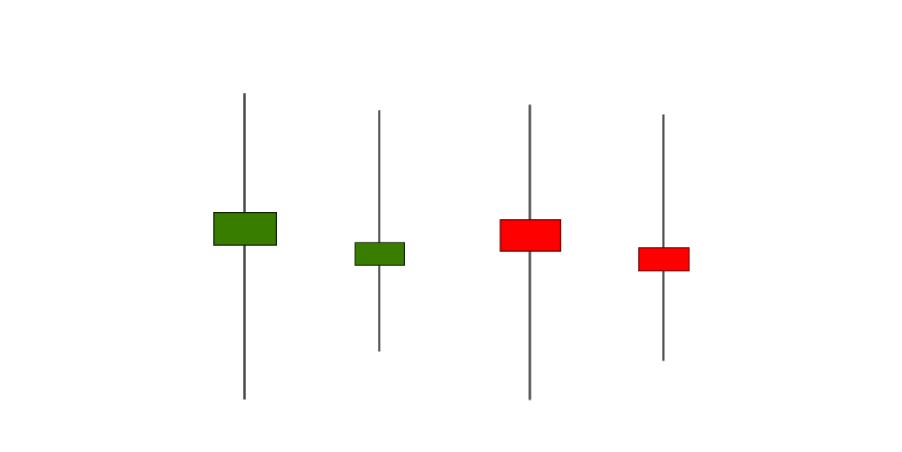
The high-wave is characterized by its distinct long upper and lower shadows, which are significantly longer than the candle's real body.
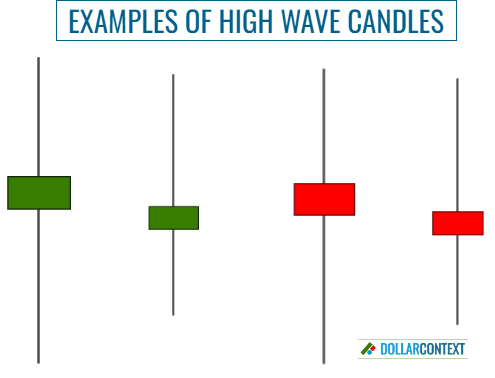
The upper and lower shadows don’t have to be identical; that is, they can differ in length while still qualifying as a high-wave formation.
The real body of a high-wave is typically small or nonexistent, representing a narrow range between the open and close prices. The color of the real body is irrelevant. What truly matters in this pattern are the elongated upper and lower shadows, indicative of market indecision and high price volatility.
2. Context
The context in which a candlestick pattern emerges is equally important, if not more important, than the shape of the candle itself.
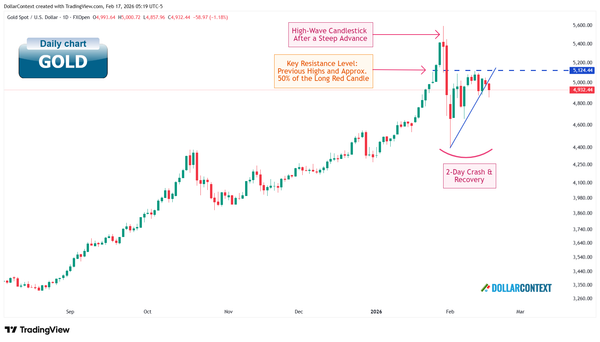
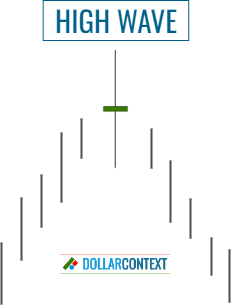
Following a prolonged or sharp uptrend, a high-wave candle can serve as a reversal signal, presenting an opportunity for traders to initiate short positions in the market.
Likewise, when a high-wave candle appears after a downtrend, it indicates that the downward movement might have reached a point of exhaustion.
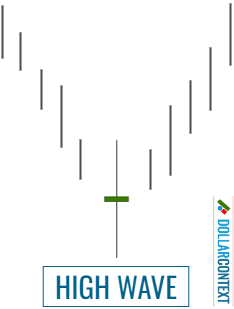
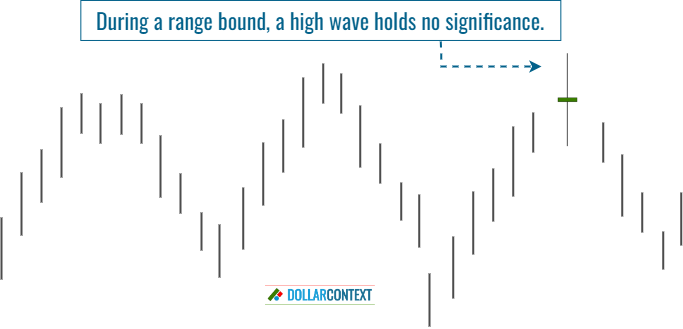
The likelihood of a reversal increases proportionally to the strength of the preceding trend. If the market is trading sideways, a high-wave candle remains neutral and lacks the potential to be used as a trading signal.
3. Psychology
The appearance of a high-wave candle reflects a market standoff between bulls and bears. In Japanese candlestick analysis, when a high-wave forms following a downtrend or uptrend, it indicates that the market has lost its sense of direction. The absence of a clear market orientation implies that the previous trend is currently vulnerable and may be subject to a reversal.
Psychologically, a high-wave pattern denotes equilibrium, indecision, and volatility. To be used as a reversal indicator, this candle should have an uptrend or downtrend to reverse.
4. Stop-loss
Before setting a level of stop-loss with a high-wave strategy:
- Ensure that you accurately identify the high-wave on your chart. Remember, it should have unusually long upper and lower shadows.
- Verify that the candle arises after a strong or extended bull market (or bear market). Avoid using it as a trading signal if the market is in a range-bound phase.
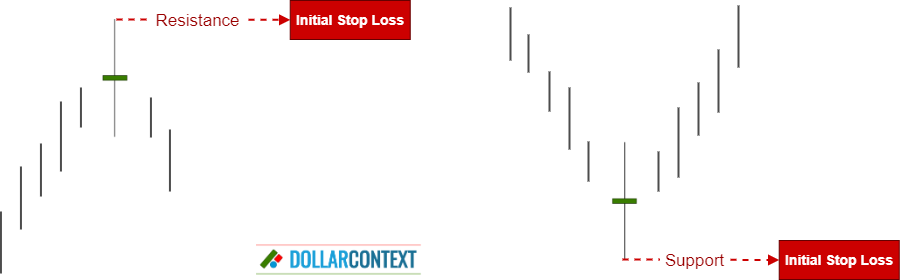
A high-wave pattern always creates, or reinforces, a support/resistance area consisting of:
- The highs of the candle after an uptrend.
- The lows of the candle after a downtrend.
This support/resistance level will serve as your initial reference for the stop-loss.
Then you will have to make two additional decisions about:
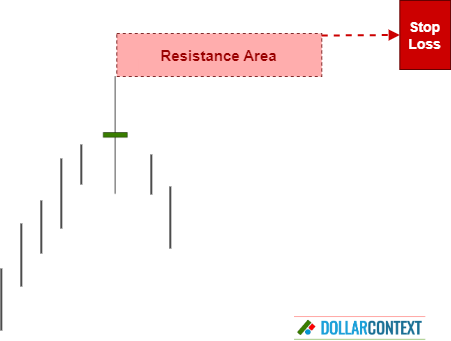
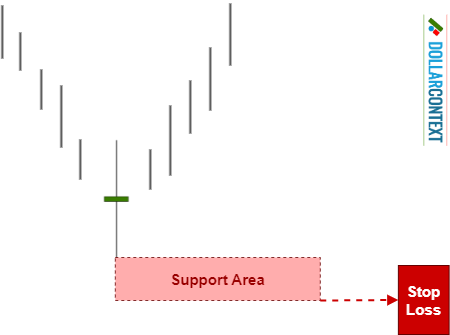
- Considering adding a buffer to avoid being stopped out during a volatile session or a false breakout.
- Determining whether to base your stop on a close. That is, if the stop-loss level should be violated, and therefore triggered, based on the closing price (recommended), instead of simply relying on the intra-session price action.
Finally, you must keep a close eye on the market and make adjustments as needed to align with its current conditions. For example, as the trade unfolds, you might encounter additional candlestick patterns that strengthen the originally identified resistance/support area. In such a situation, you can consider making slight adjustments to your stop-loss level to better match the new candlestick pattern.
5. Profit Target
In general, candlestick patterns provide reversal signals and entry points. They do not offer, however, specific price targets for taking profits. To accomplish this, you will have to use alternative forms of technical analysis, such as Fibonacci retracements, simple moving averages, previous support/resistance areas, etc.
Having said that, if you find yourself in a favorable trade, and a new candlestick pattern emerges indicating a potential reversal in the opposite direction, you can consider using this new pattern as an exit point.
6. High-wave Doji
Usually, but not always, the high-wave signal becomes more reliable as the real body gets smaller. If the session's open and close are the same (or almost the same), the body forms basically a horizontal line. In this situation, the high-wave candle is alternatively known as a high-wave doji or a long-legged doji.
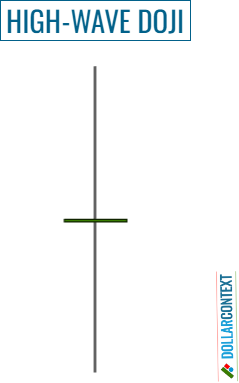
The presence of a long-legged doji strengthens the concepts of balance, uncertainty, and volatility mentioned above, thereby increasing the potential for a market reversal.
7. Examples
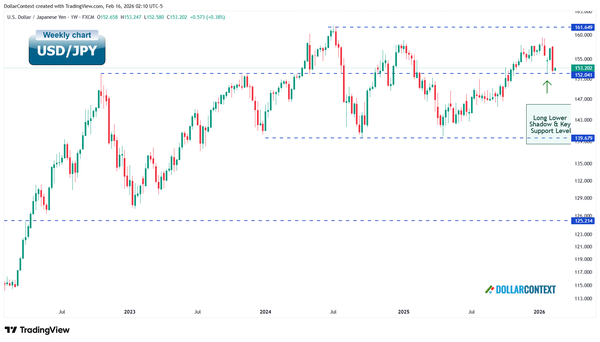
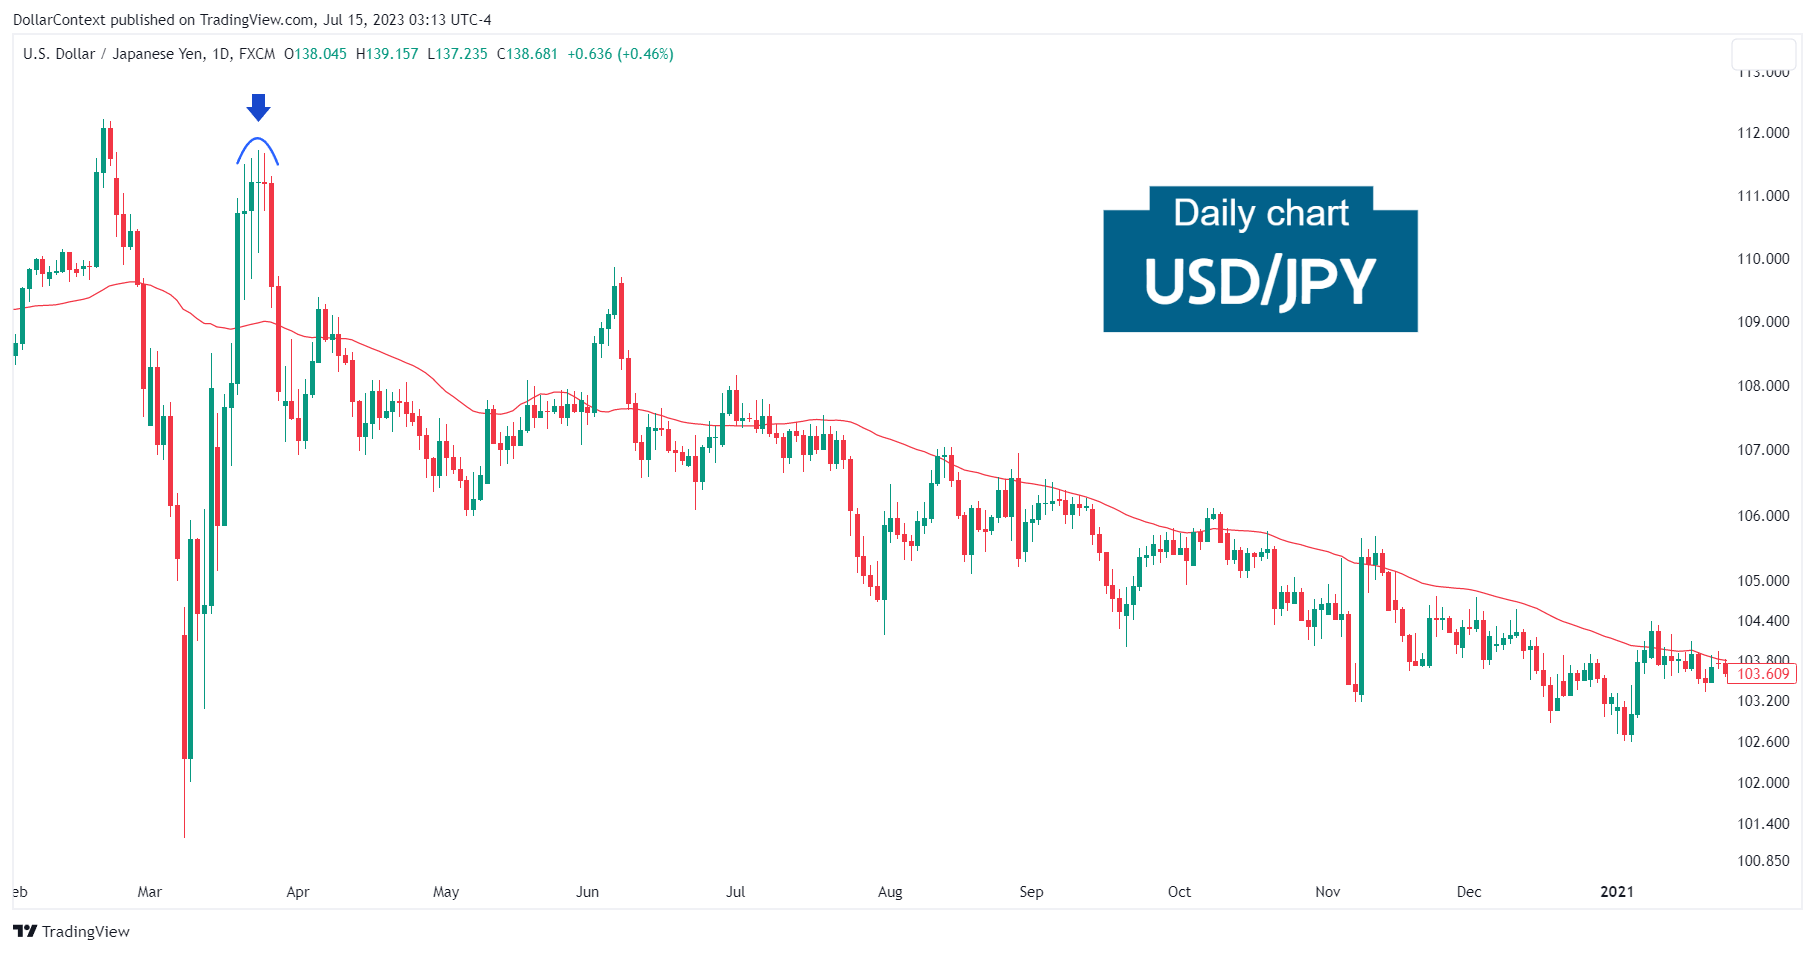
USD/JPY
The daily chart below depicts a sequence of high-wave candles in the USD/JPY pair (blue arrow on the chart). The recurrence of this pattern enhances its potential for market reversals. It’s also worth noting that:
- The series of high-waves emerged after an extremely overbought market.
- Following the occurrence of these high-wave candles, the market initially collapses, and then continues an extended downward trend for over 9 months.
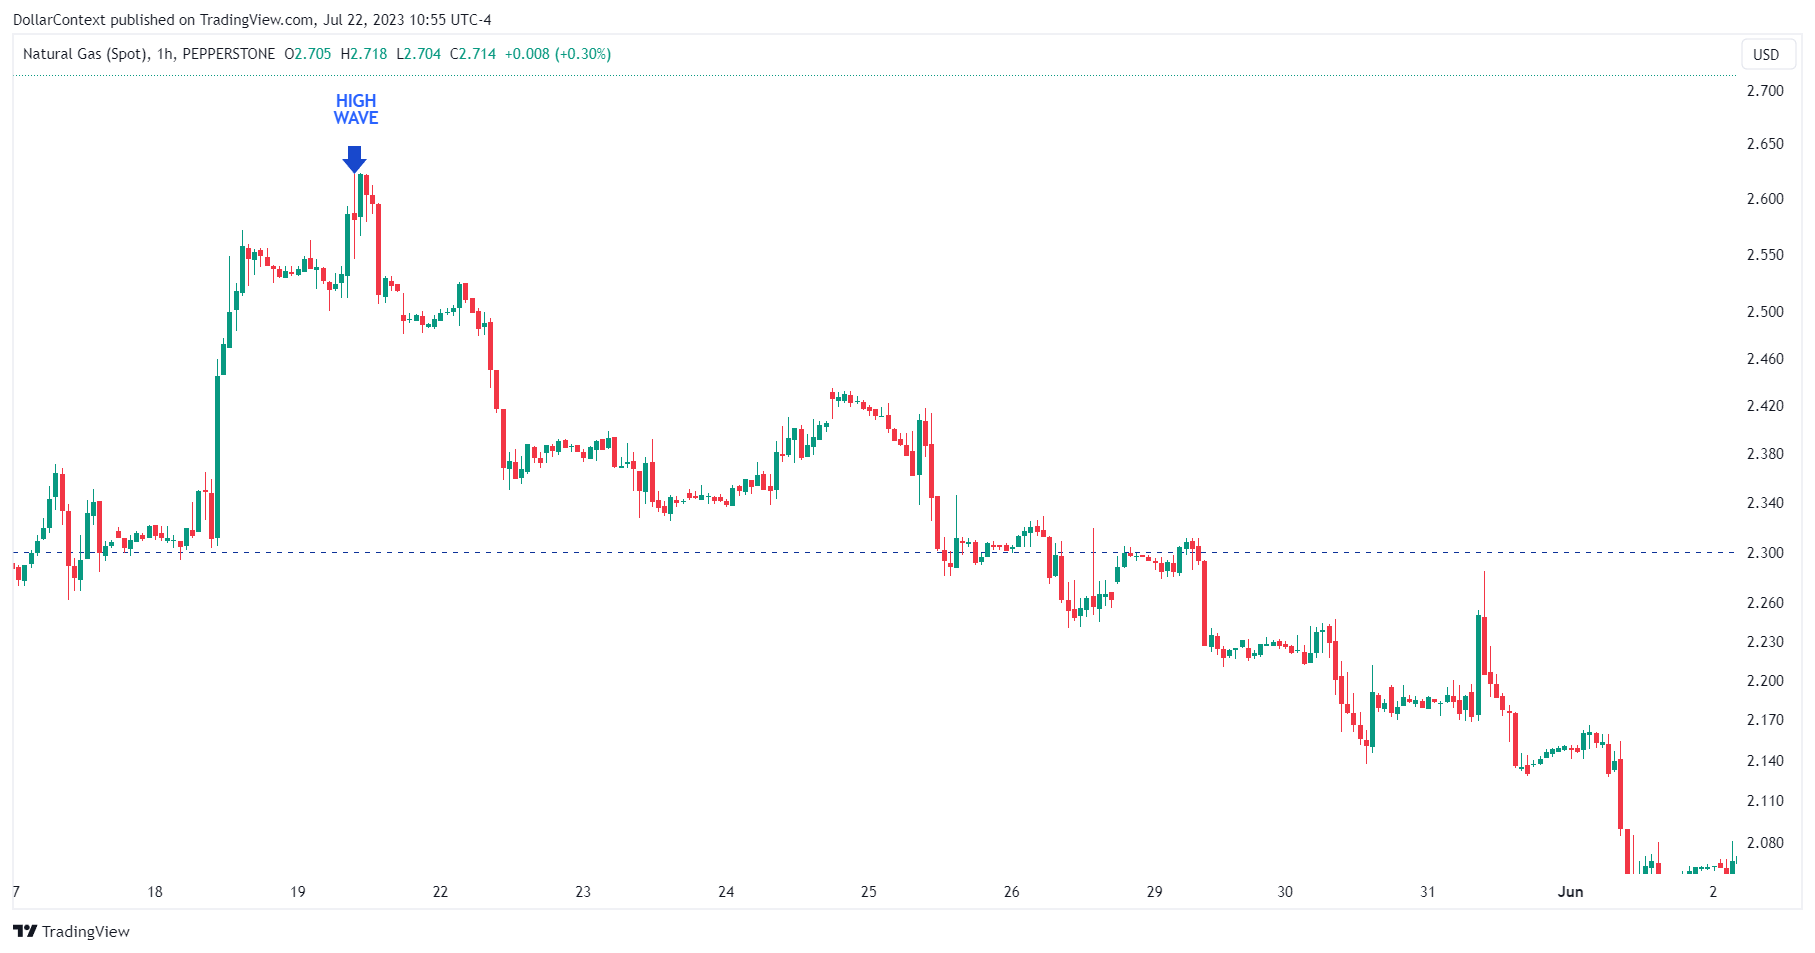
Natural Gas
The following exhibit of natural gas illustrates a significant decline following a distinct high-wave line that occurs after an upward movement. Observe how the green candle, subsequent to the high-wave, halts at the resistance level established by the highs of the high-wave candle.
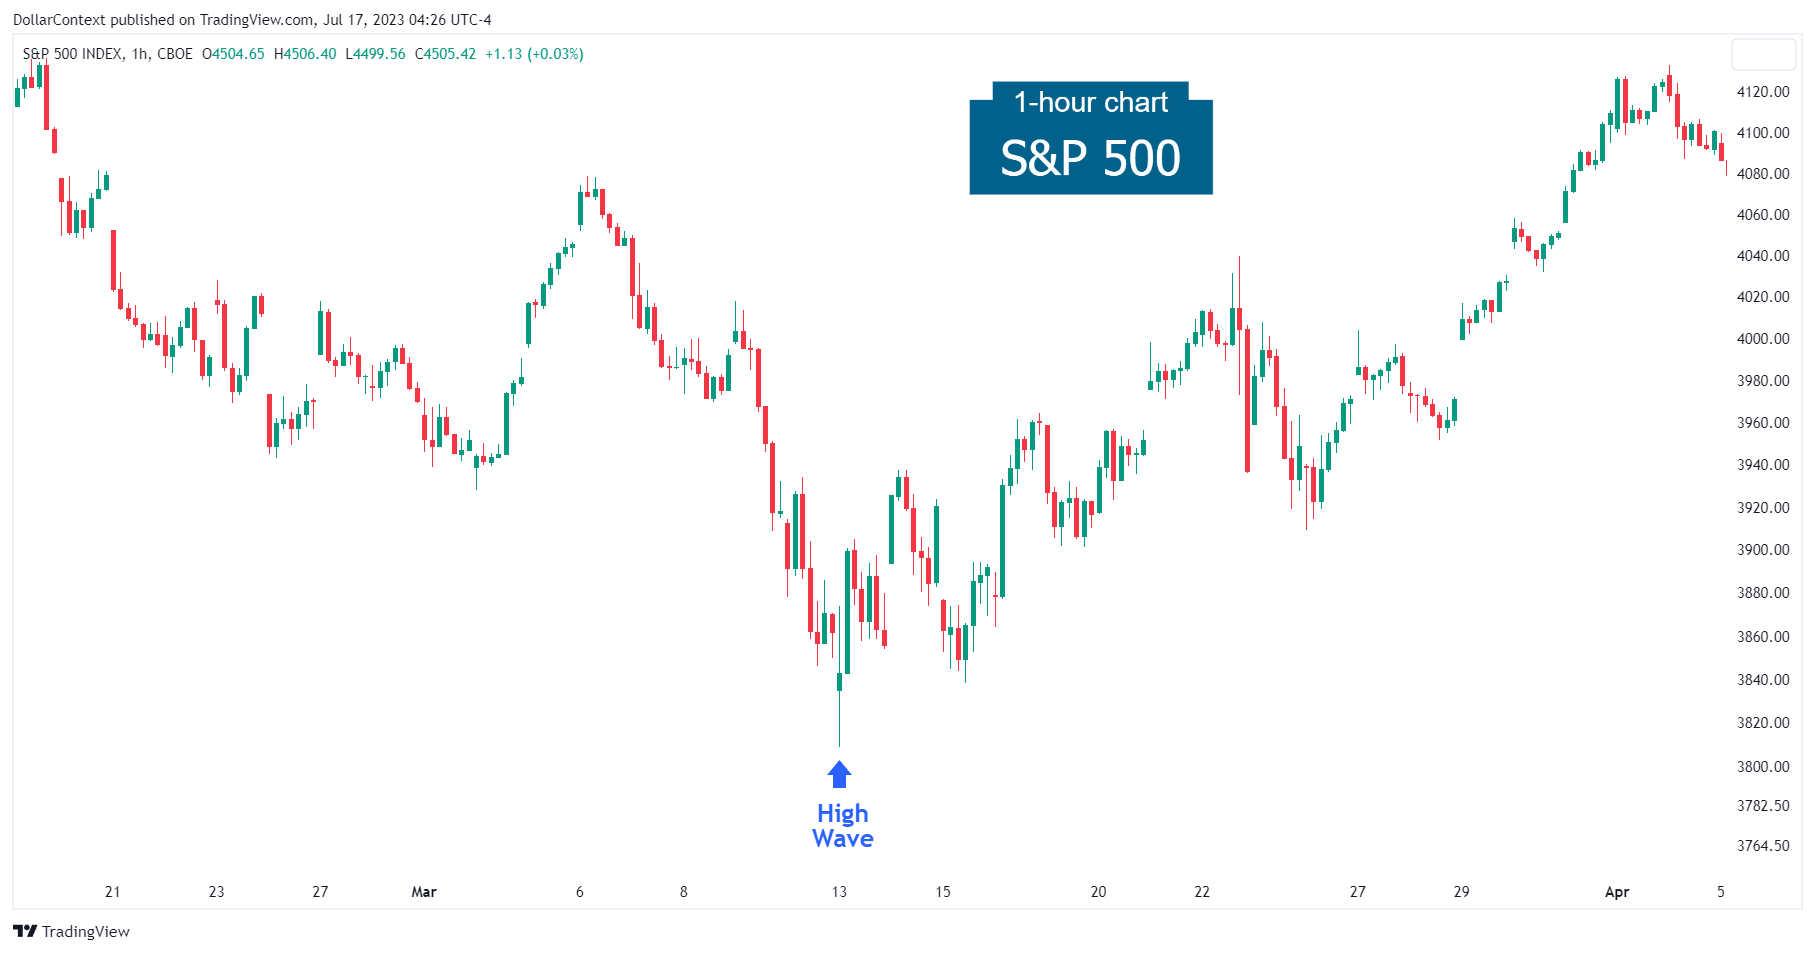
S&P 500
In this instance, you can observe a solid downtrend that concludes with the emergence of a high-wave candle. Note how the entire candle functions as support before the new uptrend gathers momentum.
7.4 More Examples (Case Studies)
- Case Study 0008: High-Wave and Engulfing Pattern at the Bottom of a Window (WTI)
- Case Study 0012: Small High-Wave After a Market Nosedive (DXY)
- Case Study 0017: High-Wave and Doji After a Tall Green Candle (AUD/USD)
- Case Study 0026: High-Wave and Tower Top in a Consolidation Phase (EUR/USD)