USD/JPY At A Critical Juncture
USD/JPY is testing a major weekly support after printing a long lower shadow. Is this a bullish retest or the start of a deeper dollar breakdown?
The Primary Signal: Long Lower Shadow At Major Support
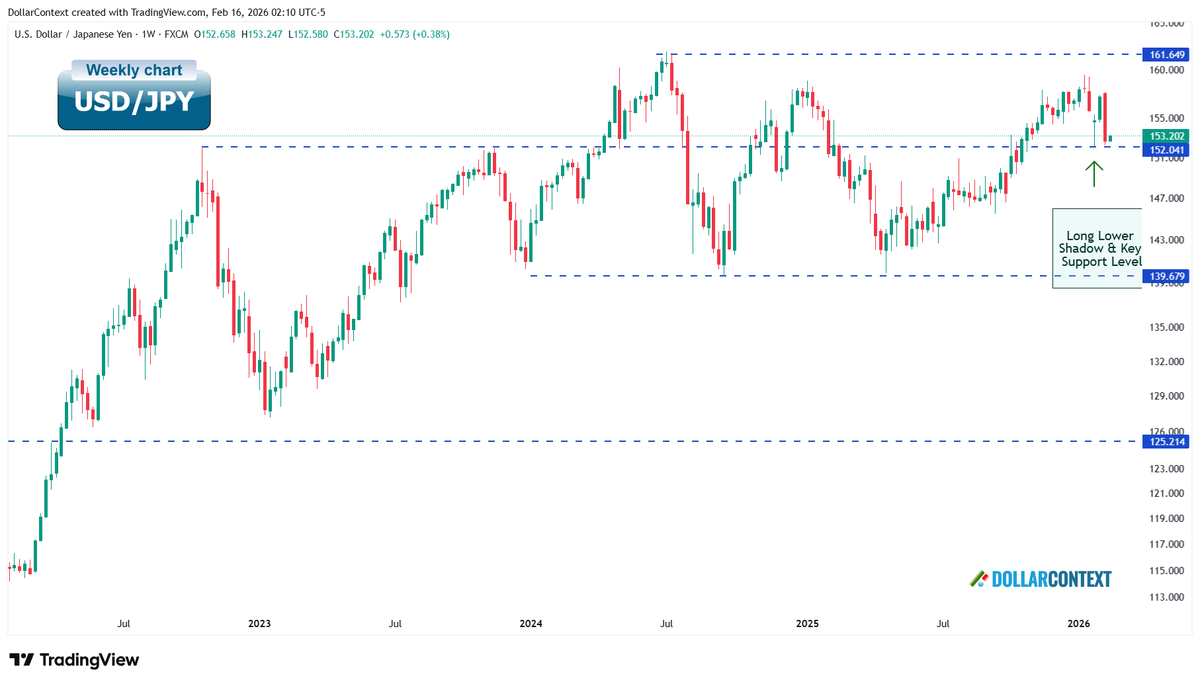
The most important pointThe USD/JPY USD/JPY is testing major weekly support this week, creating a moment of truth. The pair printed a long lower shadow at a key support zone — a level that previously acted as resistance. From a structural perspective, this remains the dominant signal.
Long lower shadows at major levels often reflect aggressive rejection of lower prices. As long as price holds above that zone, the base case remains constructive.
The challenge: A strong bearish follow-through
The subsequent weekly candle formed a large red real body, pushing price back toward the lows of that shadow. This is a serious test of the signal — but not yet an invalidation.
- If price stabilizes above that support, the long lower shadow remains active.
- If we see sustained acceptance below it, the bullish signal would likely fail.
Why this confusion is normal
Markets frequently retest major candlestick signals to their limit before a directional move materializes. These retests often shake out early positioning and create doubt — especially when volatility expands.
This dynamic is precisely why the pair sits at a critical juncture. The signal has not failed — but it is being stress-tested.
Short-Term Clue: Hourly Structure Suggests Possible Stabilization
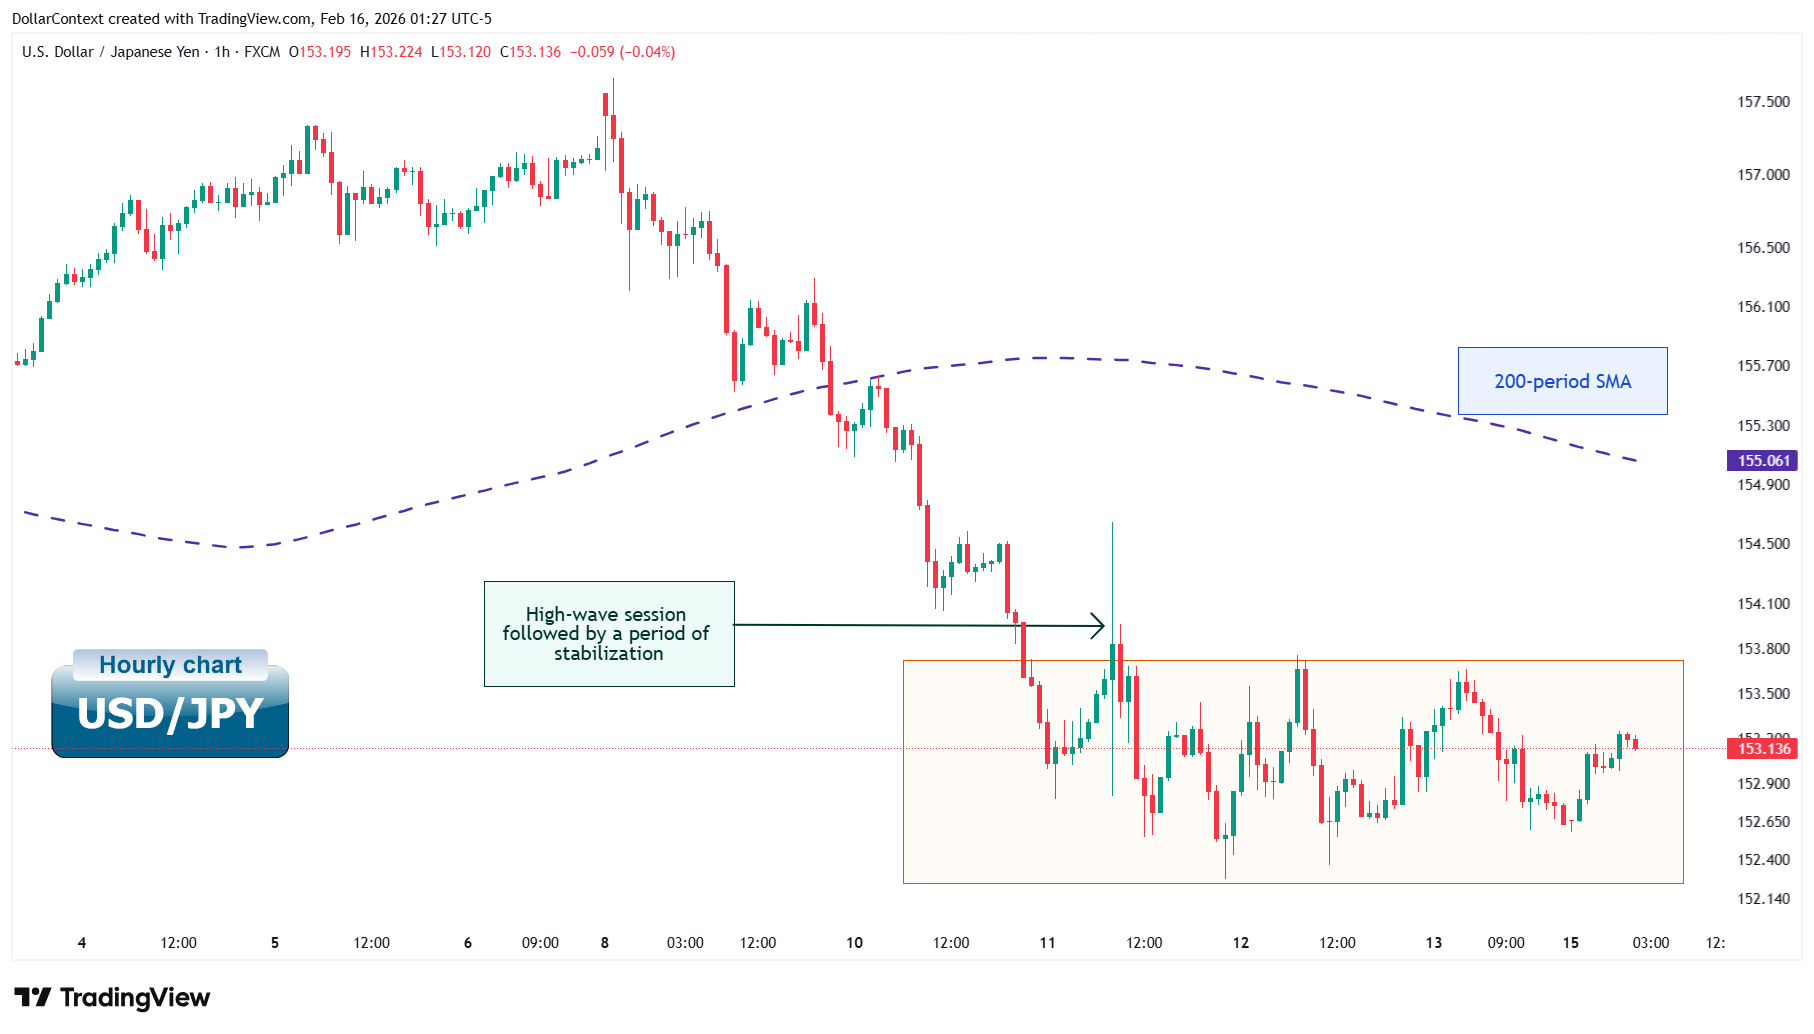
Complementary — not decisive
On the hourly timeframe, price became overextended relative to the 200-period SMA, printed a high-wave candle, and then transitioned into a stabilization phase.
If price reclaims short-term range highs, a mean reversion bounce could unfold from these levels.
Why this matters — and why it doesn’t
From a medium-term perspective, this is secondary. The weekly structure dominates.
However, for shorter-term participants looking for tactical entries with nearby stop-loss levels, this setup could be compatible with the broader bullish scenario — if support continues to hold.
Key Level: 152
- Above 152: Recovery attempts remain viable.
- Below 152 with follow-through: The weekly bullish signal risks invalidation.
Complementary Confirmation: Dollar Index Holding Support
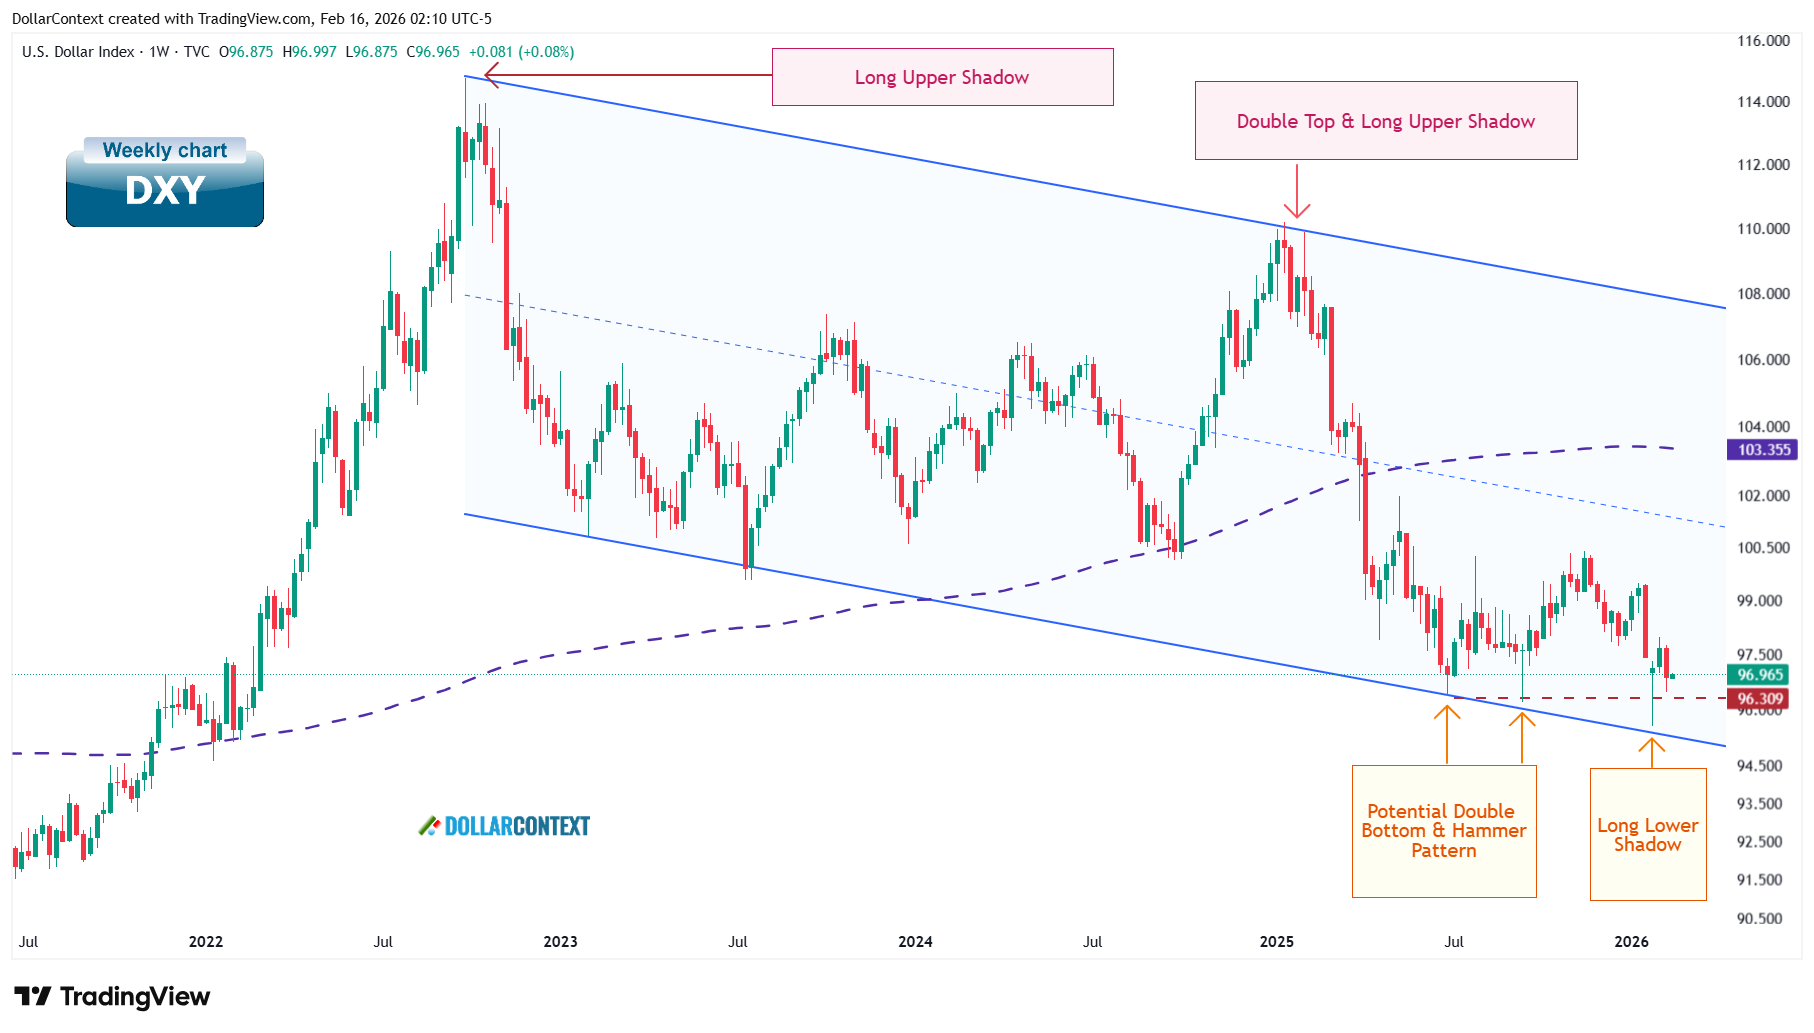
The U.S. Dollar Index also printed a long lower shadow at the lower boundary of its descending channel.
This is not the main driver of the thesis — the post is about USD/JPY — but it is directionally compatible with the bullish interpretation above.
If the dollar index holds and rebounds, it would reinforce the probability that USD/JPY’s weekly support holds. If the index breaks down decisively, that would increase pressure on the pair.
Why This Resolution Could Matter Beyond FX
The outcome of this debate may extend well beyond one currency pair.
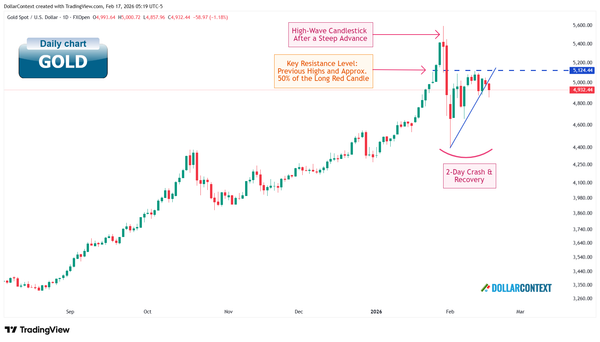
- A sustained dollar rebound could pressure Gold and commodities.
- A confirmed dollar breakdown could support metals and potentially influence 10-year Treasury yields.
- Cross-asset volatility could increase as positioning adjusts.
Under current macro conditions, where rate differentials and inflation expectations remain fluid, FX inflection points tend to ripple across markets.
Bottom Line
The long lower shadow at major support remains the dominant signal. Until that level is decisively broken, the most likely scenario leans constructive.
The large bearish weekly candle is a stress test — not yet a failure.
If support survives this pressure phase, the move higher could be forceful. If it gives way with sustained downside acceptance, the technical landscape would shift materially.
This is a classic moment where the market tests conviction before revealing direction.
This analysis reflects market conditions and information available at the time of publication. It is provided for informational and educational purposes only and does not constitute financial, investment, or legal advice.
The financial markets are inherently volatile, and past performance is never a guarantee of future results. Readers should conduct their own independent research or consult with a licensed professional before making any investment decisions. Any actions taken based on the content of this report are at the sole discretion and risk of the reader, and the author assumes no liability for any potential losses or damages.