Case Study 0014: Shooting Star and Dark Cloud Cover at a Major Resistance Level (Natural Gas)
In this article, we will discuss the performance of natural gas prices after the emergence of a shooting star and a dark cloud cover.
This case study examines a historical market setup observed in natural gas in July 2022. It is intended for educational purposes and illustrates how specific candlestick patterns behaved in real market conditions.
Case Study Data Sheet (Historical)
- Reference: CS0014
- Security: Natural Gas
- Timeframe: Daily Chart (July 26, 2022)
- Patterns:
1. Signal Formation
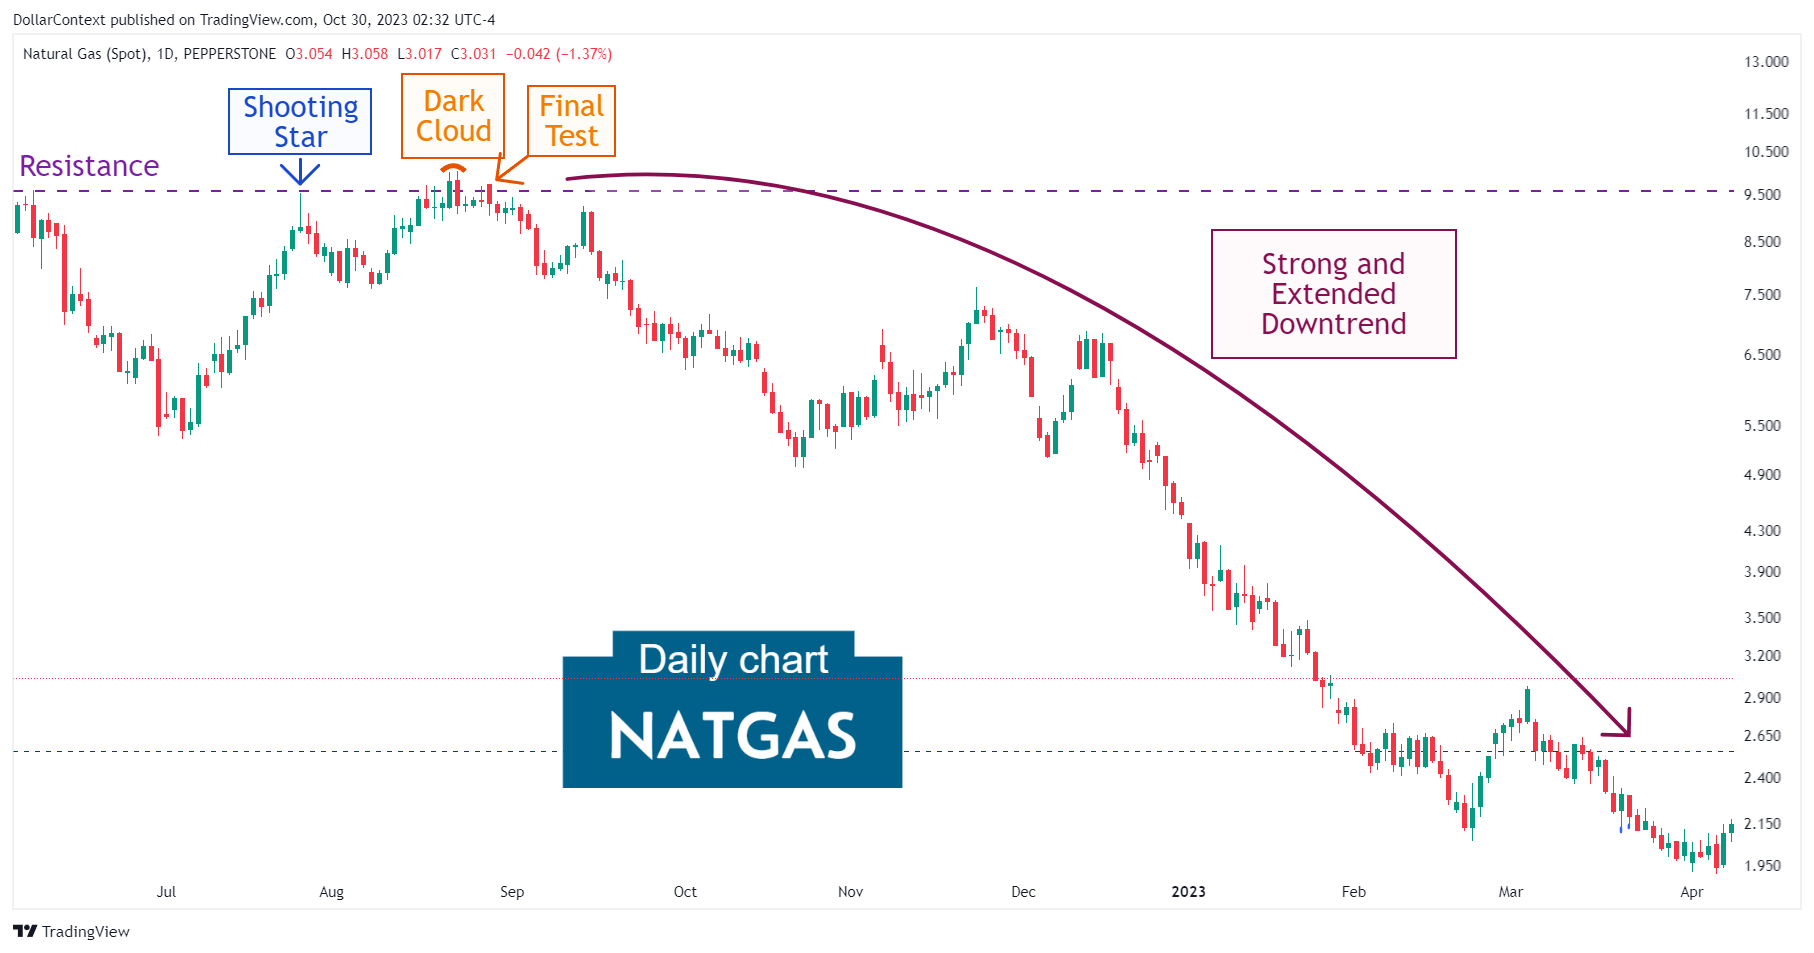
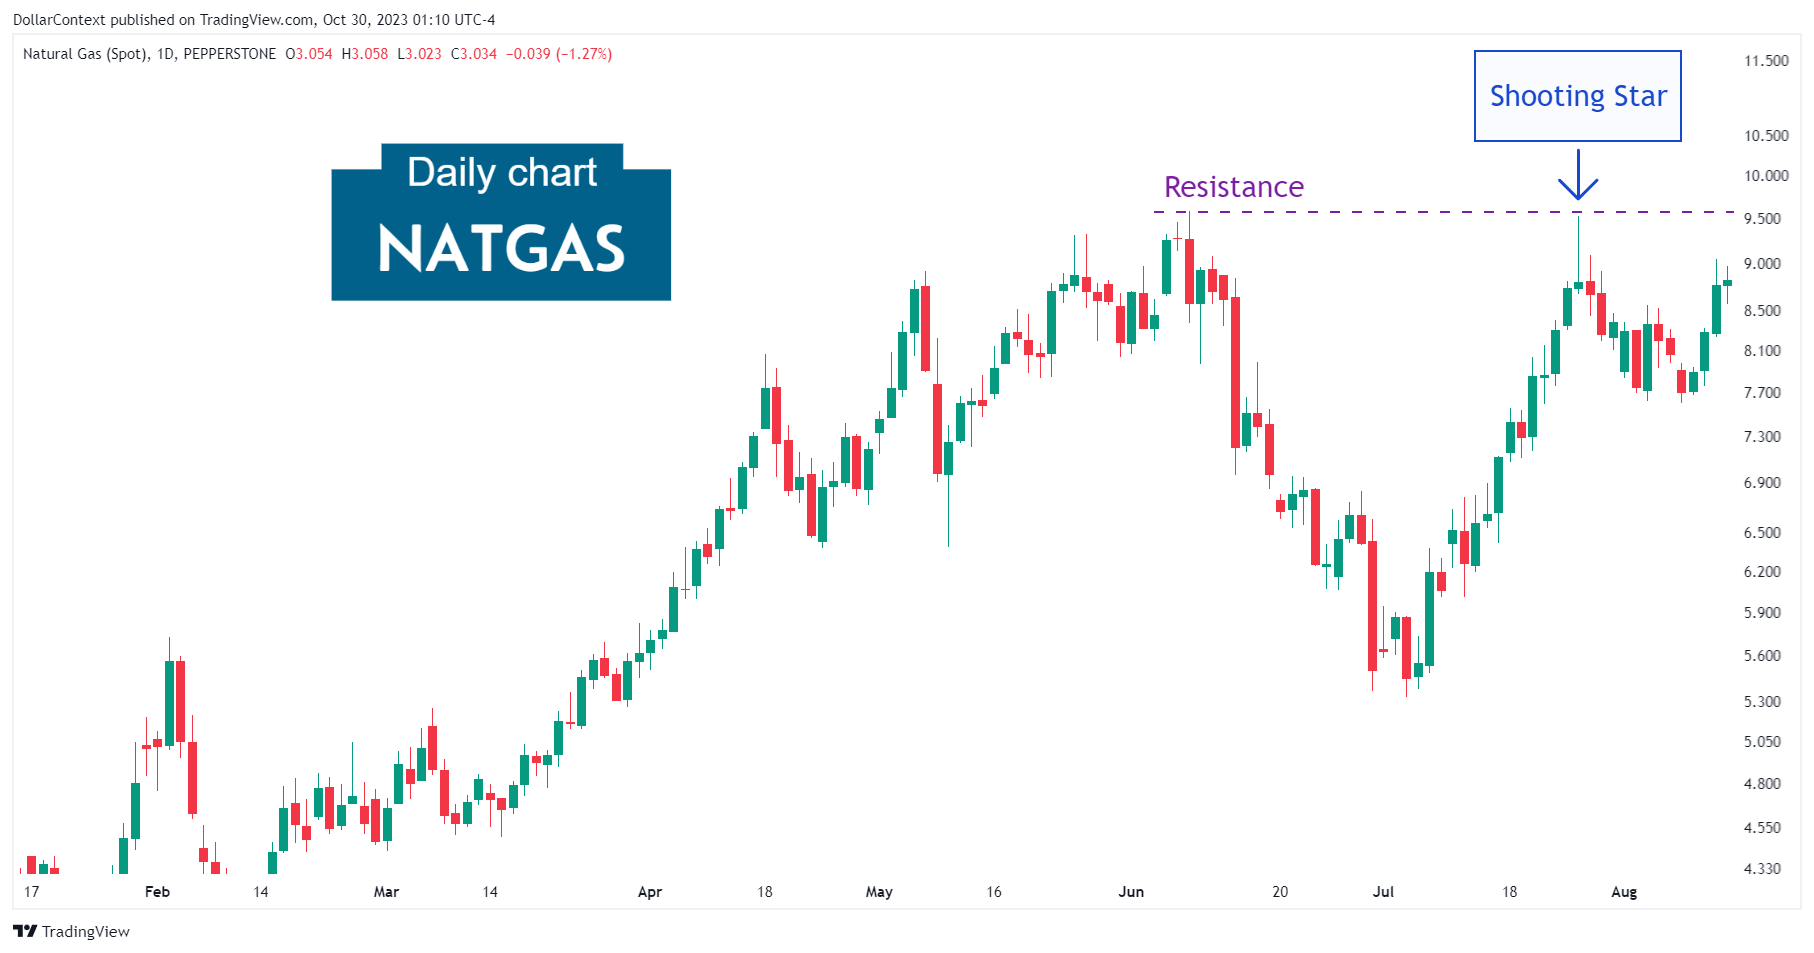
On July 26, 2022, the natural gas market displayed a shooting star pattern at a key resistance level. Note the almost perfect long upper shadow of this candle and the small real body near the bottom end of the trading range.
The long upper shadow of the line reflected the heaviness of supply towards the 9.50 mark.
2. Early Market Transition
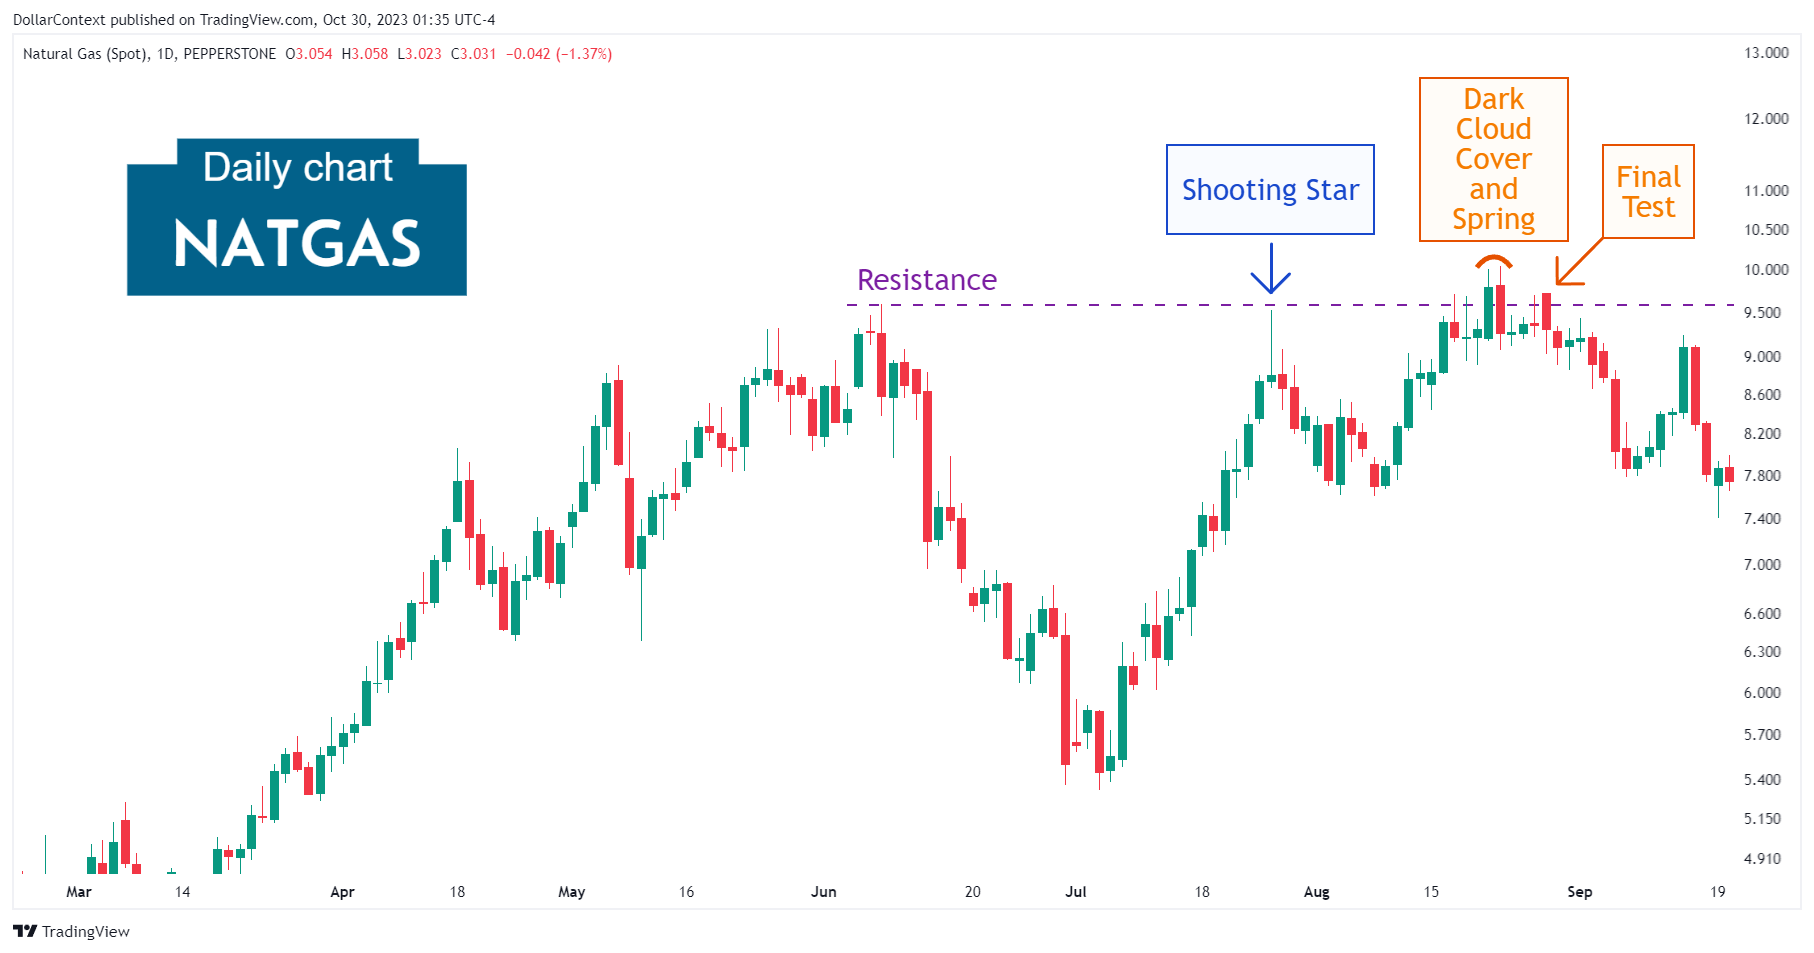
Following a minor pullback, the market rebounded in an attempt to set a new high. However, after momentarily breaking through the resistance level, the market swiftly reversed course, culminating in the formation of a dark cloud cover pattern.
In this case, the dark cloud cover also served as an upthrust (false breakout from the resistance level).
3. Resolution
After an additional test of the resistance zone, natural gas prices experienced a strong and extended decline until April 2023, when a prolonged stabilization period—not shown in the chart below—began.

4. Conclusion and Retrospective Assessment
This example illustrates a classic scenario where a major candlestick pattern, like the shooting star, at a major resistance level increases the likelihood of a top reversal. This conjuncture was further reinforced by the appearance of a dark cloud cover, which was also an upthrust.