Case Study 0023: Dark Cloud Cover and Spinning Tops (Natural Gas)
In this article, we will examine the performance of the natural gas market after the emergence of a dark cloud cover and a long black real body.
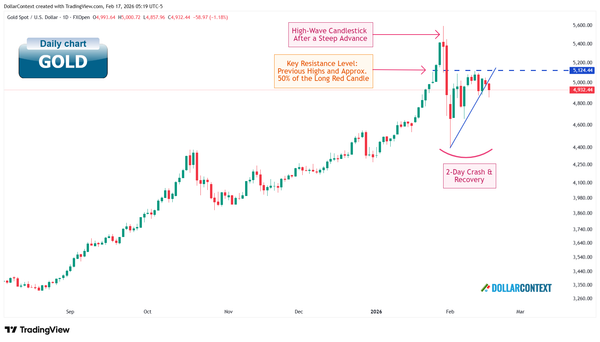
This case study examines a historical market setup observed in Natural Gas in October 2023. It is intended for educational purposes and illustrates how specific candlestick patterns behaved in real market conditions.
Case Study Data Sheet (Historical)
- Reference: CS0023
- Security: Natural Gas
- Timeframe: Hourly Chart (October 31, 2023)
-
Patterns:
- Dark Cloud Cover (variation)
- Long Red Real Body
- Upthrust
- Spinning Tops
1. Signal Formation
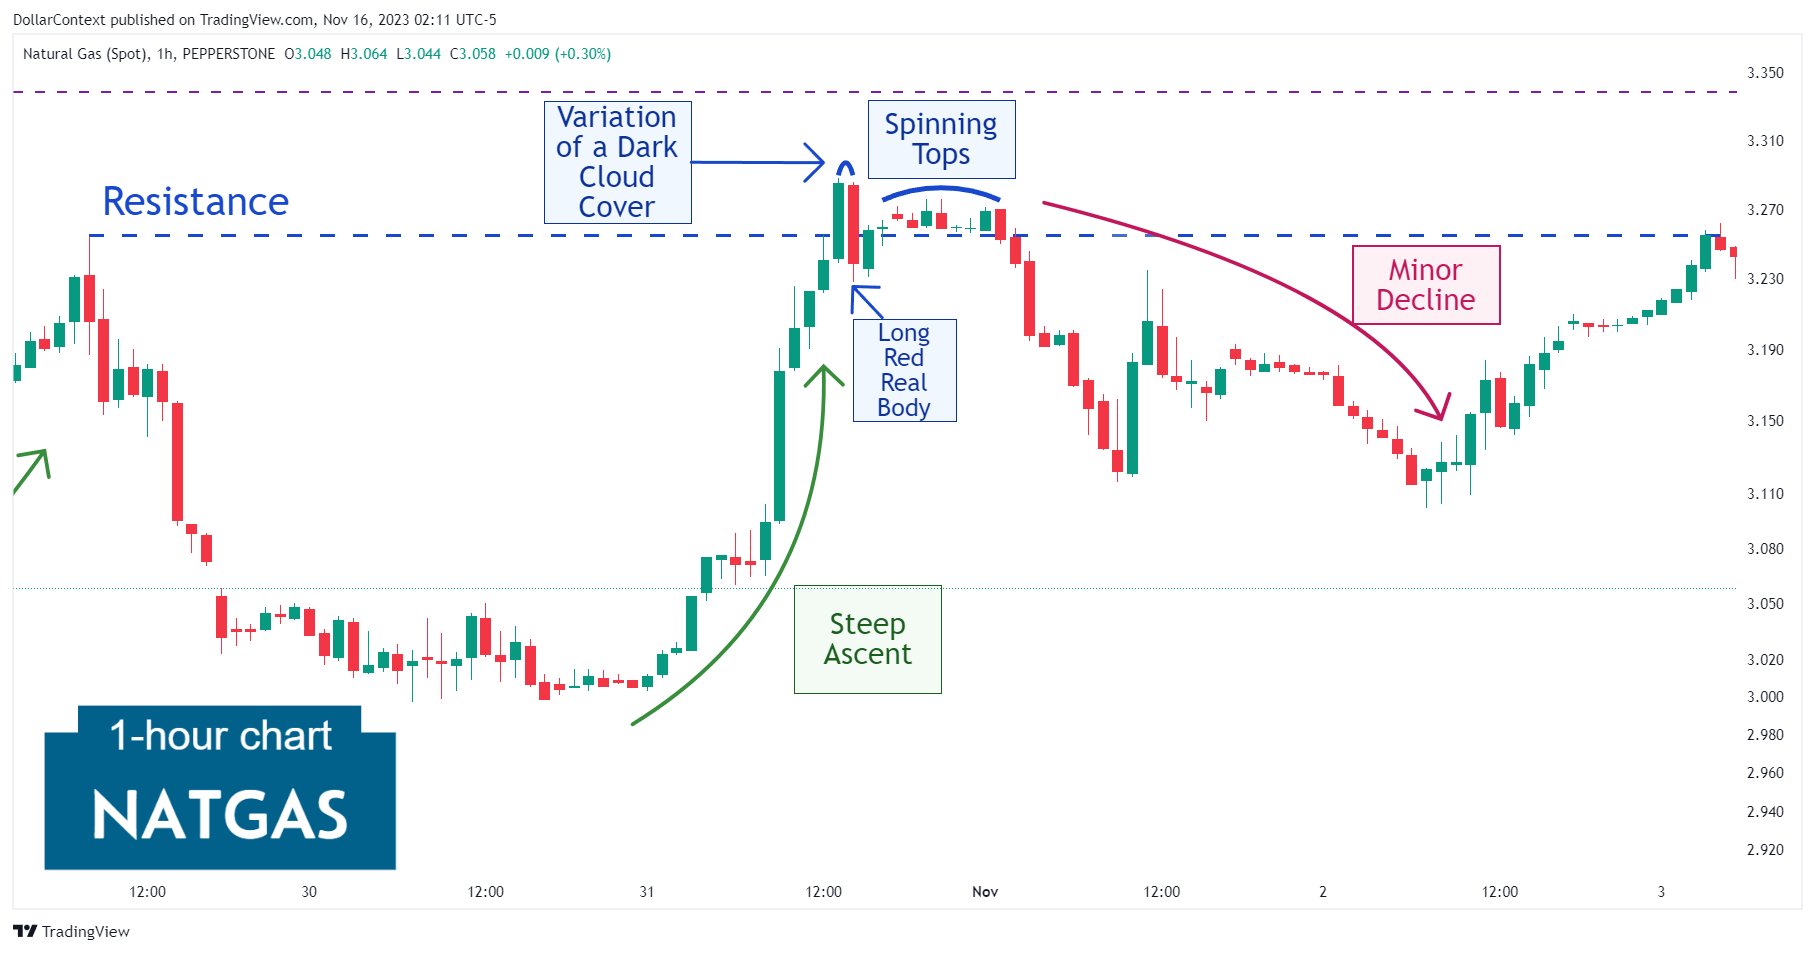
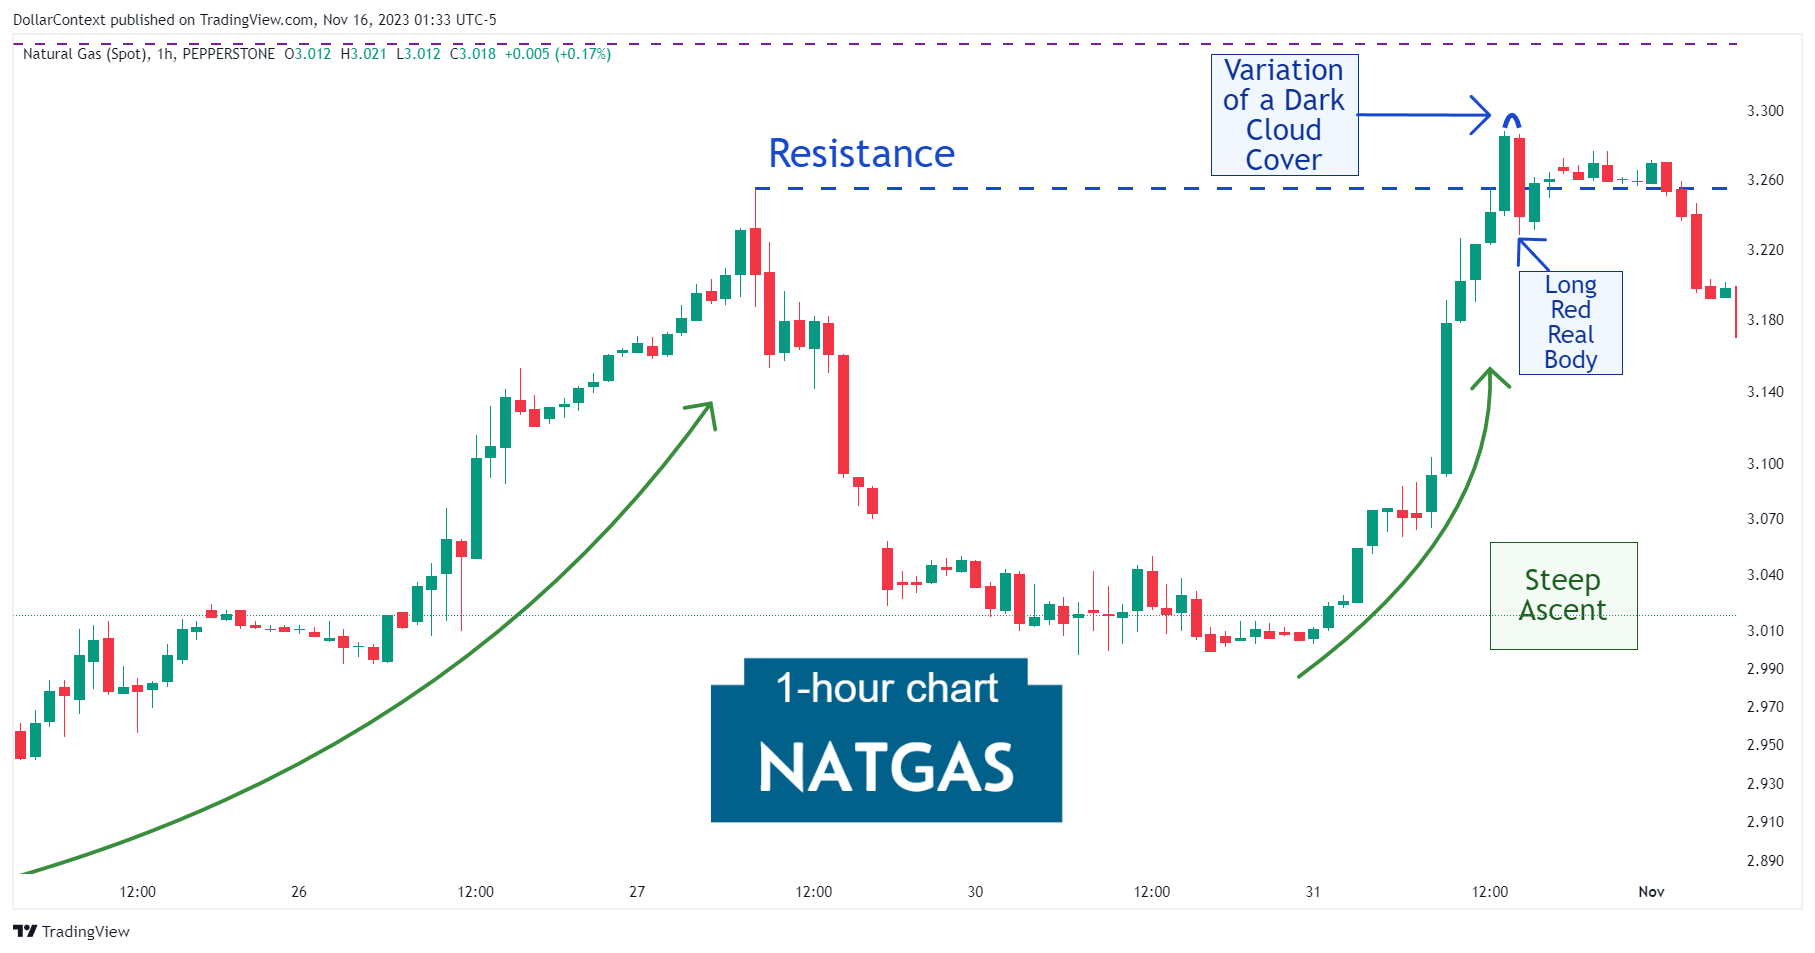
Following a vertical ascent, the natural gas market displayed a variation of the dark cloud cover pattern. Because the closing price of the second session exceeds the lows of the first candle, this formation should be considered a variation of this pattern.
Another important aspect of the dark cloud cover is the fact that this pattern was also an upthrust (false breakout to the upside).
We'll add here that the second candle of the dark cloud cover can also be viewed as a long red real body at a high price area.
2. Early Market Transition
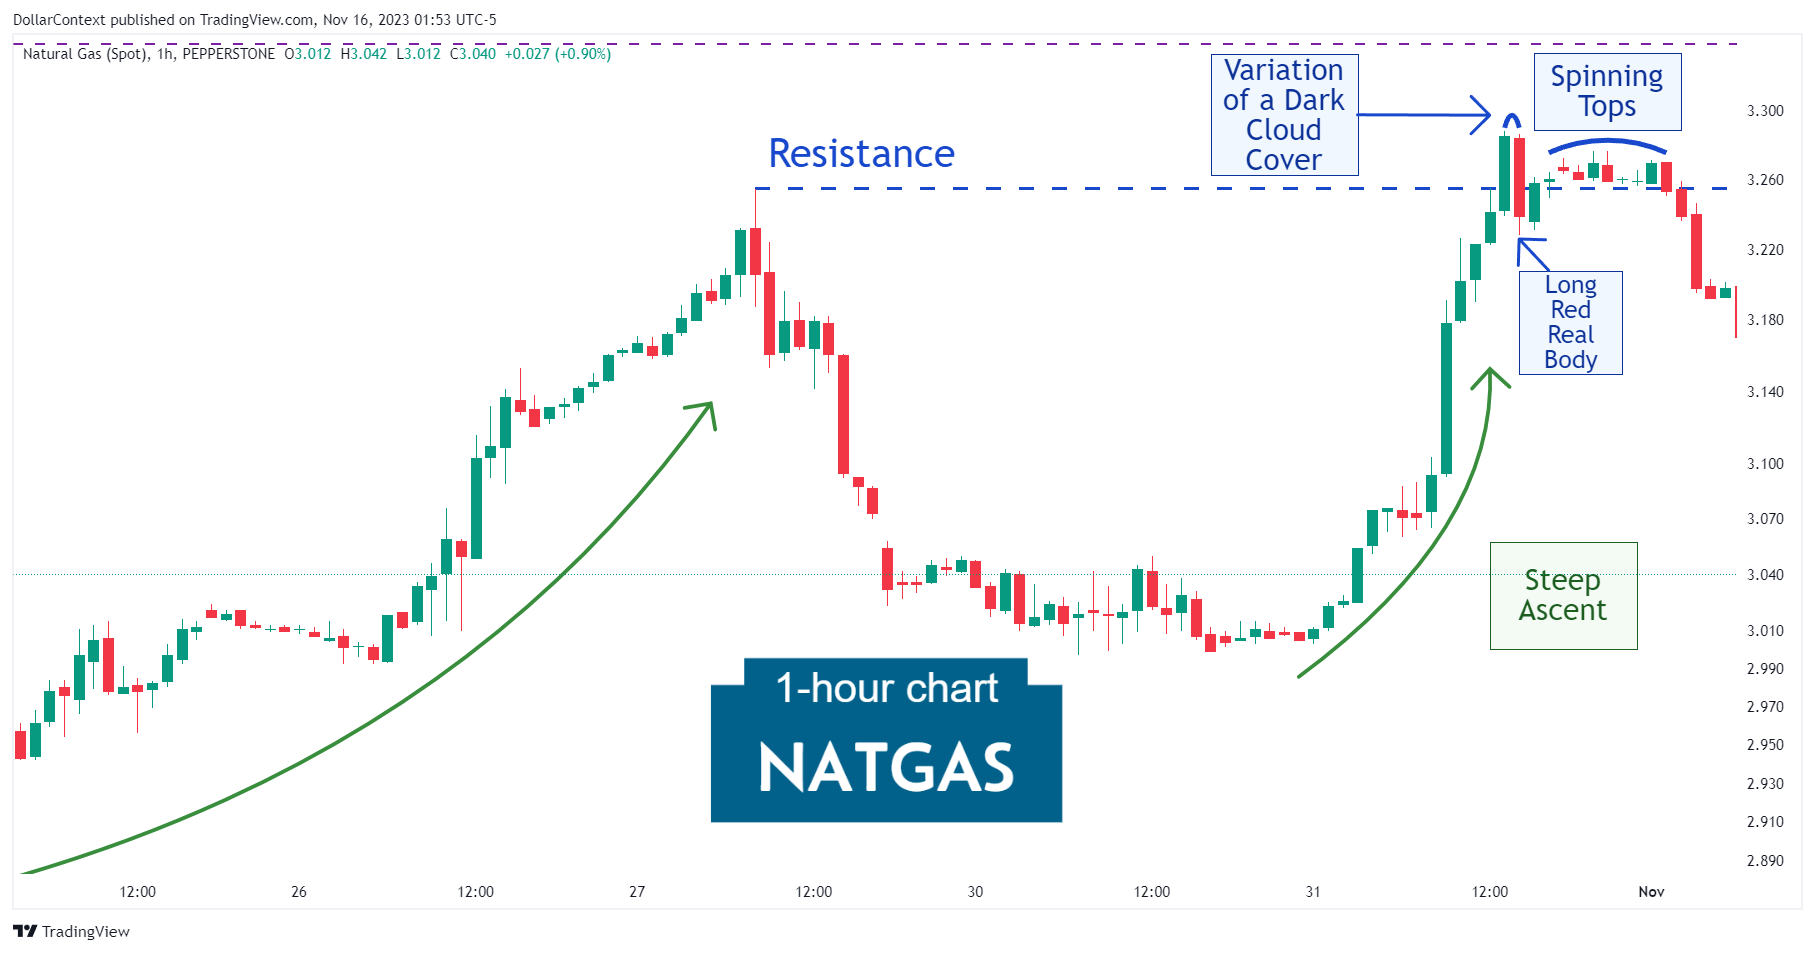
Typically, a long black/red real body acts as resistance. The following image illustrates how prices, attempting to rise, were halted near the 50% mark of the previous red body, as evidenced by the formation of a series of spinning tops near this level.
3. Resolution
Observe how the combination of patterns described earlier led to a slight downturn.

4. Conclusion and Retrospective Assessment
While the confluence of a series of bearish patterns in a relatively short timeframe warrants serious consideration as an indicator of caution, they do not always predict a major downtrend. A scenario like may be simply followed by a minor reversal in price and time.