S&P 500 Deep Dive: Structural Inflation, Tactical Patience, and the Market’s Next Test (January 2026 Analysis)
The S&P 500 is navigating structural inflation with policy patience rather than urgency. What that means for market psychology, trend durability, and the levels that actually matter is less obvious than it seems.
📊 DEEP DIVE ARCHIVE | Published: January 1, 2026
This is a comprehensive analysis from January 2026. For our current view on the S&P 500:
→ S&P 500 Comprehensive Review
This archive piece remains valuable as a detailed framework reference and historical snapshot.
Rather than forecasting outcomes, this post evaluates whether current market behavior remains consistent with the prevailing macro, psychological, and structural regime.
• Inflation is structurally higher than the pre-2020 norm
• Monetary policy prioritizes risk management over suppression
• Fiscal dynamics constrain extreme rate and currency outcomes
Executive Summary
-
🧭 Macro regime:
Structural inflation remains in place, but policy is characterized by tactical patience rather than renewed tightening, creating a supportive—but increasingly selective—backdrop for equities -
🧠 Positioning & psychology:
Investor sentiment reflects skepticism without capitulation—AI enthusiasm has cooled, headline risks persist, yet positioning remains flexible rather than defensive. -
📈 Technical structure:
Higher-timeframe charts show the primary uptrend intact, with recent volatility resolving as consolidation rather than distribution. -
⚖️ Valuation dynamics:
With structurally higher inflation, multiple expansion is capped, shifting index upside toward earnings durability, pricing power, and sector leadership. -
🔎 What matters next:
The S&P 500’s next decisive move hinges on whether consolidation resolves with trend continuation or structural failure, defined by clearly identifiable structural support zones.
1. Macro Setup: Structural Inflation, Tactical Patience
1.1 Federal Reserve: Dovish Lean, Not Dovish Conviction
- The Federal Reserve currently exhibits a dovish lean, but not a unified dovish stance.
- A dovish-leaning Fed Chair nomination process is widely expected in early 2026, reinforcing expectations of policy patience rather than urgency.
- Apparent labor-market softening may be demographic rather than cyclical:
- Aging workforce
- Lower net immigration flows
- Despite modest increases, unemployment remains historically low, suggesting labor tightness has not fully dissipated.
- For now, the Fed appears to place greater weight on perceived labor cooling than on persistently elevated inflation prints when justifying its stance.
S&P 500 implication:
Policy inertia reduces tail risk from aggressive tightening, providing a supportive macro backdrop for equities, even if it does not yet justify aggressive multiple expansion.
1.2 Short-Horizon Inflation: Elevated, Sticky, and Politically Tolerated
(Short-horizon ≠ temporary — this section addresses the Fed’s policy window, not the ultimate inflation regime.)
- Inflation remains above pre-2020 norms, but is no longer accelerating sharply.
- The Fed’s current reaction function suggests greater tolerance for inflation modestly above 2%, provided:
- Expectations remain anchored
- Financial conditions stay orderly
- This represents a shift from precision targeting toward range-based tolerance.
Why tightening still occurred in 2022–2023
- Inflation surged rapidly (~2% → ~9%)
- Secondary risks emerged:
- Demand amplification from fiscal stimulus
- Wage–price spiral concerns
- Central-bank credibility risk
What is different now
- Inflation is sticky but stable
- Expectations are better anchored
- Fiscal impulse is smaller
- The credibility crisis has passed
S&P 500 implication:
A higher inflation “floor” limits valuation upside, but policy tolerance reduces downside volatility, favoring trend persistence over abrupt repricing.
1.3 Long-Term Inflation Cycle: A Post-2020 Regime Shift
Beyond near-term policy tolerance, the longer-term inflation regime may have structurally changed since 2020.
-
Post-COVID structural break
- The pandemic likely marked a larger regime shift than 2008:
- End of the 40-year disinflation trend
- End of the secular bond bull market
- A return to the pre-2019 macro environment appears unlikely.
- The pandemic likely marked a larger regime shift than 2008:
-
Persistent inflation reality
- Inflation has remained elevated for ~5 years.
- Repeated forecasts of a clean return to 2% have failed.
-
Rates implication
- 10-year Treasury yields likely remain structurally higher:
- ~0% (2020) → ~5% (2023) → consolidating near ~4%
- This appears more like a pause than a reversal.
- 10-year Treasury yields likely remain structurally higher:
-
Equity implication
- Multiple expansion becomes harder to sustain.
- Earnings durability, pricing power, and narrative leadership matter more.
Long-cycle context (asset rotation framework):
Historically, major macro transitions often unfold through a broad asset-rotation sequence — crisis → gold and commodities → equities → financial assets. In this framework, sustained strength in commodities and real assets typically precedes a more durable equity advance, as growth, pricing power, and nominal revenues improve. The current environment — marked by multi-year commodity strength and resilient earnings — is consistent with the middle phase of this cycle, where equities can continue to perform even as inflation remains structurally higher, before excess eventually migrates toward leverage-heavy financial assets.
Historically, major macro transitions often unfold through a broad asset-rotation sequence — crisis → gold and commodities → equities → financial assets. Sustained strength in commodities typically precedes durable equity advances, as pricing power and nominal growth improve. The current environment aligns with the middle phase of this cycle, where equities can perform despite structurally higher inflation.
Valuation implication for the S&P 500:
In a structurally higher inflation environment, future earnings are discounted more aggressively, which caps P/E expansion; as a result, index upside depends less on multiple re-rating and more on durable earnings growth, pricing power, and sector leadership.
1.4 Fiscal Policy: A Structural Constraint on Monetary Policy
Fiscal dynamics increasingly shape the boundary conditions for monetary policy, even without explicit coordination.
-
Shift in the policy mix
- Monetary easing alone is less effective (“pushing on a string”).
- Growth increasingly depends on:
- Industrial policy
- Defense spending
- Energy and infrastructure investment
-
Debt management as a policy lever
- Treasury issuance strategy matters:
- Greater reliance on bills
- Active maturity management
- Implicit yield-curve smoothing
- Treasury issuance strategy matters:
-
Soft fiscal dominance
- No formal pressure on the Fed, but:
- Large deficits + high rates raise political costs
- Sustained restrictive policy becomes harder to maintain
- No formal pressure on the Fed, but:
-
Resulting dynamic
- Implicit coordination emerges:
- Slightly higher front-end yields
- Contained long-end term premium
- Net easing bias over time
- Implicit coordination emerges:
S&P 500 implication:
Fiscal-monetary interaction reduces long-rate shock risk, supporting equity valuations through rate stability rather than rate cuts.
1.5 Growth Backdrop: Momentum with Emerging Friction
Recent data complicates the “slowing growth” narrative.
-
Recent strength
- U.S. GDP expanded at a 4.3% annualized pace in Q3 2025, the fastest in roughly two years.
-
Underlying frictions
- Slower employment growth
- More cautious consumers
- Inflation remains persistent
-
Timing caveat
- Macro data arrives with lags
- Early-2026 revisions may soften the picture
S&P 500 implication:
Growth momentum supports earnings in the near term, but markets may increasingly discount sustainability rather than headline strength.
Macro Bottom Line for the S&P 500
The current regime favors policy patience, rate stability, and selective equity leadership. The environment supports continued equity participation, but with diminishing tolerance for weak fundamentals or valuation excess.
2. Market Positioning & Psychology: Skepticism Without Capitulation
Taken together, these indicators suggest a market that is questioning narratives and trimming excess optimism — without withdrawing liquidity or abandoning risk.
2.1 AI Optimism Is Cracking — But Not Breaking
Investor psychology around AI has shifted from euphoria to scrutiny, particularly around valuations, funding needs, and capital intensity.
- Concerns have emerged about stretched valuations among leading AI beneficiaries.
- High-profile cases — such as Oracle’s difficulty securing capital for data-center expansion — have raised questions about:
- Rising debt burdens
- Cash-flow sustainability
- Whether headline AI contracts (e.g., OpenAI-related exposure) will translate into durable profitability
This has fueled narratives of a potential AI bubble unwind, contributing to a more cautious tone in equity markets.
Counterevidence: skepticism, not excess
-
Post-correction valuations no longer resemble late-1990s conditions:
- The speculative froth typical of bubble peaks is absent.
- Commercial adoption and revenue visibility are materially stronger than during the dot-com era.
-
Broad market valuation context:
- The equal-weight S&P 500 trades near ~17× earnings, lower than five years ago.
- Despite AI leadership, the broader market has de-rated due to repeated macro shocks (pandemic, inflation surge, historic rate hikes).
-
Credit markets remain open:
- Outside of idiosyncratic cases like Oracle, capital remains available.
- Credit spreads suggest selective risk pricing, not systemic stress.
Market psychology implication for the S&P 500:
AI skepticism is acting as a pressure-release valve, cooling expectations without triggering broad de-risking. This supports consolidation rather than a regime-ending unwind.
2.2 Headline Risk Is Rising — But So Is Investor Immunity
Market sentiment faces multiple overlapping uncertainty catalysts in the months ahead:
- Potential reversals or legal challenges to Trump-era tariff policies
- Risk of an extended government shutdown
- A potentially contentious Fed Chair nomination and confirmation process, likely spanning several months
- Sensitivity to further labor-market weakening, especially if policy response lags expectations
These factors raise the probability of short-term volatility spikes in sentiment and positioning.
Why this hasn’t translated into panic
- Markets continue to climb a persistent wall of worry.
- Investor caution appears functional rather than fragile:
- Concerns are acknowledged
- Positioning remains flexible
- Leverage is not extreme
- Historically, dangerous market tops form during complacency, not during active debate and skepticism.
Positioning implication for the S&P 500:
Elevated headline risk may amplify volatility, but the absence of complacency suggests pullbacks are more likely to be corrective than structural.
2.3 Dollar Softening Bias: A Quiet Tailwind for Risk Assets
A growing consensus points toward structural softness in the U.S. dollar, shaping global capital flows and risk appetite.
Key psychological drivers include:
- Persistent fiscal deficits, reinforcing long-term concerns about U.S. balance-sheet sustainability
- Lingering geopolitical effects of asset freezes and sanctions, which may have altered reserve preferences among large foreign holders (e.g., China and other non-aligned economies)
- Gradual diversification away from dollar-heavy reserve allocations
While the dollar remains dominant, sentiment has shifted from strength to skepticism.
Cross-asset psychology implication for the S&P 500:
- International earnings translation
- Commodity-linked sectors
- Global risk appetite
This reinforces equity resilience, particularly for multinational and pricing-power-heavy components of the index.
Market Positioning Bottom Line for the S&P 500
Current positioning reflects healthy skepticism, not fear. Investors are questioning narratives, trimming excess optimism, and reacting to headline risk — but without capitulation or systemic de-risking. This psychological backdrop amplifies macro stability rather than undermining it, favoring consolidation, selective leadership, and trend persistence over abrupt reversals.
3. Technical Structure & Candlestick Evidence
Trend Integrity Across Monthly and Weekly Timeframes
While positioning and sentiment point to skepticism without capitulation, higher-timeframe price structure provides the objective test: whether that skepticism is resolving into distribution — or simply into consolidation within a broader uptrend.
3.1 Monthly Chart — Primary Trend Remains Intact
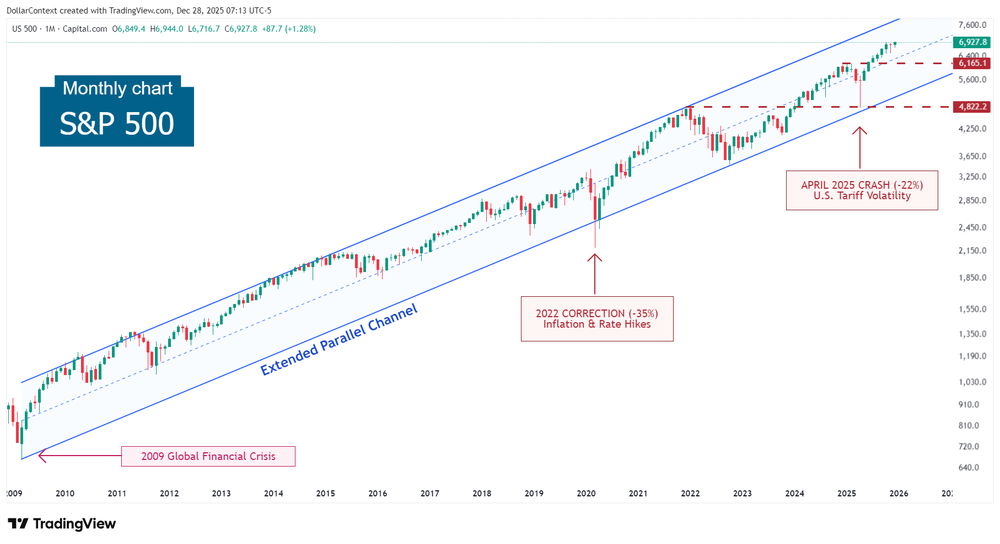
On a monthly logarithmic chart, the S&P 500 cash index has traded within a rising parallel channel since 2009:
- Upper boundary: connects major bull market peaks
-
Lower boundary: connects crisis lows:
-
Major crisis lows:
- March 2009 (Global Financial Crisis)
- March 2020 (COVID-19 crash)
-
Policy-driven drawdowns:
- September 2022 (inflation and rate shock)
- April 2025 (tariff-driven volatility)
-
Major crisis lows:
- Midline: acts as mean-reversion during corrections
This channel structure reflects a secular bull market regime with expanding price levels.
Notably, the April 2025 crash found support at January 2022's peak. Currently, price is consolidating near the upper quartile of the channel range, measured from the lower boundary.
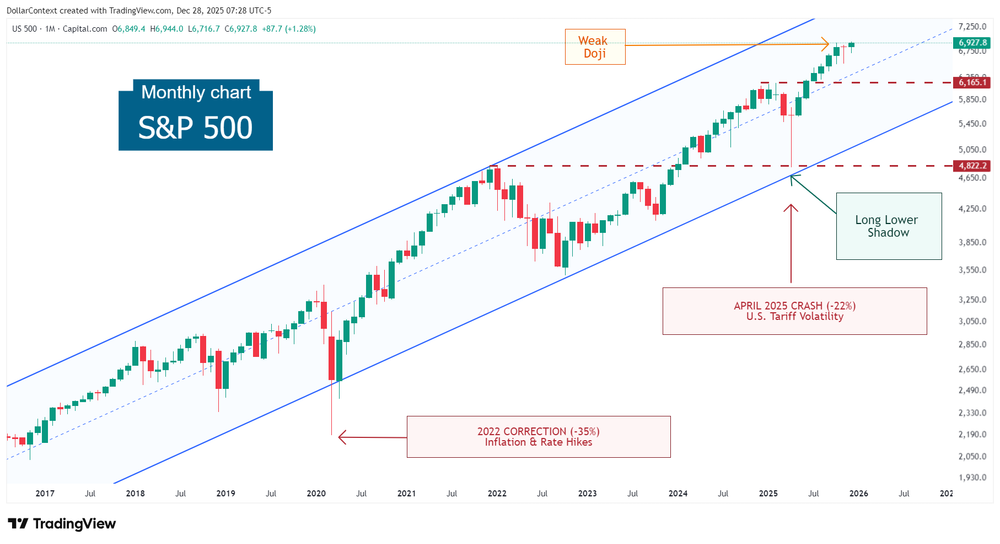
From a candlestick perspective, the long lower shadow in April 2025 confirmed strong support at the confluence of:
- The January 2022 peak (resistance turned support)
- The channel's lower boundary
The November 2025 candle is less informative — it took the form of a doji that emerged after moderate candles following a retracement, rather than after an extended impulsive advance where dojis more often signal exhaustion.
Channel failures typically occur through momentum deterioration, not visual overextension. Despite elevated skepticism, monthly structure shows no evidence of distribution or trend exhaustion. Long-term buyers continue to defend structural support, consistent with consolidation rather than capitulation.
3.2 Weekly Chart — Consolidation Within a Primary Uptrend
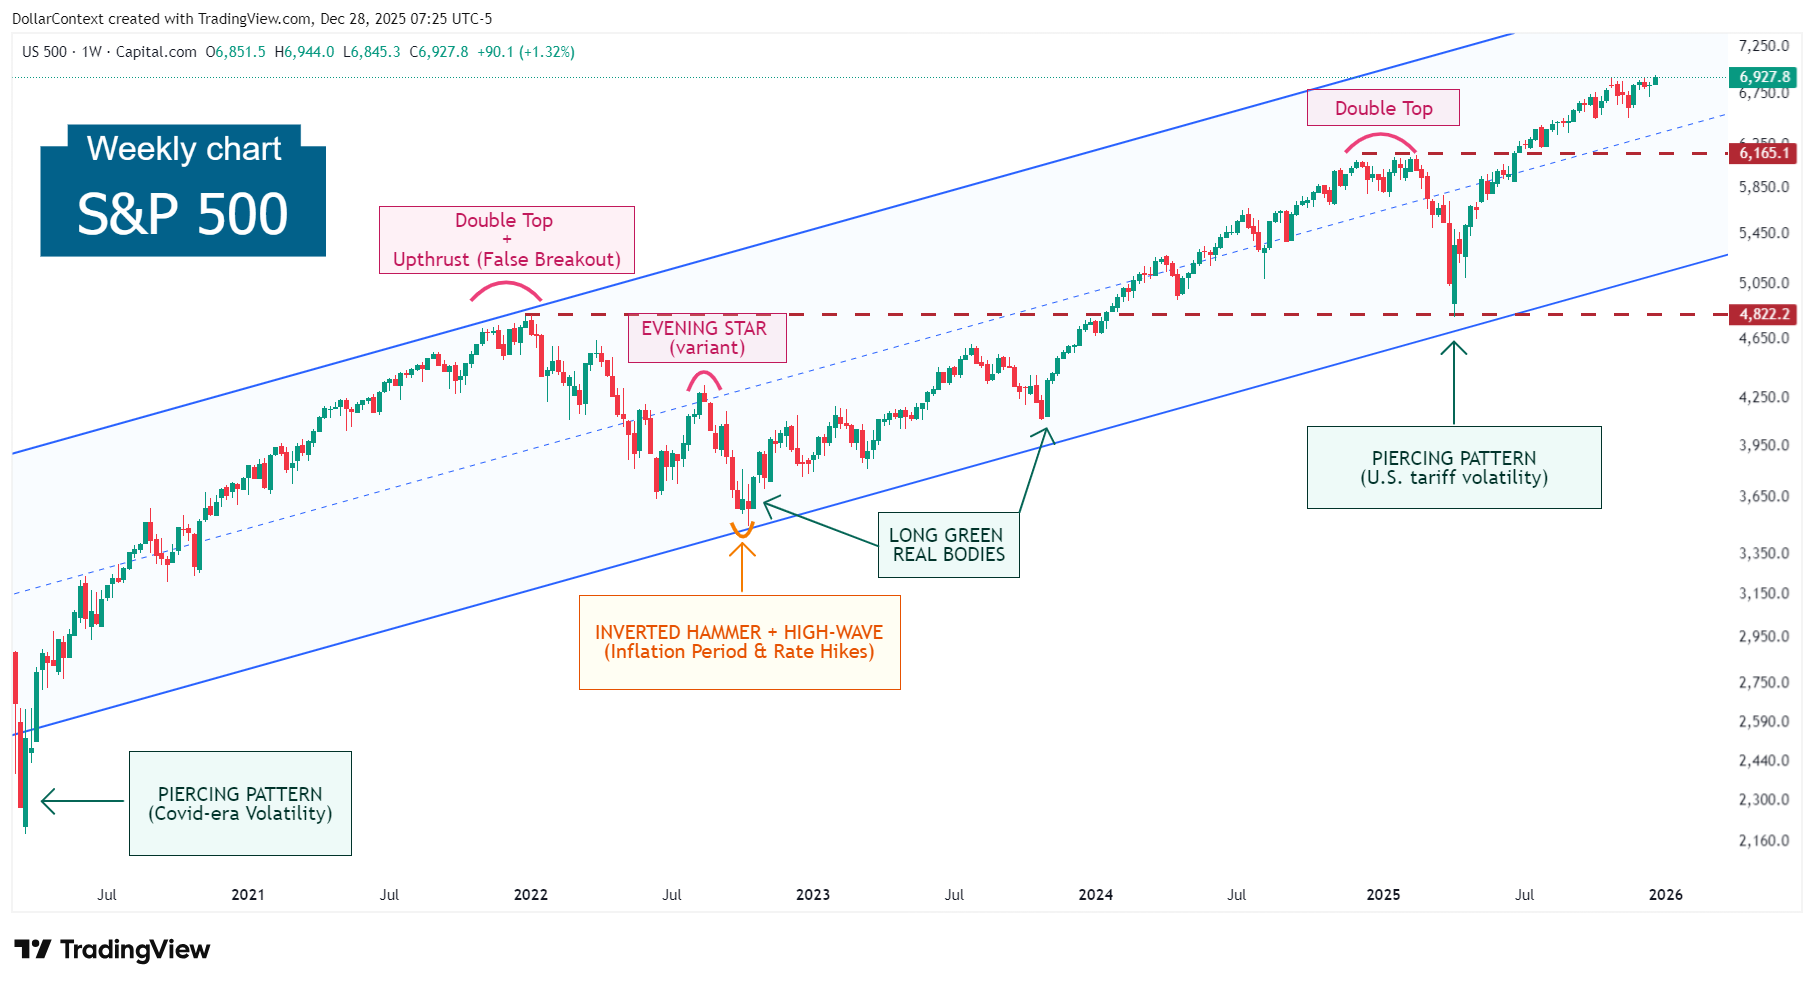
On the weekly timeframe, the S&P 500 cash index continues to respect the broader bullish structure identified on the monthly chart. Price action has repeatedly found support near the channel’s midline and lower boundary, reinforcing the integrity of the prevailing uptrend.
Bridge Sentence With Psychology Section → This aligns with the psychology section’s conclusion that skepticism is acting as a stabilizer rather than a trigger for broad de-risking.
Key weekly structural levels:
- 4,822 — former resistance, now a critical medium-term support zone
- 6,165 — previously a consolidation ceiling, now acting as structural support following the upside break
These levels have played a recurring role in containing corrections and defining acceptance zones, rather than marking trend failure.
Chart pattern context:
-
Two of the three major historical peaks on the weekly chart formed double-top structures, highlighting that:
- Distribution has tended to be gradual, not climactic
- Major tops have required time and repetition, not single-event reversals
Reversal candlestick behavior at major correction lows:
-
March 2020 & April 2025
- Both corrections bottomed with piercing patterns featuring unusually large real bodies
- These signals reflected aggressive dip-buying and rapidly reversed downside momentum
-
October 2022
- The low formed through a confluence of reinforcing signals:
- Inverted hammer
- High-wave candle
- Strong bullish follow-through at cycle lows
- Individually modest, but collectively structurally meaningful
- The low formed through a confluence of reinforcing signals:
Peak candlestick formations:
- Only the August 2022 minor peak displayed a clear reversal structure — a variant of the evening star
- Other highs lacked decisive bearish candlestick confirmation, reinforcing the idea of rotation rather than distribution
Weekly price action reflects rotation and digestion, not panic selling. Reversal signals continue to appear at corrective lows, reinforcing the view that volatility is being absorbed rather than amplified.
3.3 Key Structural Levels — Regime Awareness, Not Trade Signals
After reviewing monthly and weekly structure, the technical picture resolves into a narrow set of levels that define regime integrity, rather than short-term opportunity.
- Primary structural support: The January 2022 breakout zone, reinforced by the lower boundary of the long-term rising channel. This area has already absorbed major stress during the April 2025 drawdown.
- Intermediate trend support: The channel midline on both monthly and weekly charts, which has repeatedly acted as a mean-reversion anchor during corrective phases.
- Structural invalidation zone: A sustained break below the long-term channel support on a monthly closing basis, especially if accompanied by expanding real bodies or consecutive bearish candles.
Importantly, none of these levels function as tactical triggers. Their role is to define whether the market remains in a bullish structural regime or transitions into a broader distribution phase.
Technical Bottom Line for the S&P 500
Higher-timeframe price structure continues to confirm trend durability rather than distribution. Monthly and weekly charts show consolidation within a secular uptrend, supported by historically significant levels and reinforced by the absence of decisive bearish candlestick patterns.
What would change this view:
A loss of long-term channel support or a sequence of monthly bearish closes below former structural support would signal a regime shift — a scenario explored explicitly in Section 4: Scenarios & Key Levels.
4. Scenarios & Regime Interpretation
The current technical structure suggests trend durability with rising sensitivity to momentum shifts. Rather than a single forecast, the market presents three structurally coherent scenarios, each defined by price behavior around key levels, not by headlines or short-term signals.
4.1 Base Case — Consolidation Within a Primary Uptrend
Probability bias: Highest
In the base case, the S&P 500 continues to digest gains through time rather than price, oscillating within its established trend structure.
Defining characteristics:
- Price holds above former resistance turned structural support (notably the post-2022 breakout zone).
- Pullbacks remain contained above major weekly support, with no sustained loss of structural levels.
- Weekly candles show overlap, rotation, and compression, not impulsive downside expansion.
Interpretation:
This scenario aligns with:
- Skeptical but non-panicked positioning
- Policy patience rather than tightening shocks
- Earnings resilience without valuation expansion
Structural implication:
The market resolves excess through consolidation and sector rotation, allowing the primary uptrend to persist without requiring renewed speculative inflows.
4.2 Bullish Extension — Momentum Reacceleration Within the Same Regime
Probability bias: Conditional
A bullish extension becomes likely only if consolidation resolves upward with expanding participation, not merely price drift.
What would define this scenario:
- A decisive weekly breakout above recent consolidation highs
- Renewed upside momentum confirmed by strong real bodies and expanding ranges
- Leadership broadening beyond narrow megacap dominance
Interpretation:
This would suggest that:
- Skepticism has been absorbed rather than amplified
- Earnings durability and pricing power are being rewarded
- The market is transitioning from digestion to trend continuation
Structural implication:
This scenario represents extension within the same secular bull regime, not a new speculative phase. Upside would remain earnings-driven, not multiple-driven.
4.3 Structural Failure — Trend Damage, Not a Normal Correction
Probability bias: Lower, but non-trivial
A bearish outcome requires clear structural damage, not volatility or sentiment-driven pullbacks.
What would invalidate the current regime:
- A sustained weekly close below major structural support
- Breakdown of the long-standing channel logic visible on higher timeframes
- Monthly candles showing expansion to the downside, not lower shadows or compression
Interpretation:
This would signal that:
- Skepticism has shifted into distribution
- Policy tolerance is no longer sufficient to stabilize expectations
- The market is repricing the growth–inflation–rates balance more aggressively
Structural implication:
This would mark a regime transition, not merely a cyclical correction — requiring reassessment of both macro assumptions and equity exposure.
Scenario Summary — What Matters Most
Across all scenarios, levels matter more than narratives:
- As long as price respects higher-timeframe support, skepticism resolves constructively.
- Upside requires momentum confirmation, not hope.
- Downside requires structural breaks, not volatility.
👉 This framework sets the stage for translating structure into practical expectations, which we address next by clarifying what this means operationally — not as trades, but as positioning awareness.
5. Practical Implications for the S&P 500
This section translates the macro, positioning, and technical conclusions of this analysis into concrete behavior rules for investors exposed to the S&P 500. It is not a trading guide — it defines how to position, size, and react within the current regime.
5.1 How to Interpret Pullbacks in the Current Regime
Based on the macro setup and higher-timeframe structure:
- Pullbacks above key structural supports are corrective, not bearish
-
Volatility spikes driven by:
- Fed rhetoric
- Political headlines
- Short-term growth scares
Practically:
- Do not reduce S&P 500 exposure solely due to volatility or sentiment swings
-
Reassess exposure only if:
- Weekly structure breaks decisively
- Former support zones fail to hold on a closing basis
👉 Actionable lens:
Volatility without structural damage = information, not a signal.
5.2 How to Think About Exposure (Not Entries)
This environment does not reward passive “buy everything” behavior, but it also does not favor defensive positioning.
Given:
- Structural inflation
- Valuation constraints
- Rotation-heavy leadership
Practically:
-
S&P 500 exposure should be:
- Maintained, not aggressively increased
- Selective, not index-blind
-
Expect periods where:
- The index goes sideways
- Leadership rotates internally
- Headlines sound worse than price action suggests
👉 Actionable lens:
Hold exposure, but expect uneven participation and avoid chasing late-cycle narratives.
5.3 How to Use Technical Levels Going Forward
From this analysis, technicals serve a regime validation role, not a timing role.
Practically:
-
Use key structural levels as:
- Risk reference points
- Thesis checkpoints
-
Not as:
- Short-term buy/sell triggers
If price:
- Respects support → trend remains intact, thesis holds
- Breaks structure decisively → reassess exposure and assumptions
👉 Actionable lens:
Levels define when to rethink, not when to trade.
5.4 What Would Force a Change in Behavior
This framework would shift from “participate with discipline” to “reduce exposure” if any of the following occur:
- Weekly structure transitions from consolidation into lower highs and lower lows
- Long-term support zones fail on sustained closes
- Macro policy shifts from patience into forced tightening or growth shock
Until then, default behavior remains unchanged.
👉 Actionable lens:
Behavior changes only when structure breaks — not when narratives change.
Practical Bottom Line for the S&P 500
Right now, the S&P 500 calls for engaged participation with defined limits, not aggressive conviction and not defensive retreat. The market is digesting gains through consolidation and rotation, not signaling structural exhaustion. Until proven otherwise by price and structure, the practical response is to stay invested, manage risk through levels, and resist reacting to noise.
Conclusion
The S&P 500 currently sits at the intersection of structural inflation and tactical patience. Monetary policy has shifted from urgency to inertia, fiscal dynamics are quietly shaping rate outcomes, and growth remains resilient — if increasingly uneven.
Market psychology reflects skepticism without capitulation, while higher-timeframe technical structure continues to validate consolidation rather than distribution. Together, these forces argue for trend persistence, albeit with diminishing tolerance for weak fundamentals or excess valuation.
The burden of proof has not yet shifted to the bears— but complacency remains unwarranted.
The dominant trend remains intact, but upside is increasingly conditional on structure holding. Investors should remain engaged, while allowing key levels — not headlines — to define risk and opportunity.