HAMMER
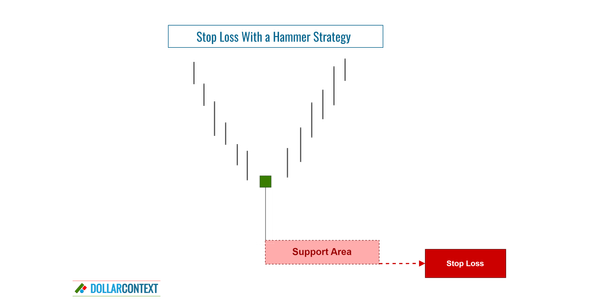
Hammer: How to Set Your Stop loss
Set the stop-loss level below the low of the hammer pattern to protect against potential downside risk.
HAMMER
Set the stop-loss level below the low of the hammer pattern to protect against potential downside risk.
HAMMER
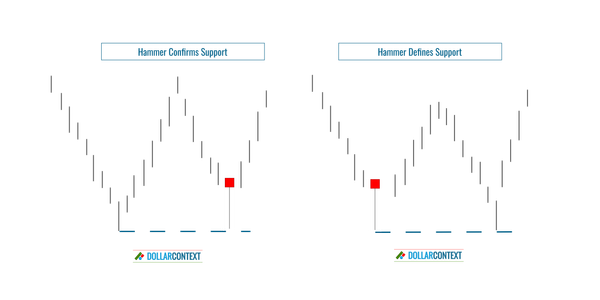
A hammer creates a support area or confirms the credibility of a previously identified support zone.

HAMMER
In this post we cover the psychological implications of a hammer pattern within the domain of Japanese candlestick charts.
HAMMER
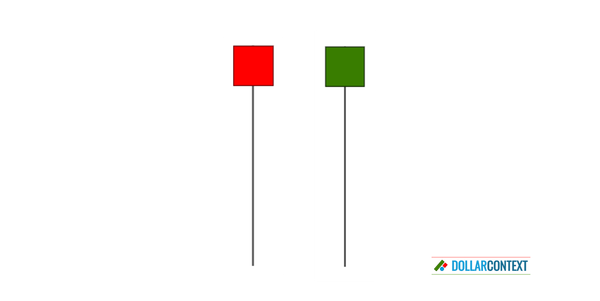
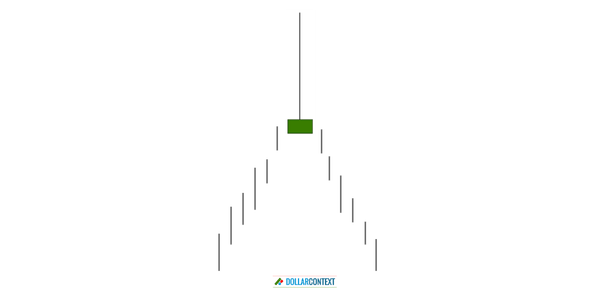
The hammer pattern consists of a candle with a small real body at the upper end of the session and a long lower shadow.
CANDLESTICK
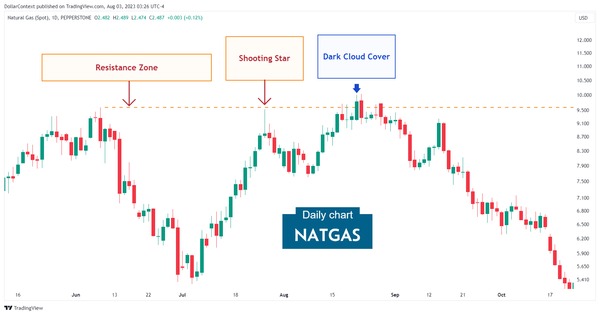
Today, we're going to explore a crucial component in the realm of Japanese candlestick analysis: the shooting star.
CANDLESTICK
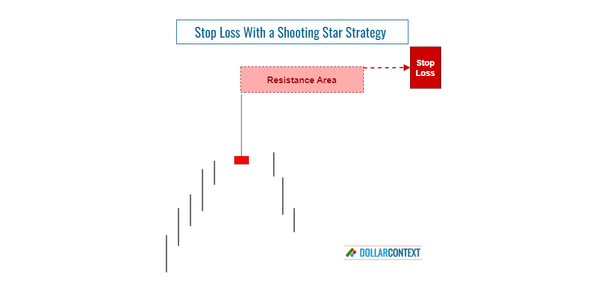
The peak price of a shooting star establishes a resistance level, which functions as your initial stop loss point.
CANDLESTICK
The price range of a shooting star tends to become resistance. In particular, the peak price of this candle line either establishes or reinforces a resistance level.

CANDLESTICK
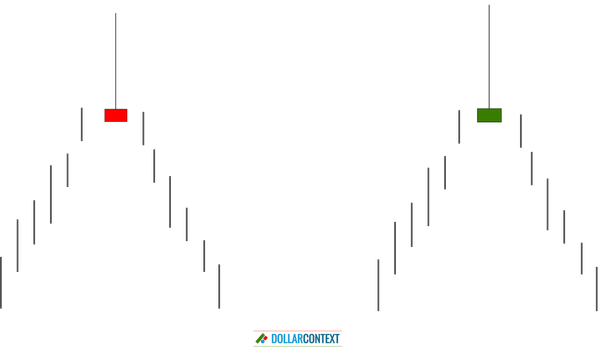
A shooting star symbolizes a psychological battle between bulls and bears and the inability of the buyers to sustain the high prices.
CANDLESTICK
The shooting star pattern consists of a candle with a small real body at the lower end of the candle and a long upper shadow.
CANDLESTICK
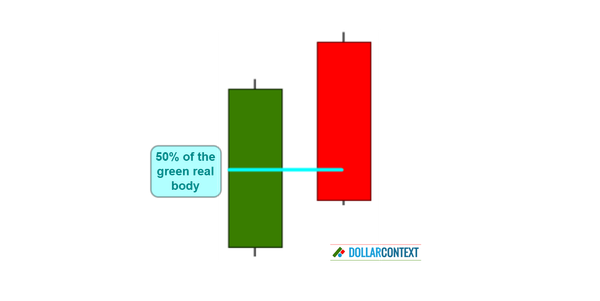
After either a mature or a sharp uptrend, a dark cloud cover can act as an indicator of reversal. This presents a potential opportunity for traders to establish short positions in the market.
CANDLESTICK
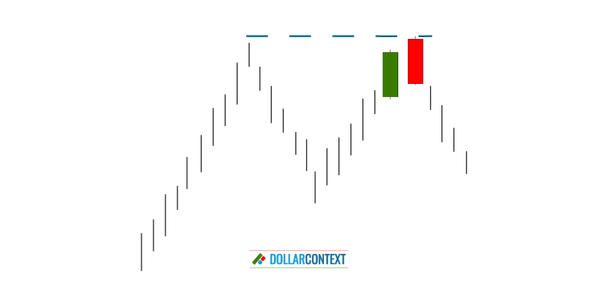
The highs of a dark cloud cover usually becomes resistance. This level acts as a ceiling that price struggles to break through.
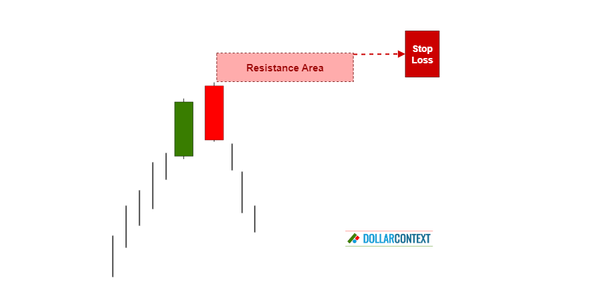
CANDLESTICK
The highs of the dark cloud cover creates a resistance area. This resistance level represents your initial stop loss.