CANDLESTICK
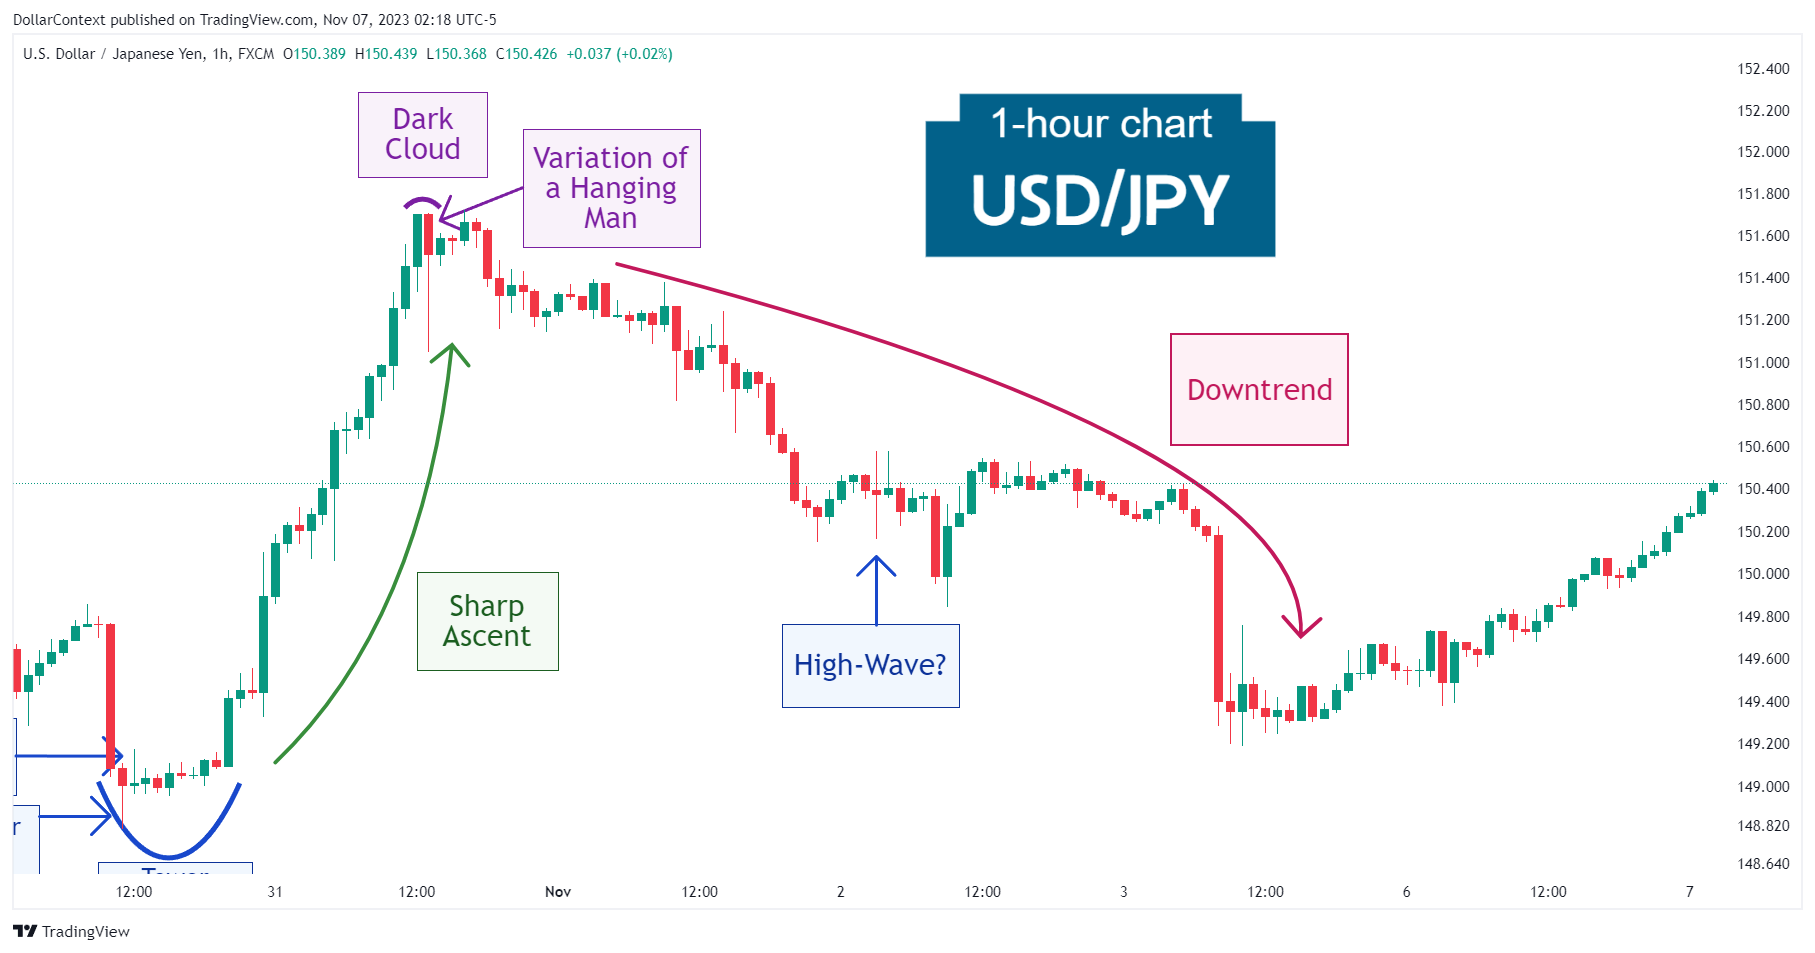
Case Study 0018: Dark Cloud Cover and Hanging Man After a Sharp Ascent (USD/JPY)
After a sharp rise of approximately 1.8 percent within an 18-hour timeframe, the USD/JPY presented a dark cloud cover and a hanging man candle line.
A series delving into numerous Japanese candlestick techniques illustrated with historical chart examples.
CANDLESTICK
After a sharp rise of approximately 1.8 percent within an 18-hour timeframe, the USD/JPY presented a dark cloud cover and a hanging man candle line.
CANDLESTICK
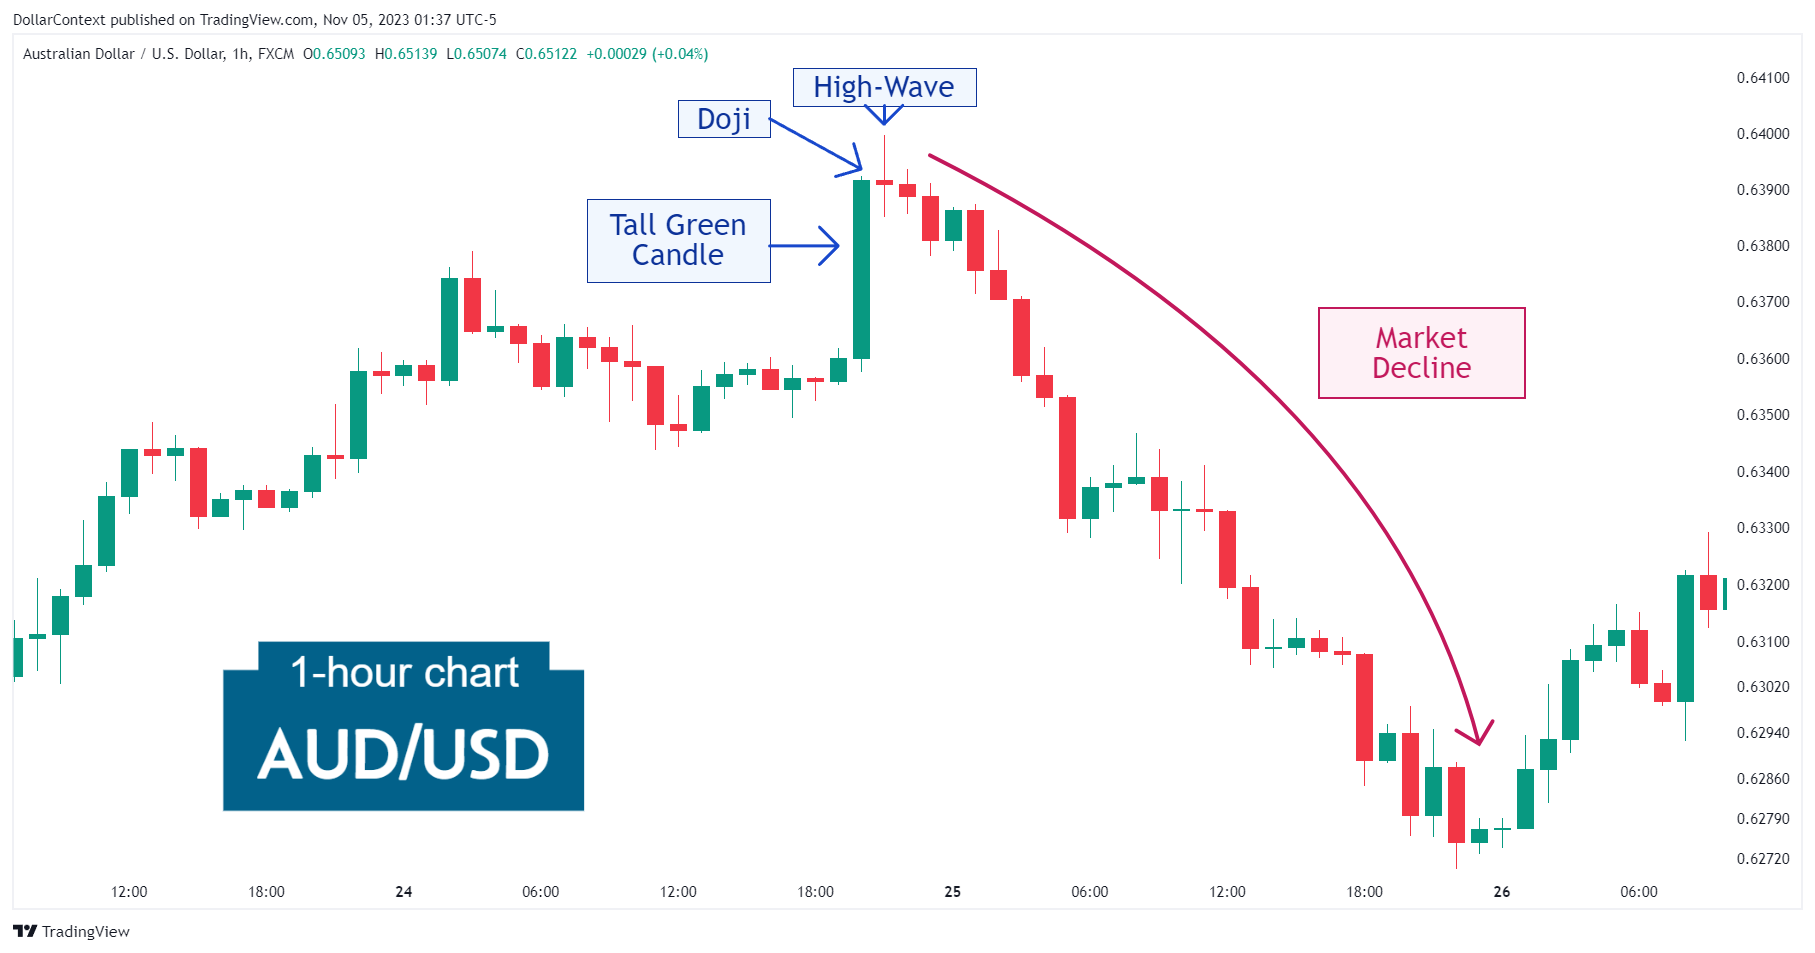
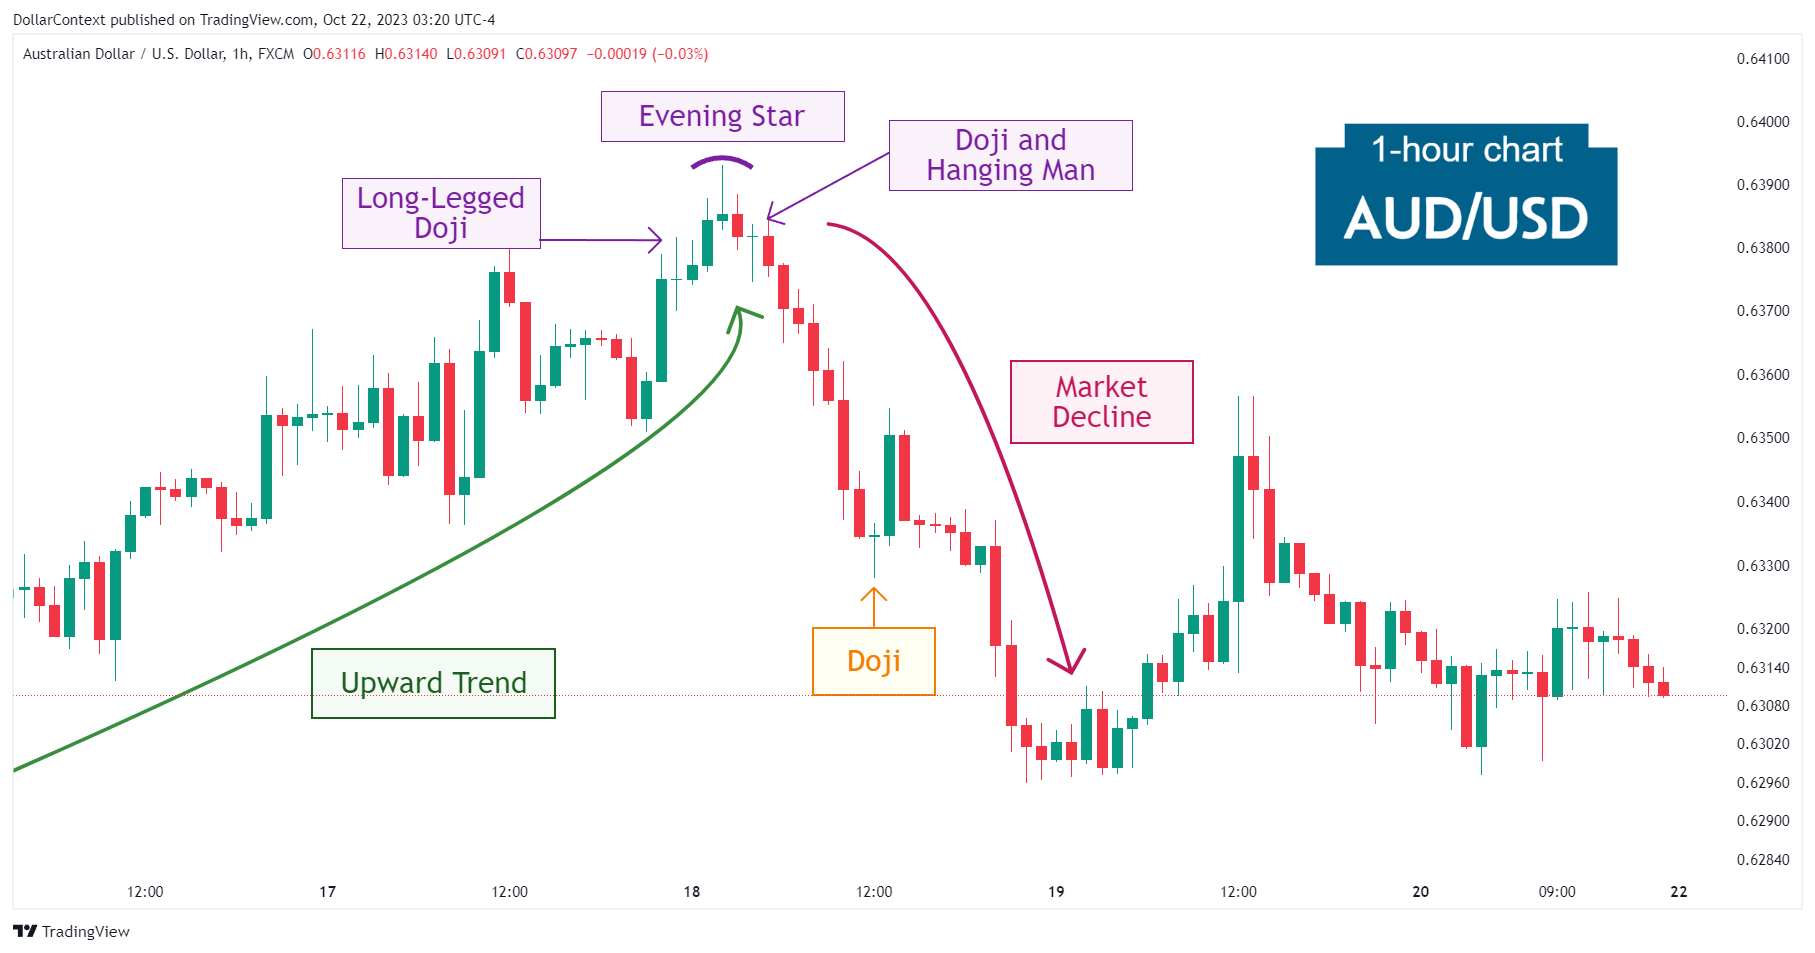
In this article, we will cover the performance of the AUD/USD after the emergence of a high-wave pattern.
CANDLESTICK
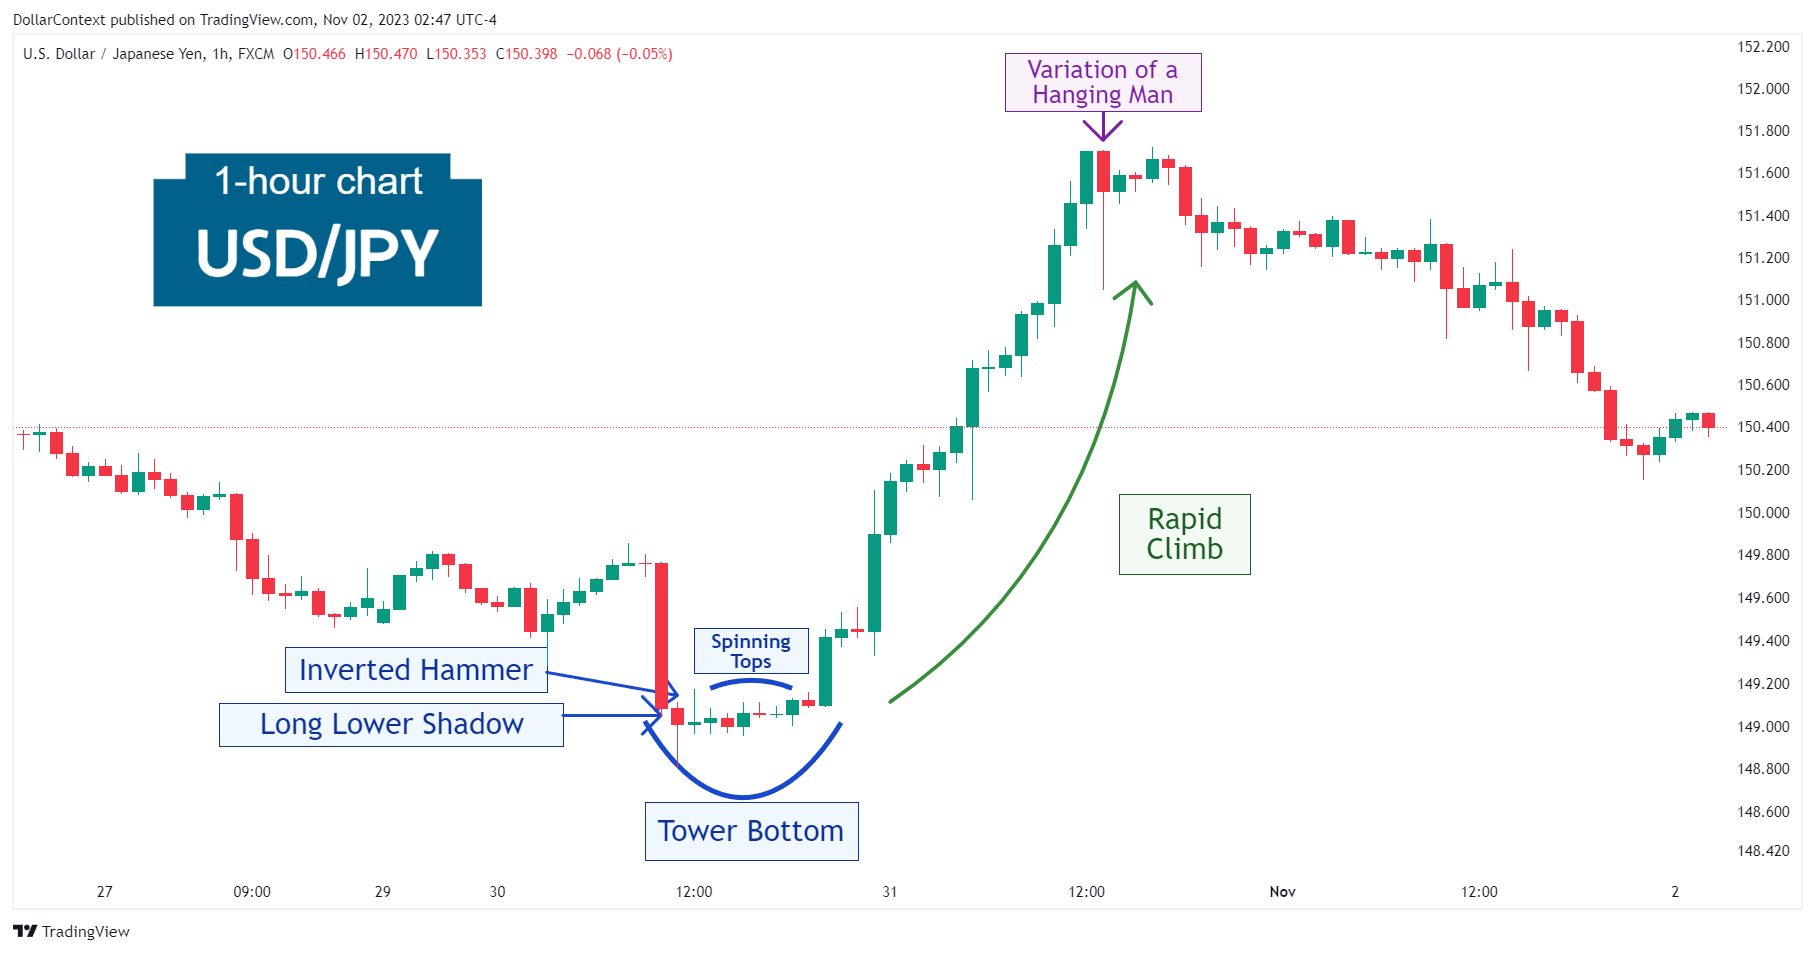
After a decline, the USD/JPY displayed a tower bottom. Then the market exploded to the upside, signaling robust buying pressure.
CANDLESTICK
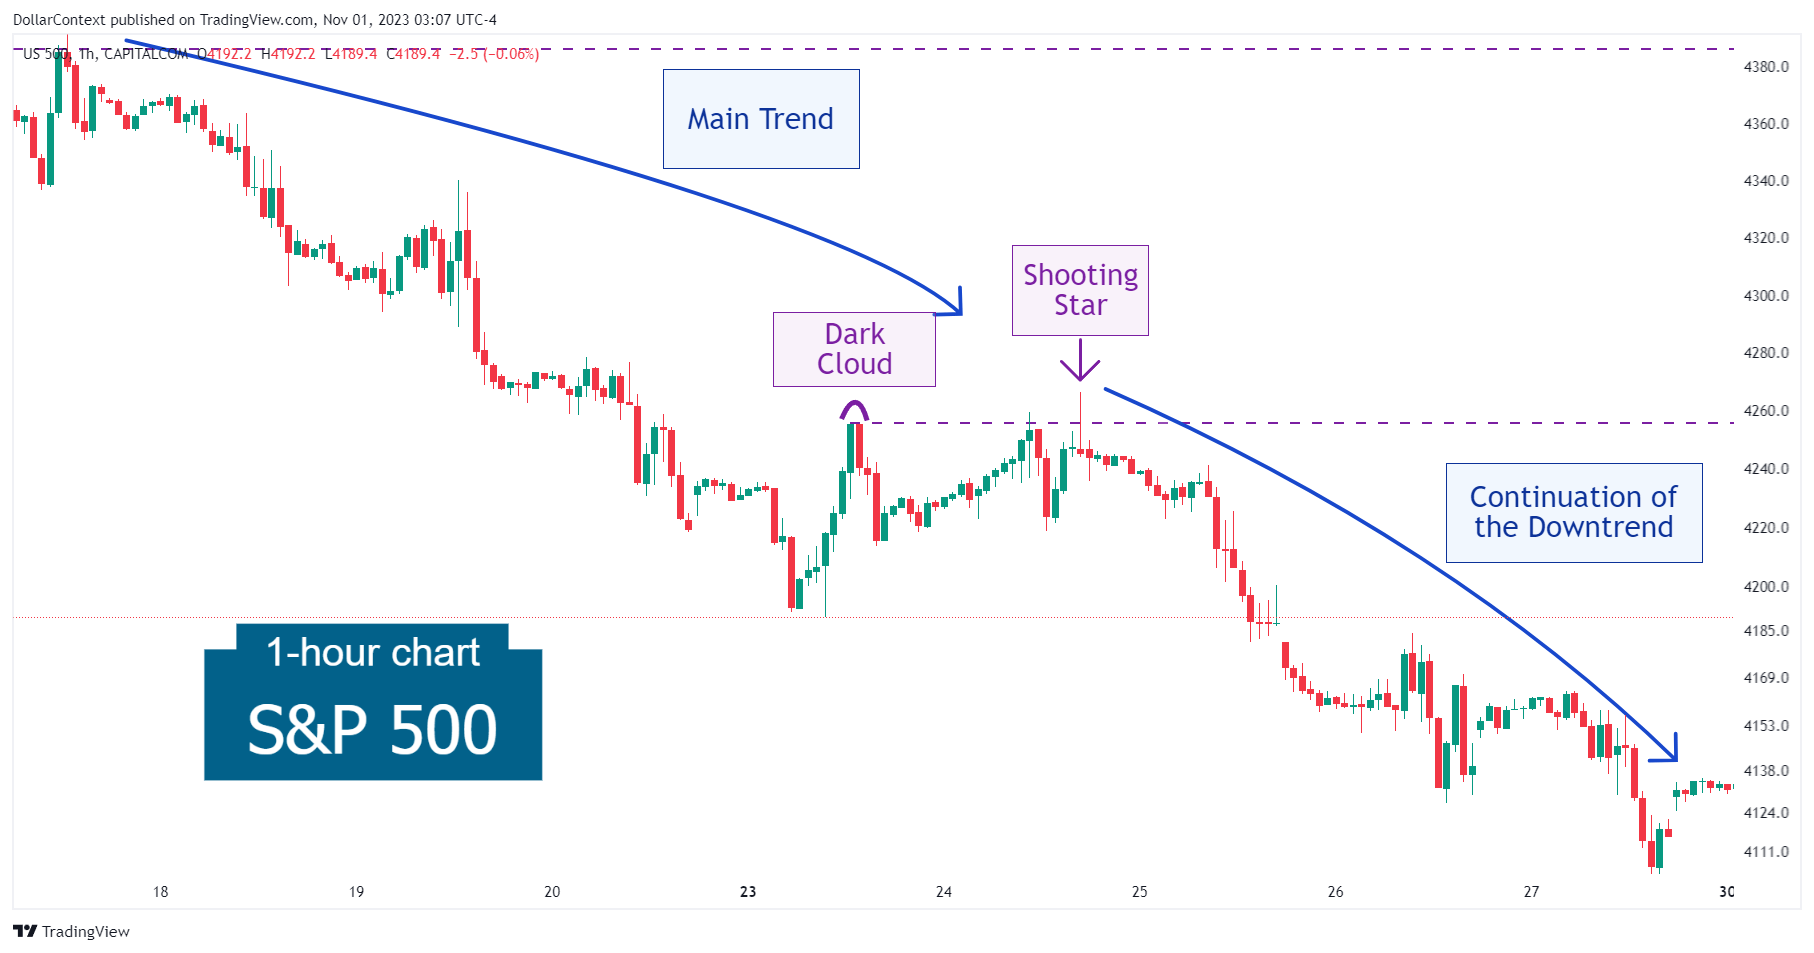
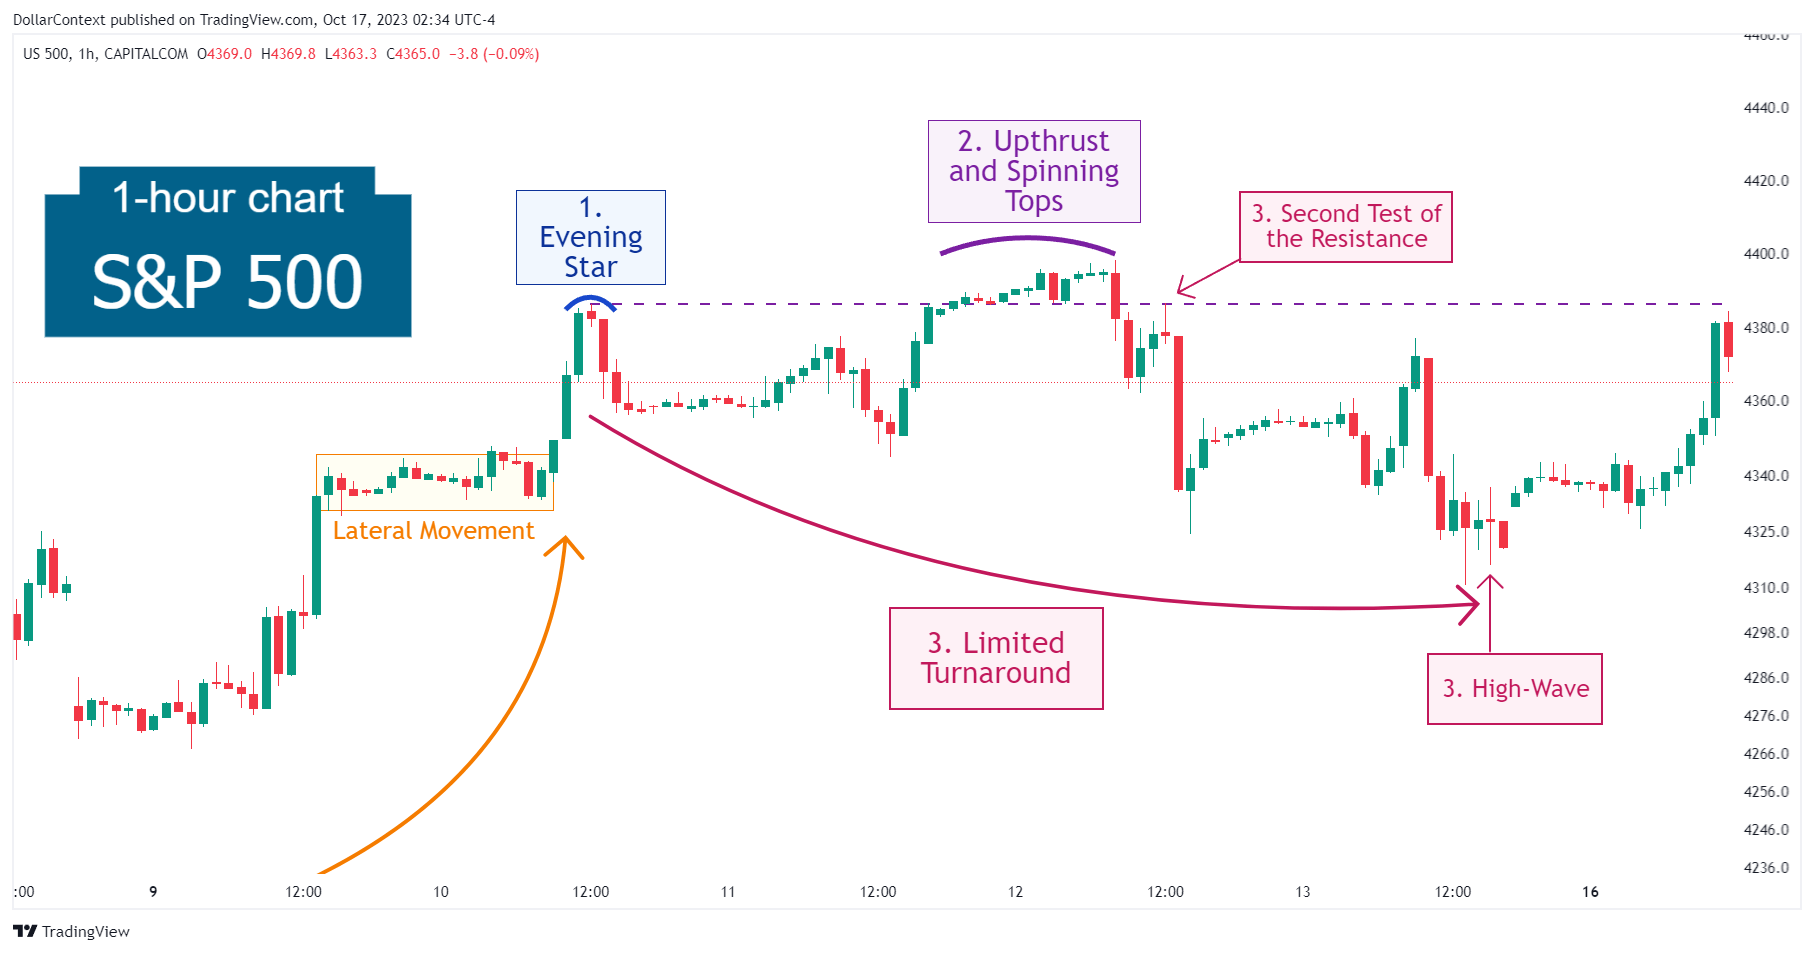
In this article, we will cover the performance of the S&P 500 after the emergence of a dark cloud cover and a shooting star.
CANDLESTICK
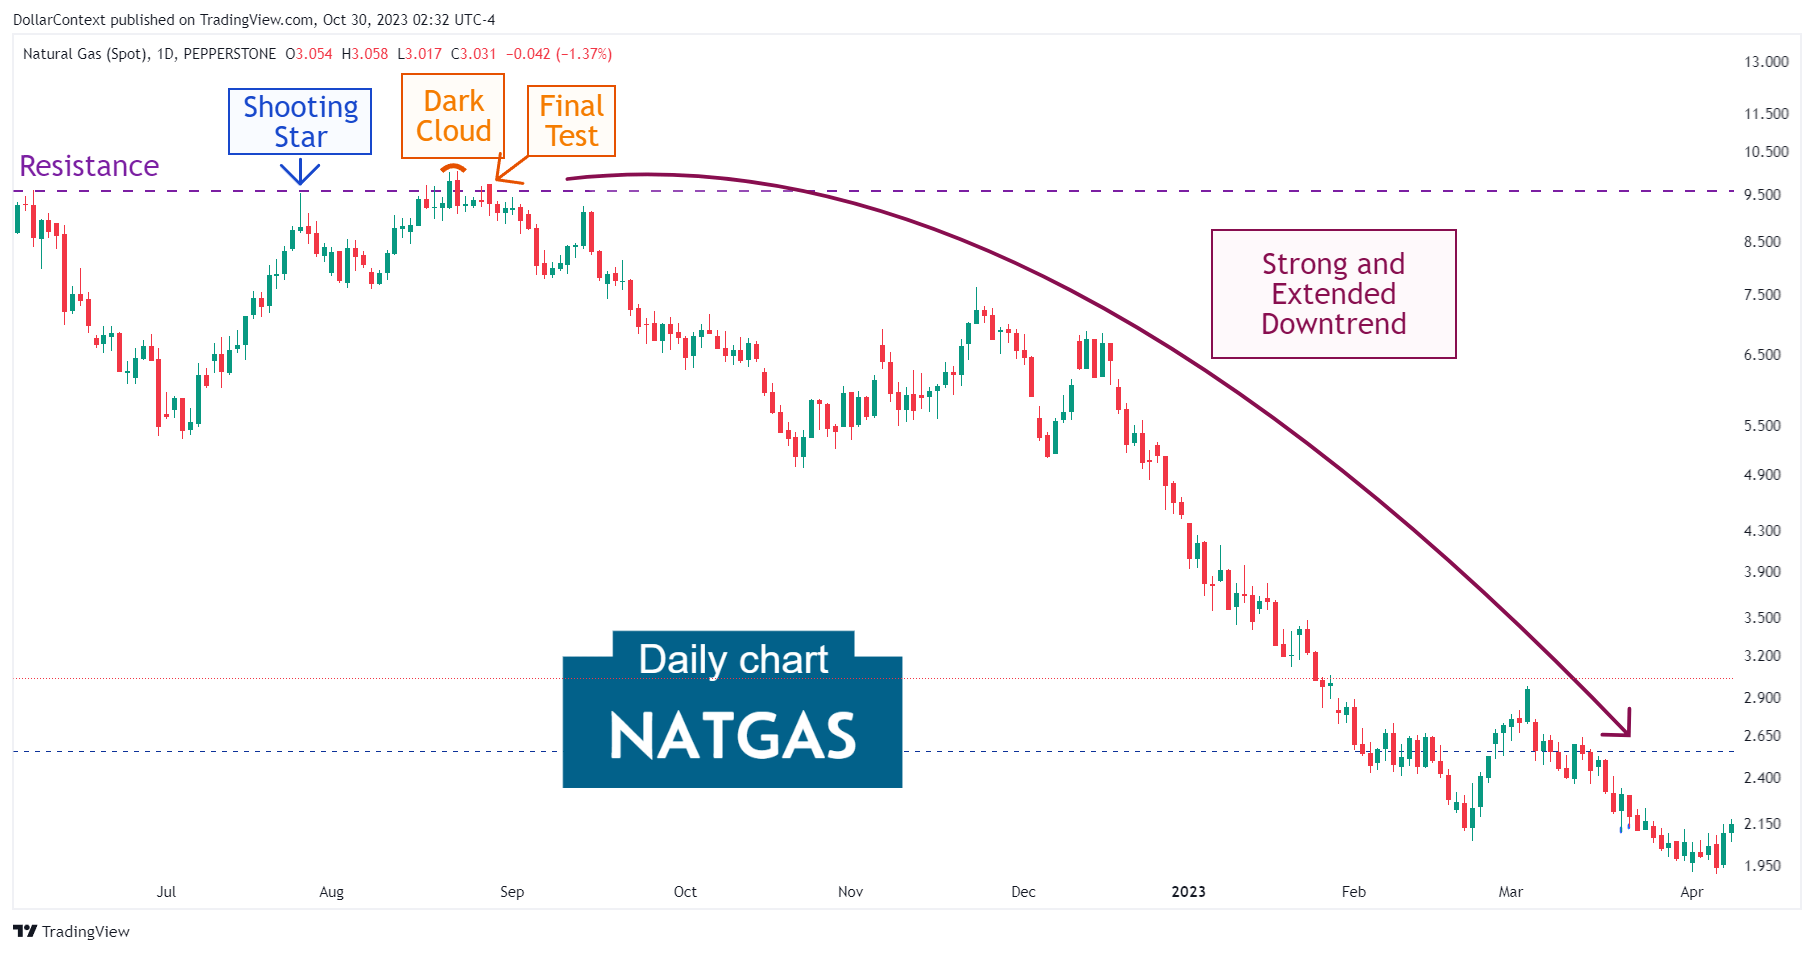
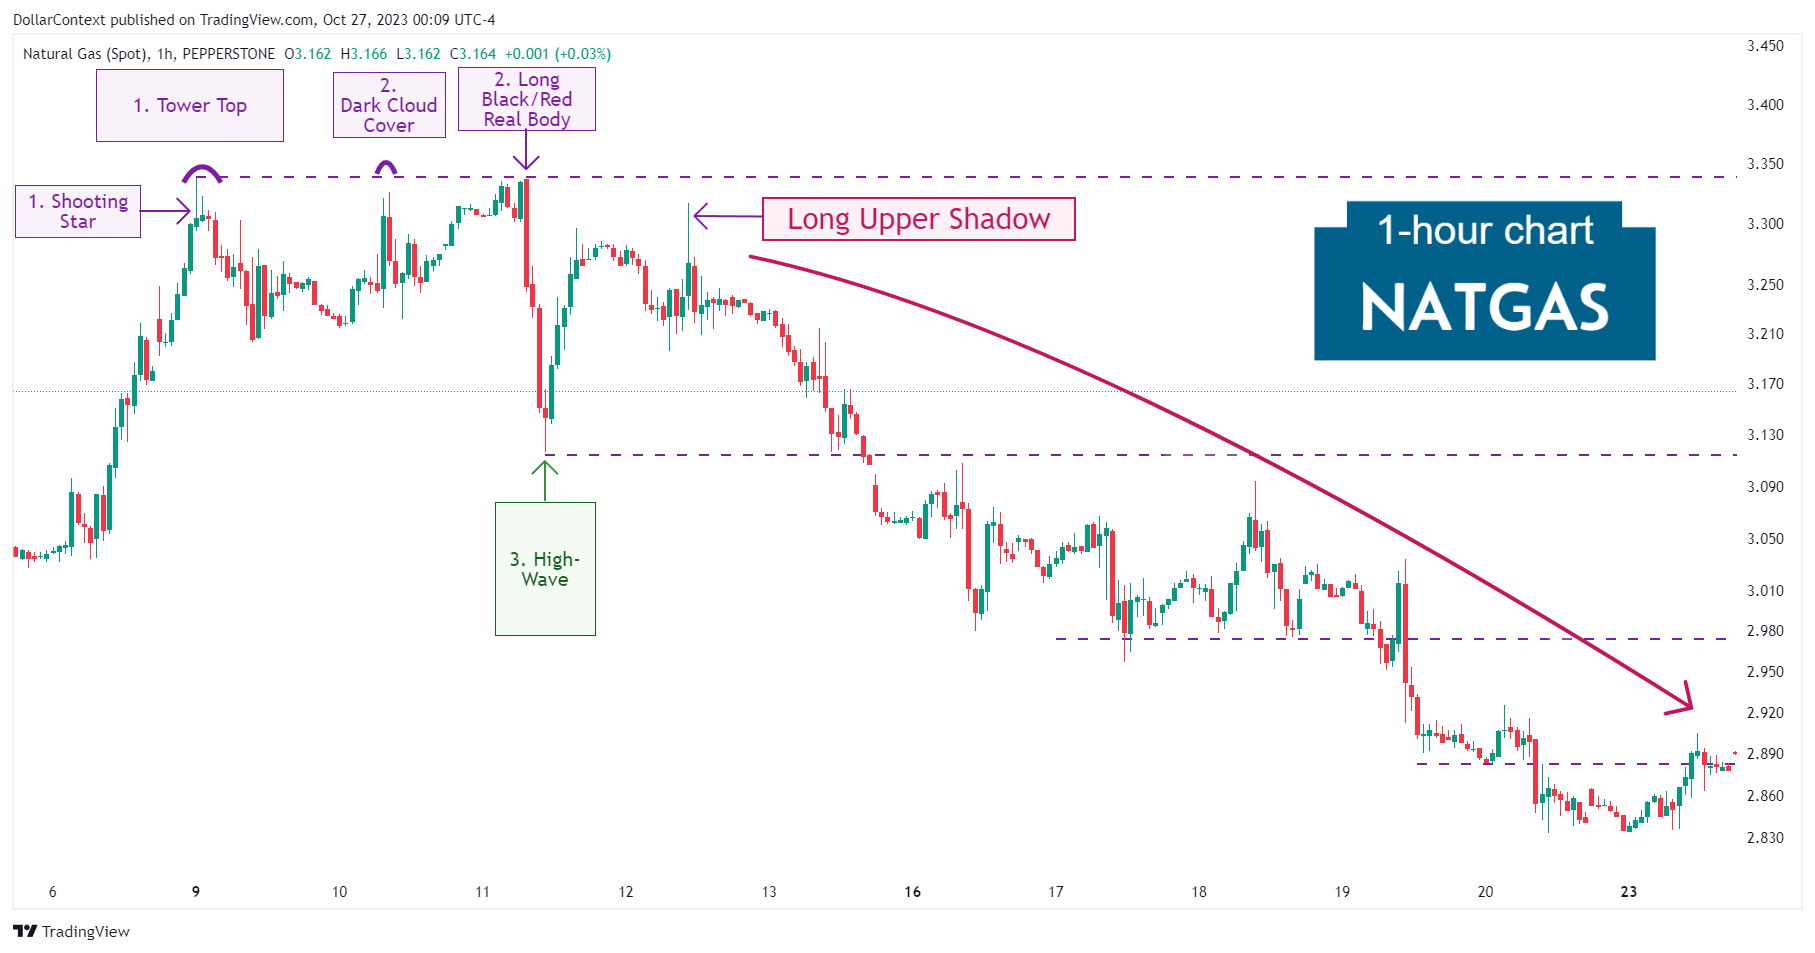
In this article, we will discuss the performance of natural gas prices after the emergence of a shooting star and a dark cloud cover.
CANDLESTICK
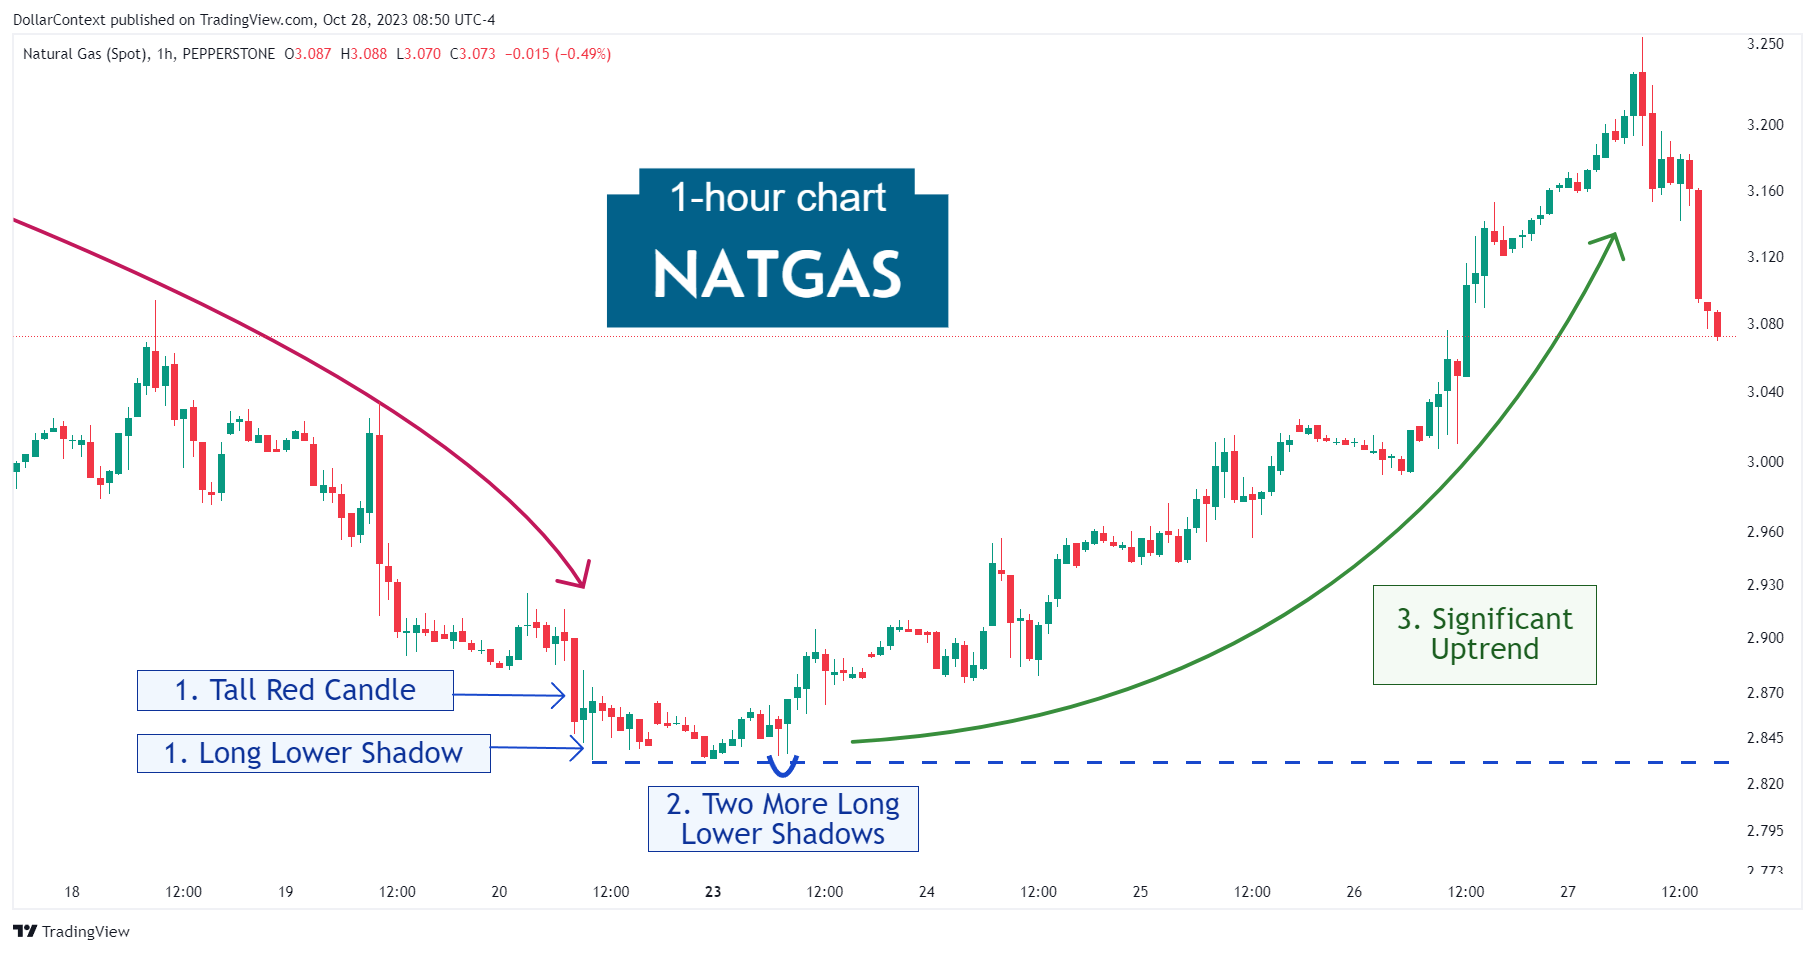
In this article, we will examine the performance of the natural gas market after the emergence of a series of long lower shadows.
CANDLESTICK
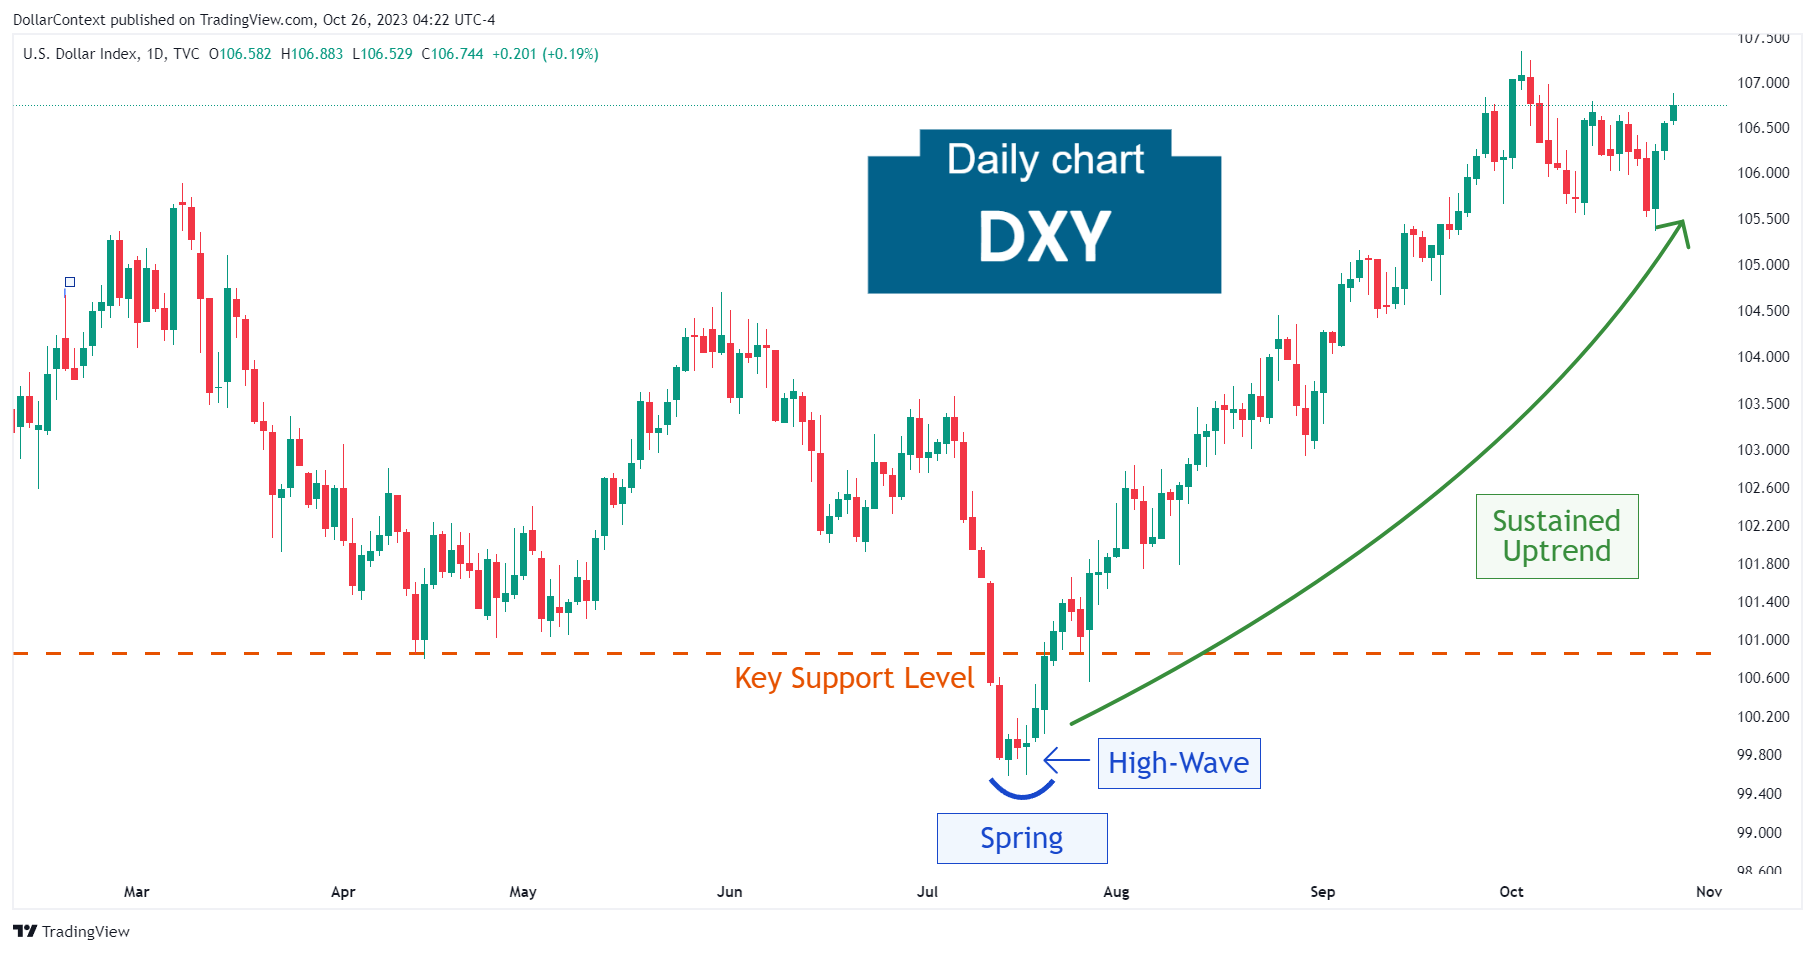
In this article, we will discuss the performance of the DXY after the market plunge in mid-July 2023.
CANDLESTICK
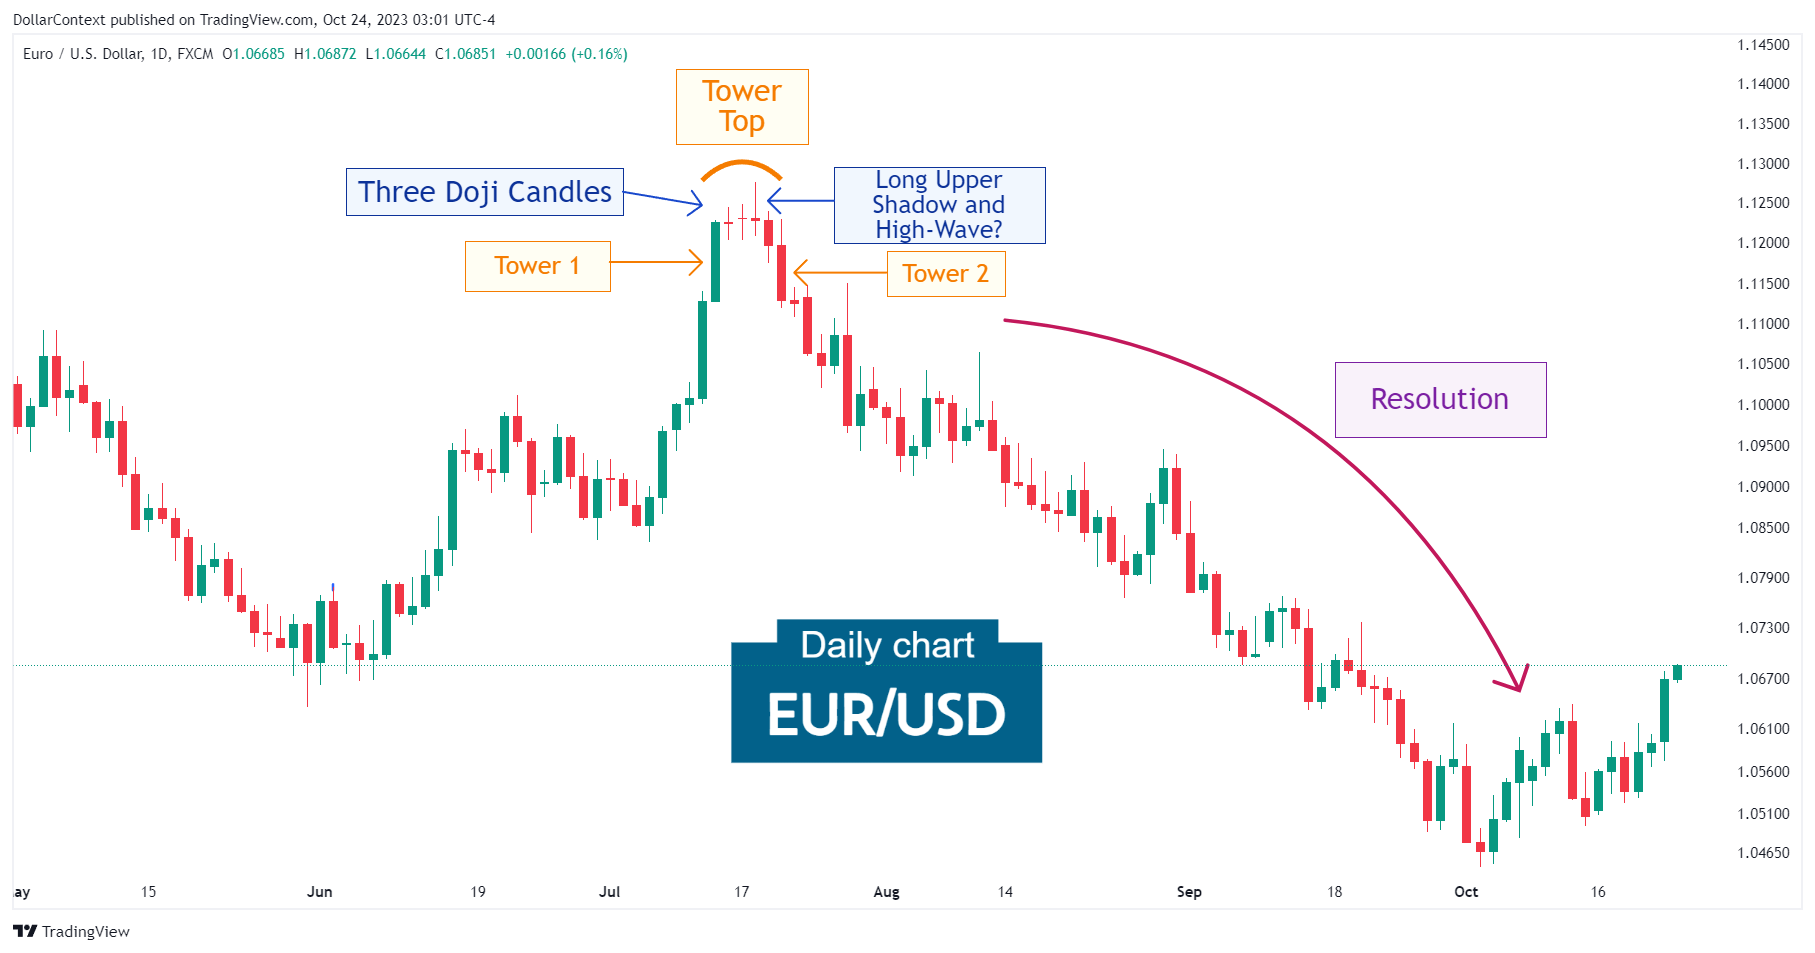
In this article, we will discuss the performance of the EUR/USD after the emergence of a series of doji sessions and a tower top.
CANDLESTICK
In this article, we will cover the performance of the AUD/USD market after the appearance of an evening star and shooting star pattern.
CANDLESTICK
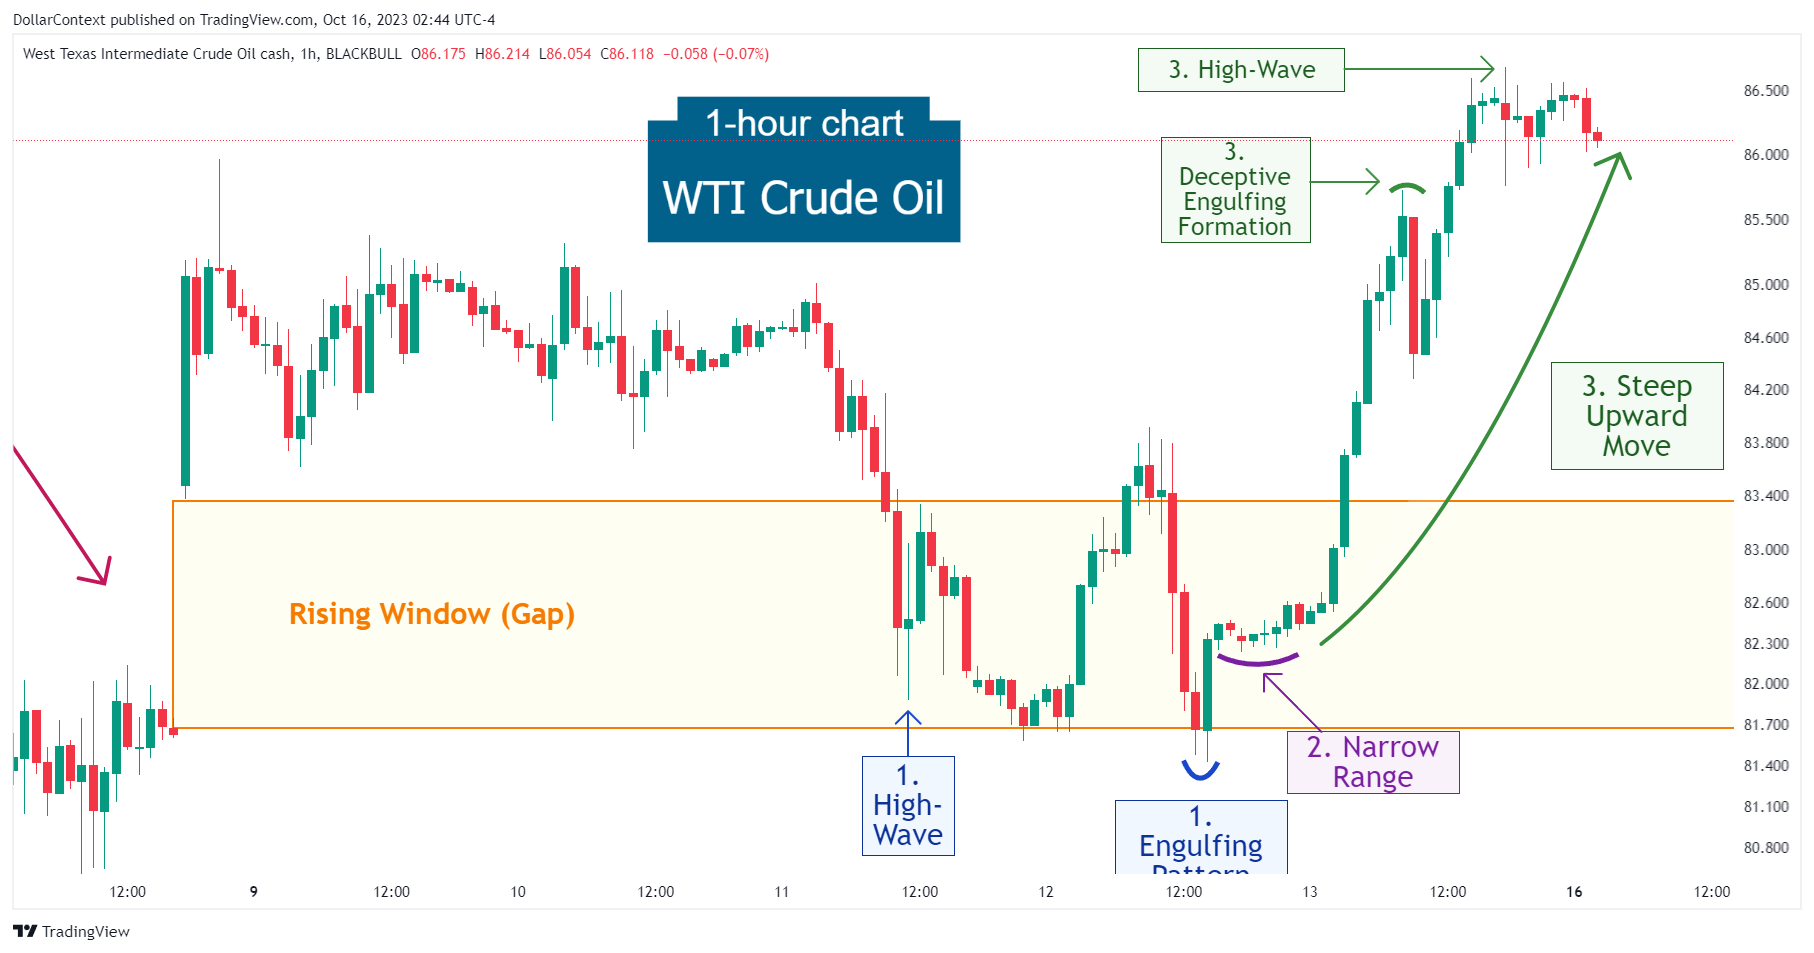
In this article, we will cover the performance of the WTI market after the emergence of a high-wave and an engulfing pattern.
CANDLESTICK
In this article, we will discuss the performance of the S&P 500 after the appearance of an evening star.
CANDLESTICK
In this article, we will examine the performance of the natural gas market after the emergence of a tower top.