Engulfing Pattern Strategy: A Comprehensive Tutorial
We'll delve into a major indicator of Japanese candlestick charting: the engulfing pattern.
In this discussion, we'll delve into a vital element of Japanese candlestick charting: the engulfing pattern.
Before we get into the intricacies of this specific formation, it's important to highlight three core characteristics common to many candlestick patterns, the engulfing pattern included:
- Trend Reversal: Many candlestick patterns act as signals of a possible trend change, suggesting that the existing trend could be reaching its culmination and a reversal might be imminent. Thus, the bullish engulfing pattern appears after a downtrend, and the bearish engulfing pattern emerges after an uptrend.
- Flexible Timeframes: These patterns are adaptable across various timeframes in markets with sufficient liquidity, extending from minutes and hours to days, weeks, and even months.
- Universal Applicability: Candlestick patterns can be applied in any trading environment that has available price data—be it commodities, stocks, forex, or indices. This broad applicability stems from the fact that these patterns are rooted in price action.
Contents
1. The Shape of an Engulfing Pattern
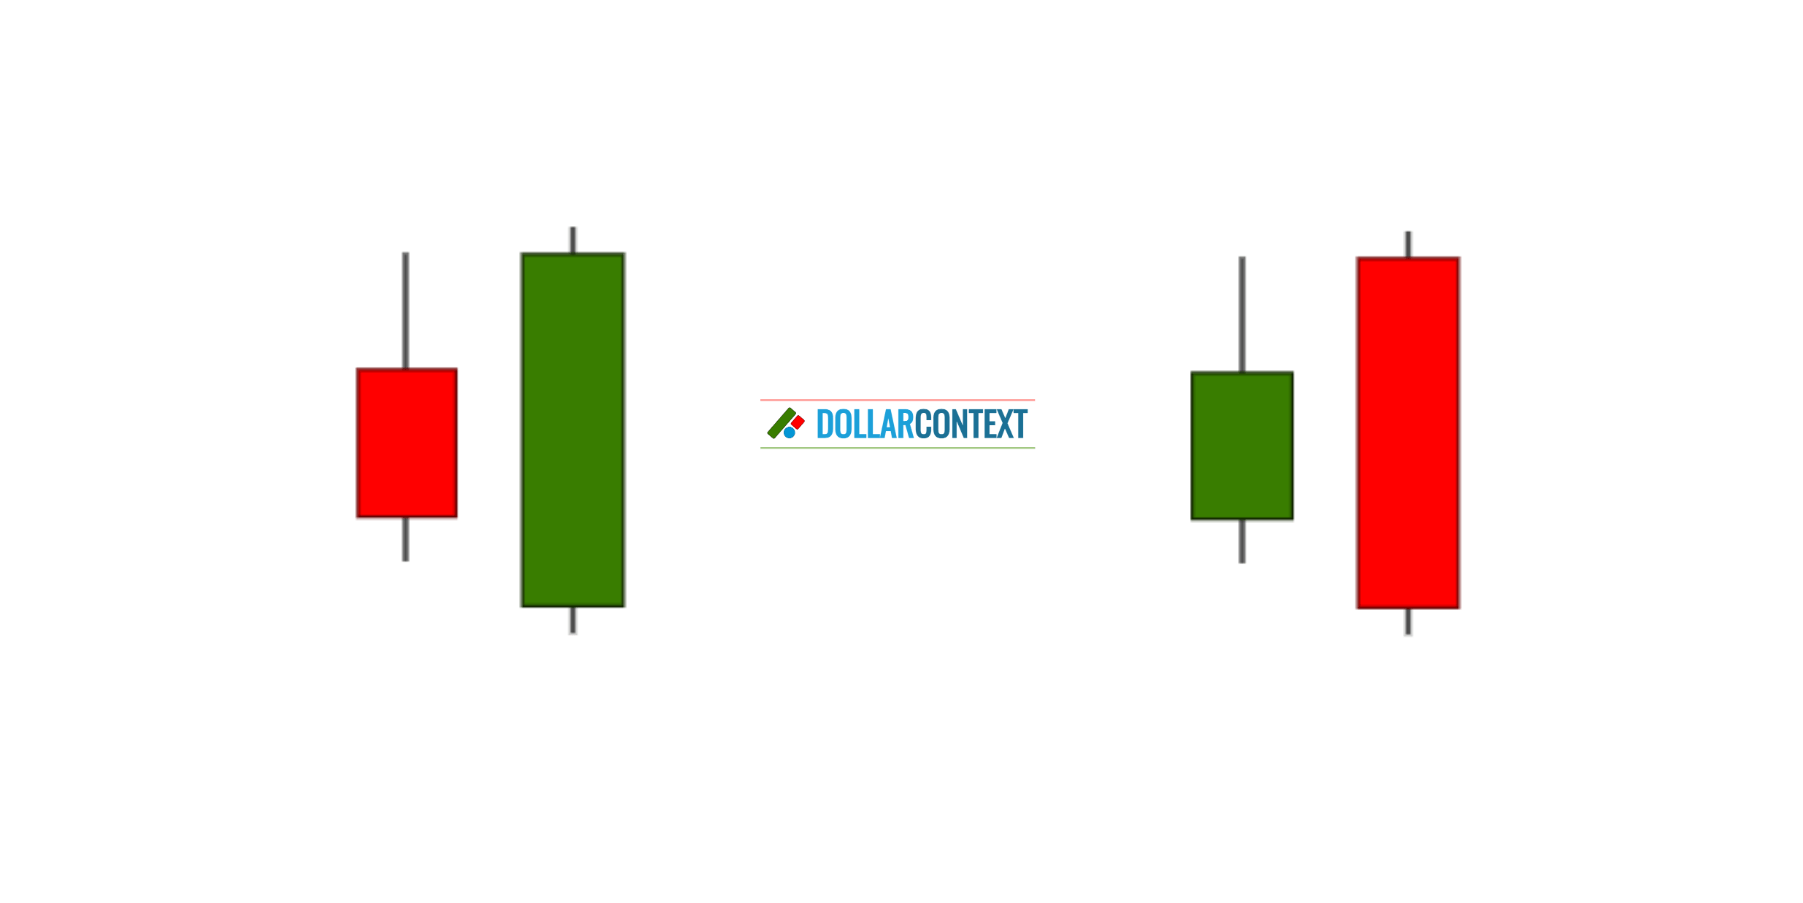
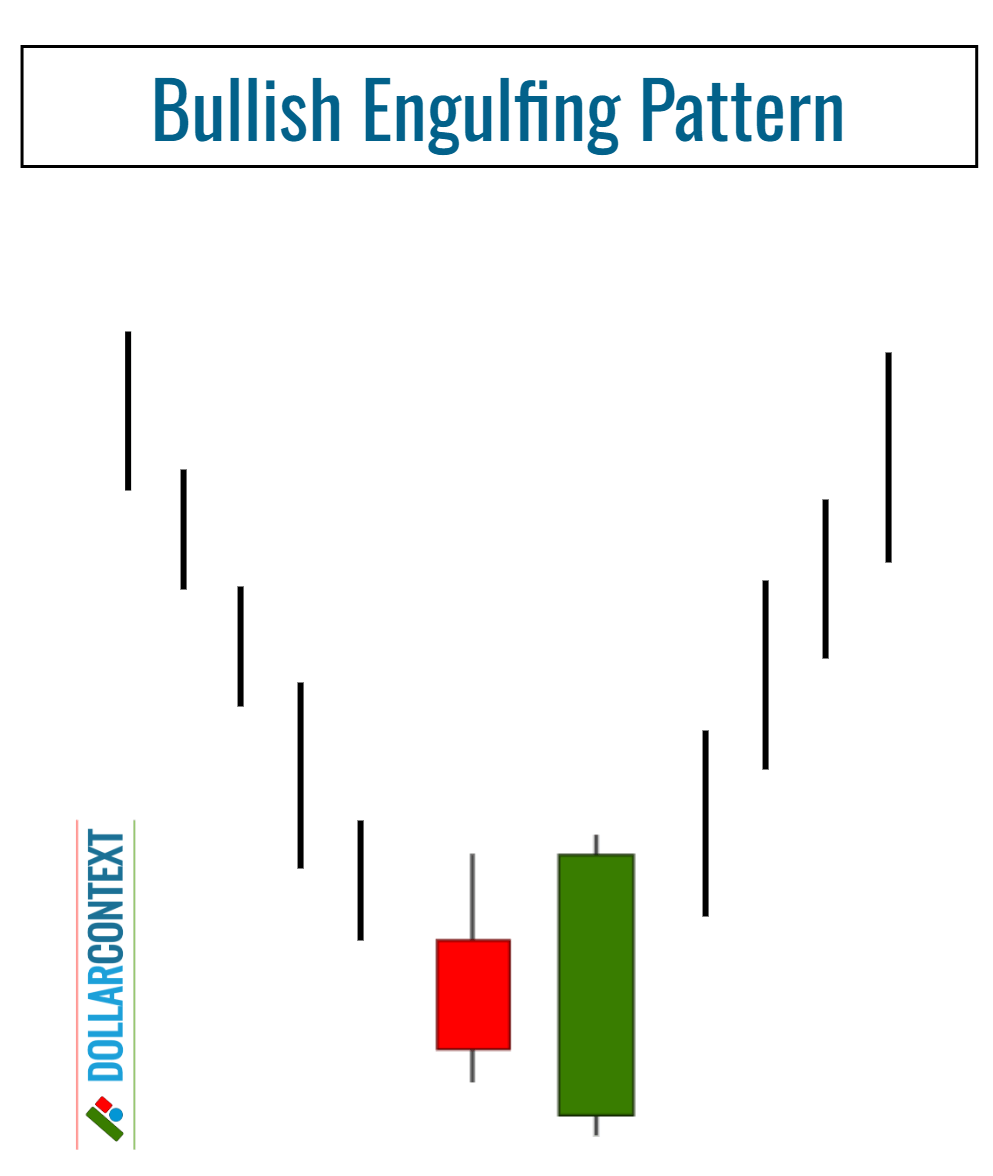
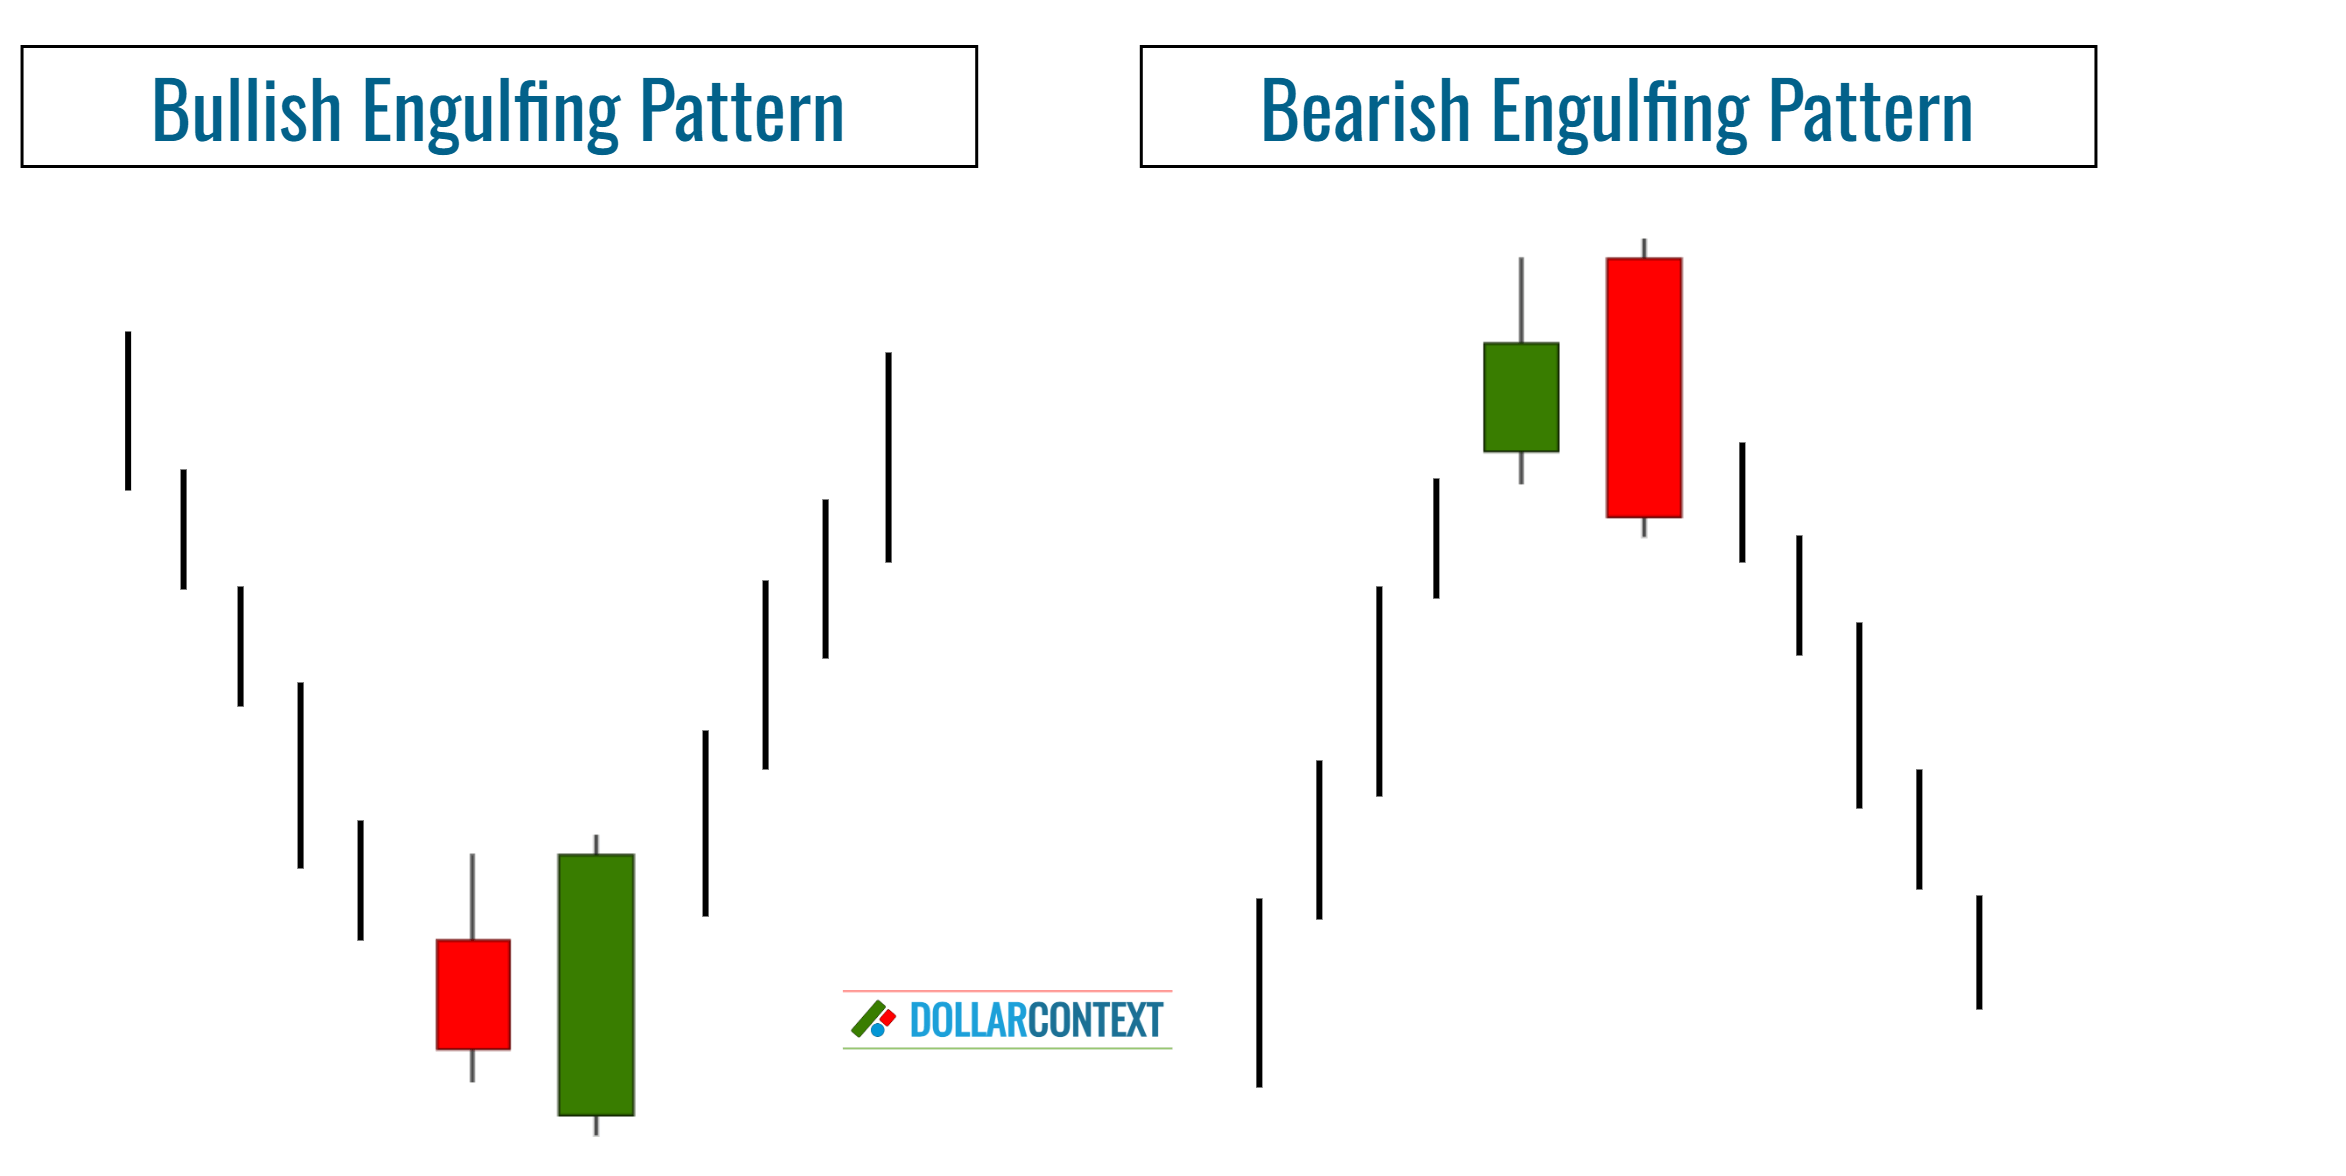
The shape of an engulfing pattern consists of two contrasting candlesticks. The second candlestick is larger and completely envelopes or "engulfs" the first one, but not necessarily its shadows.
There are two basic types of engulfing patterns:
- Bullish Engulfing Pattern
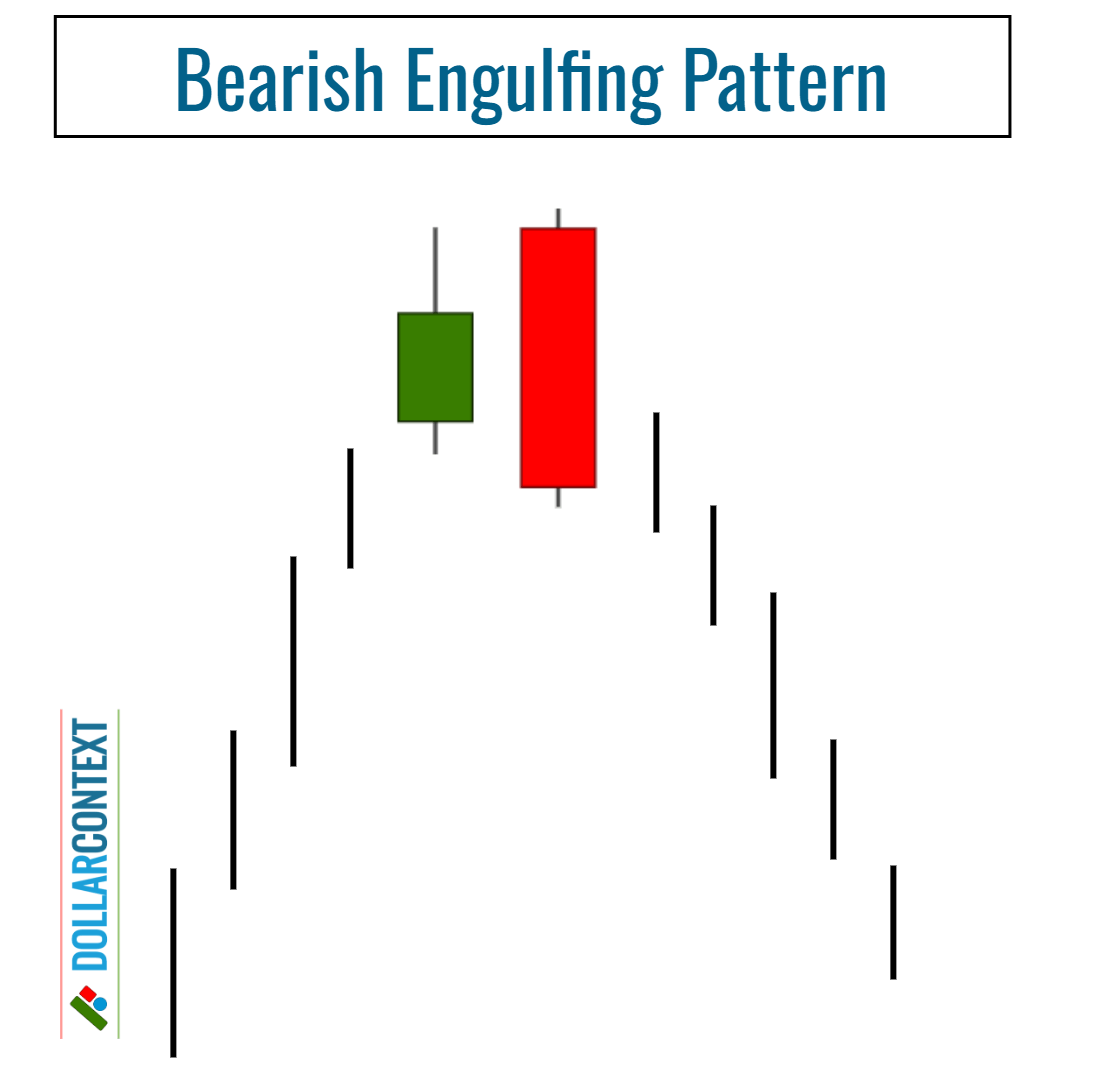
- Bearish Engulfing Pattern
A bullish engulfing pattern, characterized by a red candlestick followed by a green one, should appear following a downtrend.
A bearish engulfing pattern, which features a green candlestick followed by a red one, is typically seen after an uptrend.
To qualify as an engulfing pattern, the following three criteria must be satisfied:
- Market Trend: There must be a discernible uptrend or downtrend in the market, even if it's for a short duration.
- Engulfment: The pattern is made up of two candlesticks, with the second one's real body completely enveloping the real body of the first, although it doesn't have to cover the shadows.
- Color Contrast: The colors of the two real bodies should be opposite, unless the first real body is so minuscule that it's practically a doji.
However, not all engulfing patterns are equally important. The significance of an engulfing pattern is determined by:
- The relative sizes of the two bodies
- The relationship between their respective shadows
- The robustness and longevity of the preceding trend
- Other situational factors
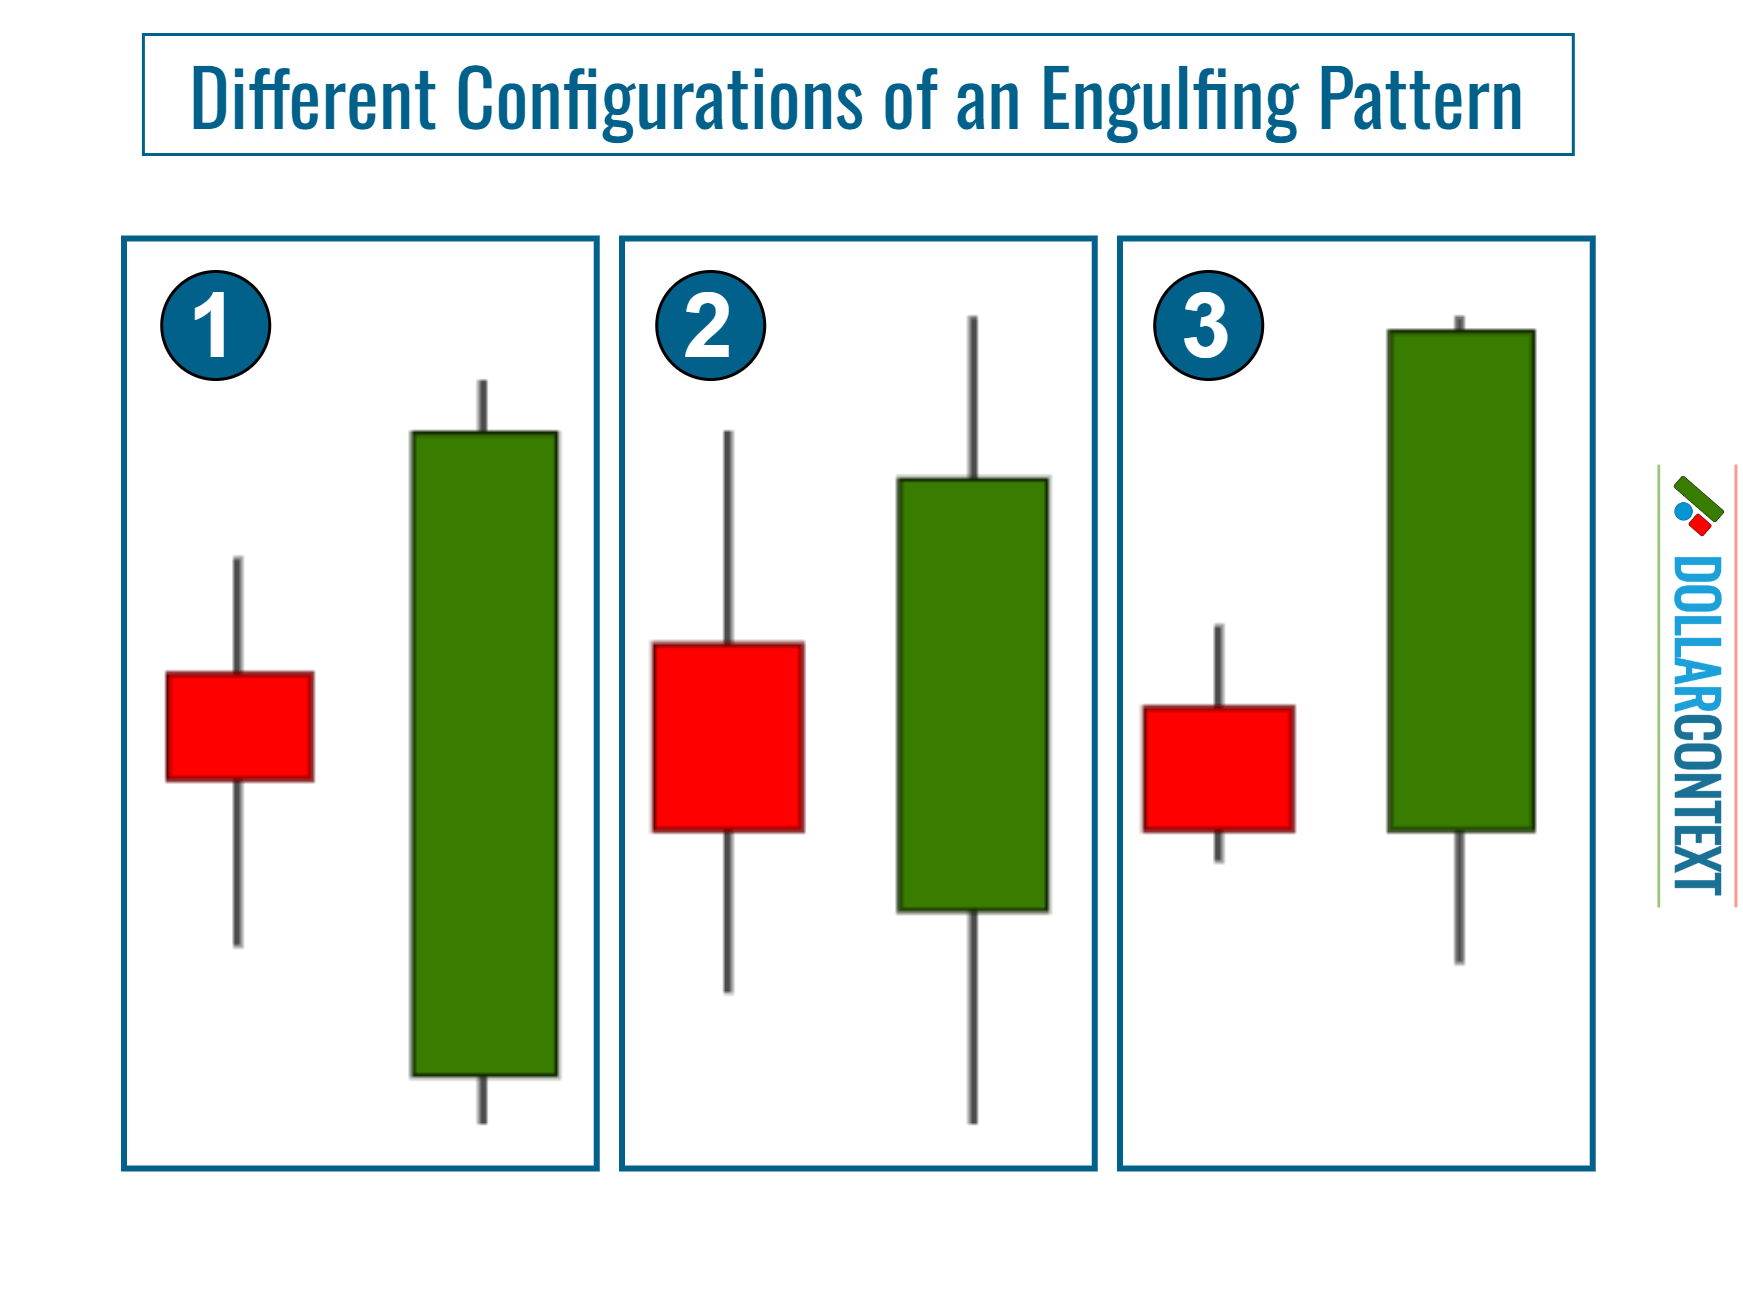
Based on these variables, we can identify three variations of the engulfing pattern:
- The optimal engulfing pattern consists of a relatively small first candle that is fully enveloped, including its shadows, by a significantly larger second candle. Refer to the pattern labeled "1" in the images below.
- The next ideal shape is one where the shadows of the second candle exceed those of the first, signifying that the market achieved a higher high and a lower low during the second session of the pattern. See the patterns marked as "2" below.
- A more lenient interpretation is permissible in markets with low volatility or when scrutinizing shorter timeframes, such as minutes or hours. In these instances, an engulfing pattern may be considered if the second session opens at the same price as the first session's close. In such cases, additional validation cues are advisable to confirm the potential for a trend reversal.
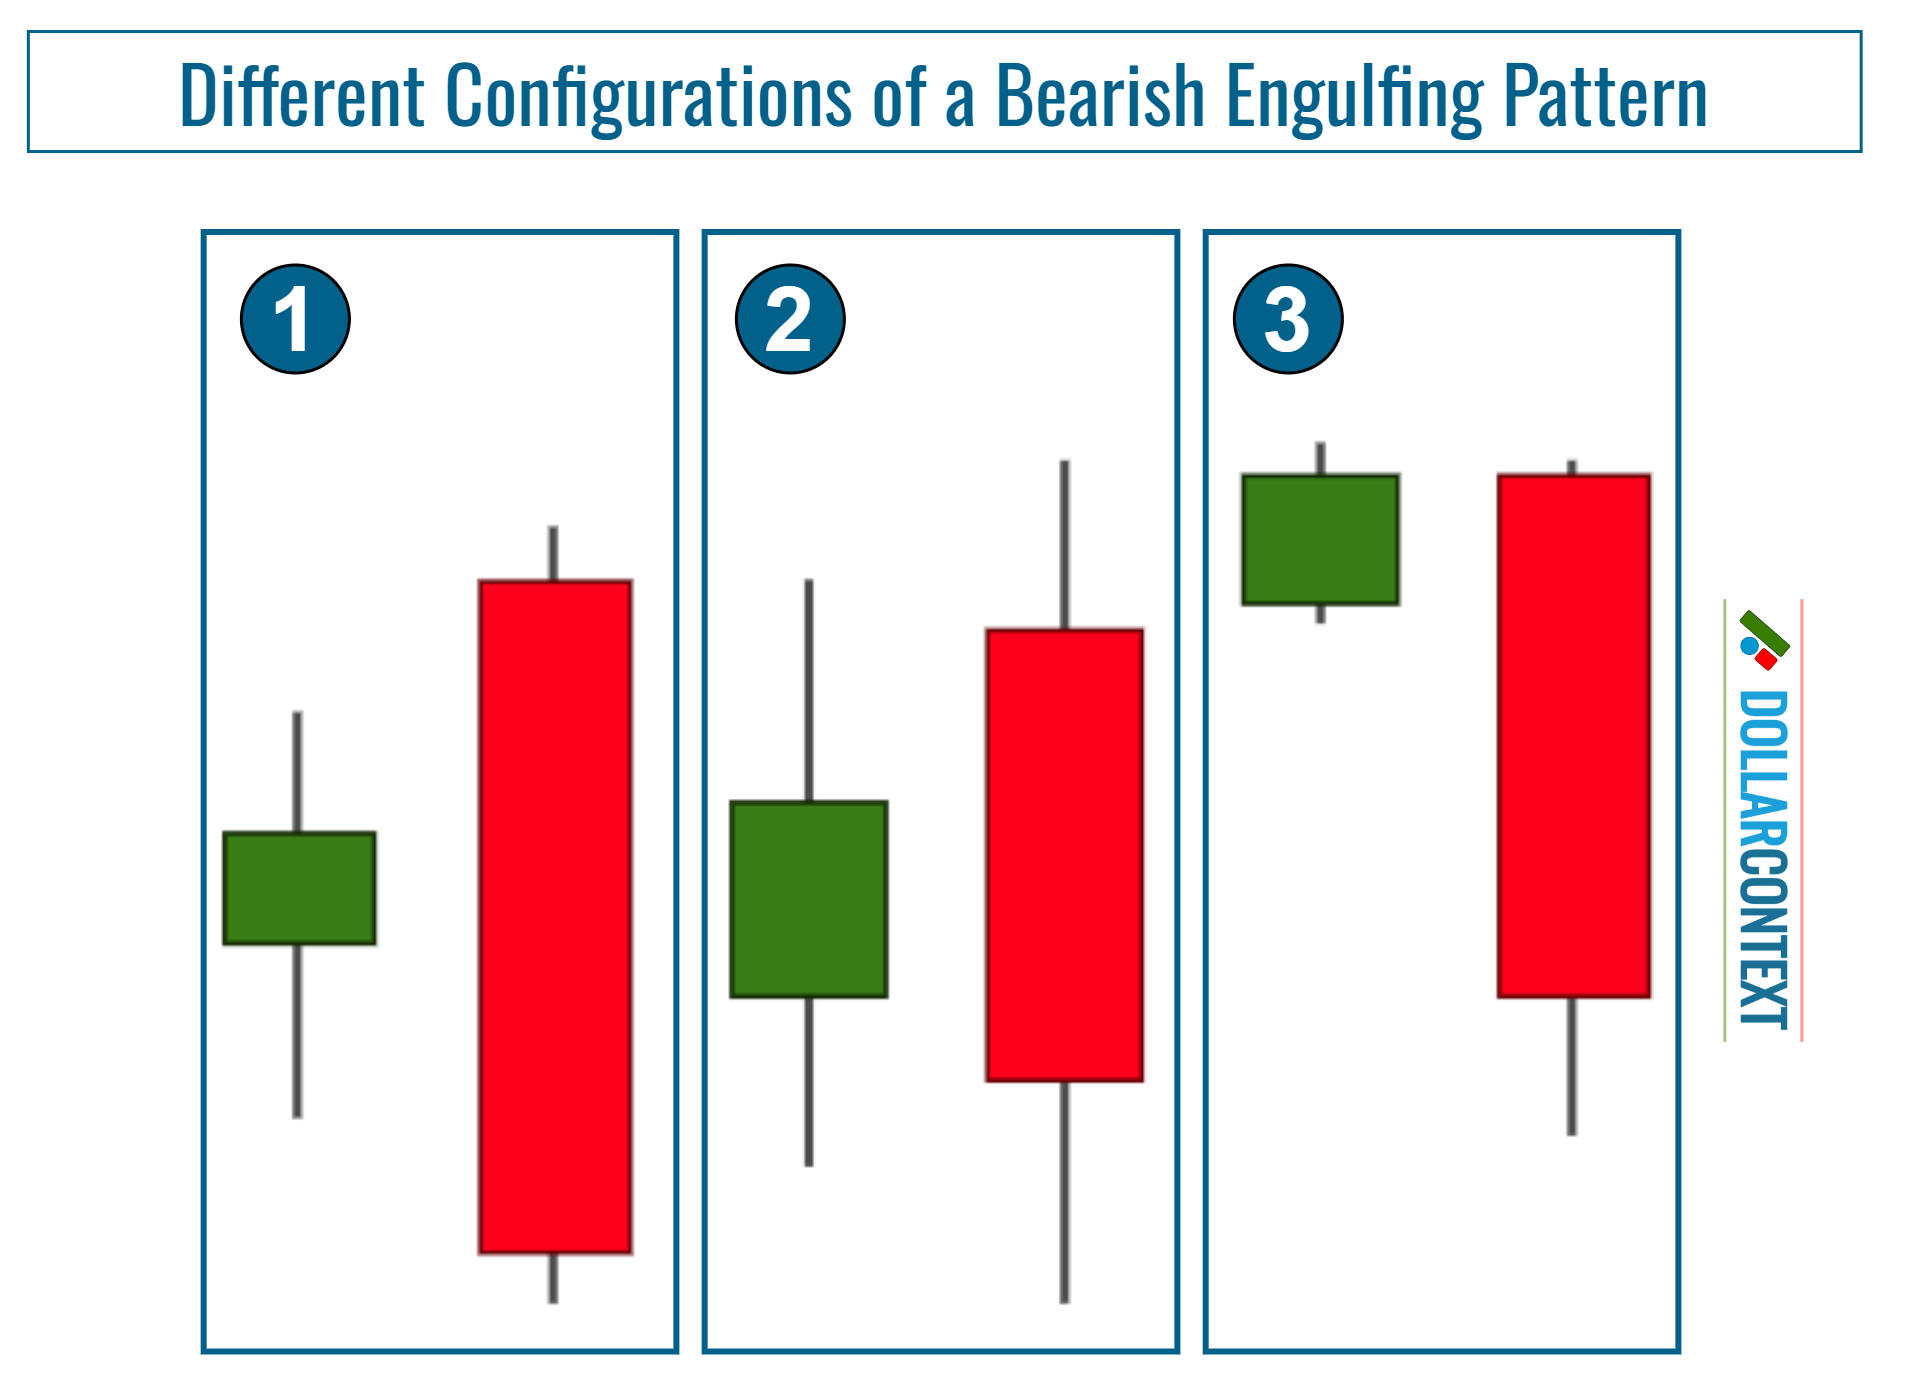
These are the major variations for a bearish engulfing pattern:
2. Context
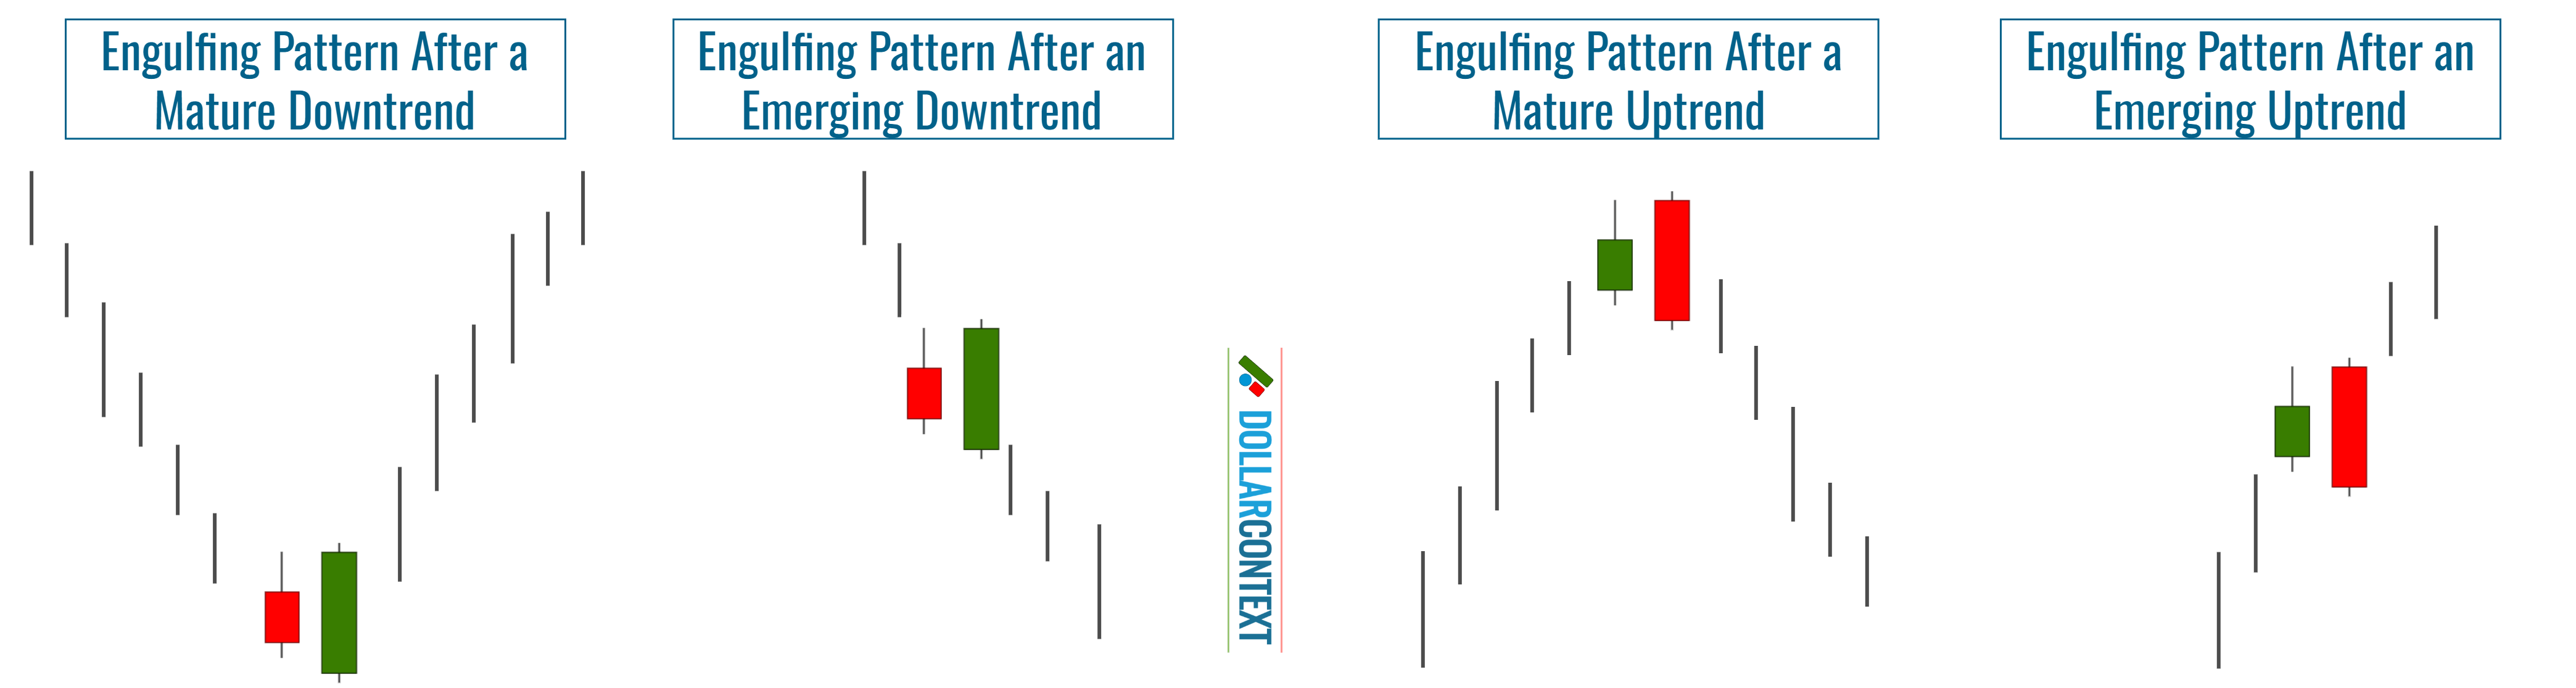
When assessing the implications of an engulfing pattern, the context in which this formation appears is as relevant as the two-candle combination itself.
The engulfing pattern reflects a shift in market sentiment and potentially a trend reversal. Hence, the pattern should appear in the context of a clearly identifiable trend.
Mature vs. Emerging Trends: A bullish engulfing pattern following a significant downward movement may indicate a market bottom. However, if the market has only recently started its downward trajectory, the chances of it being at its low are diminished. The same logic holds when a bearish engulfing pattern emerges in an upward move.
In sideways trading conditions, an engulfing pattern serves as a neutral sign, indicating slight market uncertainty. However, when the pattern appears near the upper or lower limit of a wide trading range, it may signal a potential move toward the opposite end of that range.
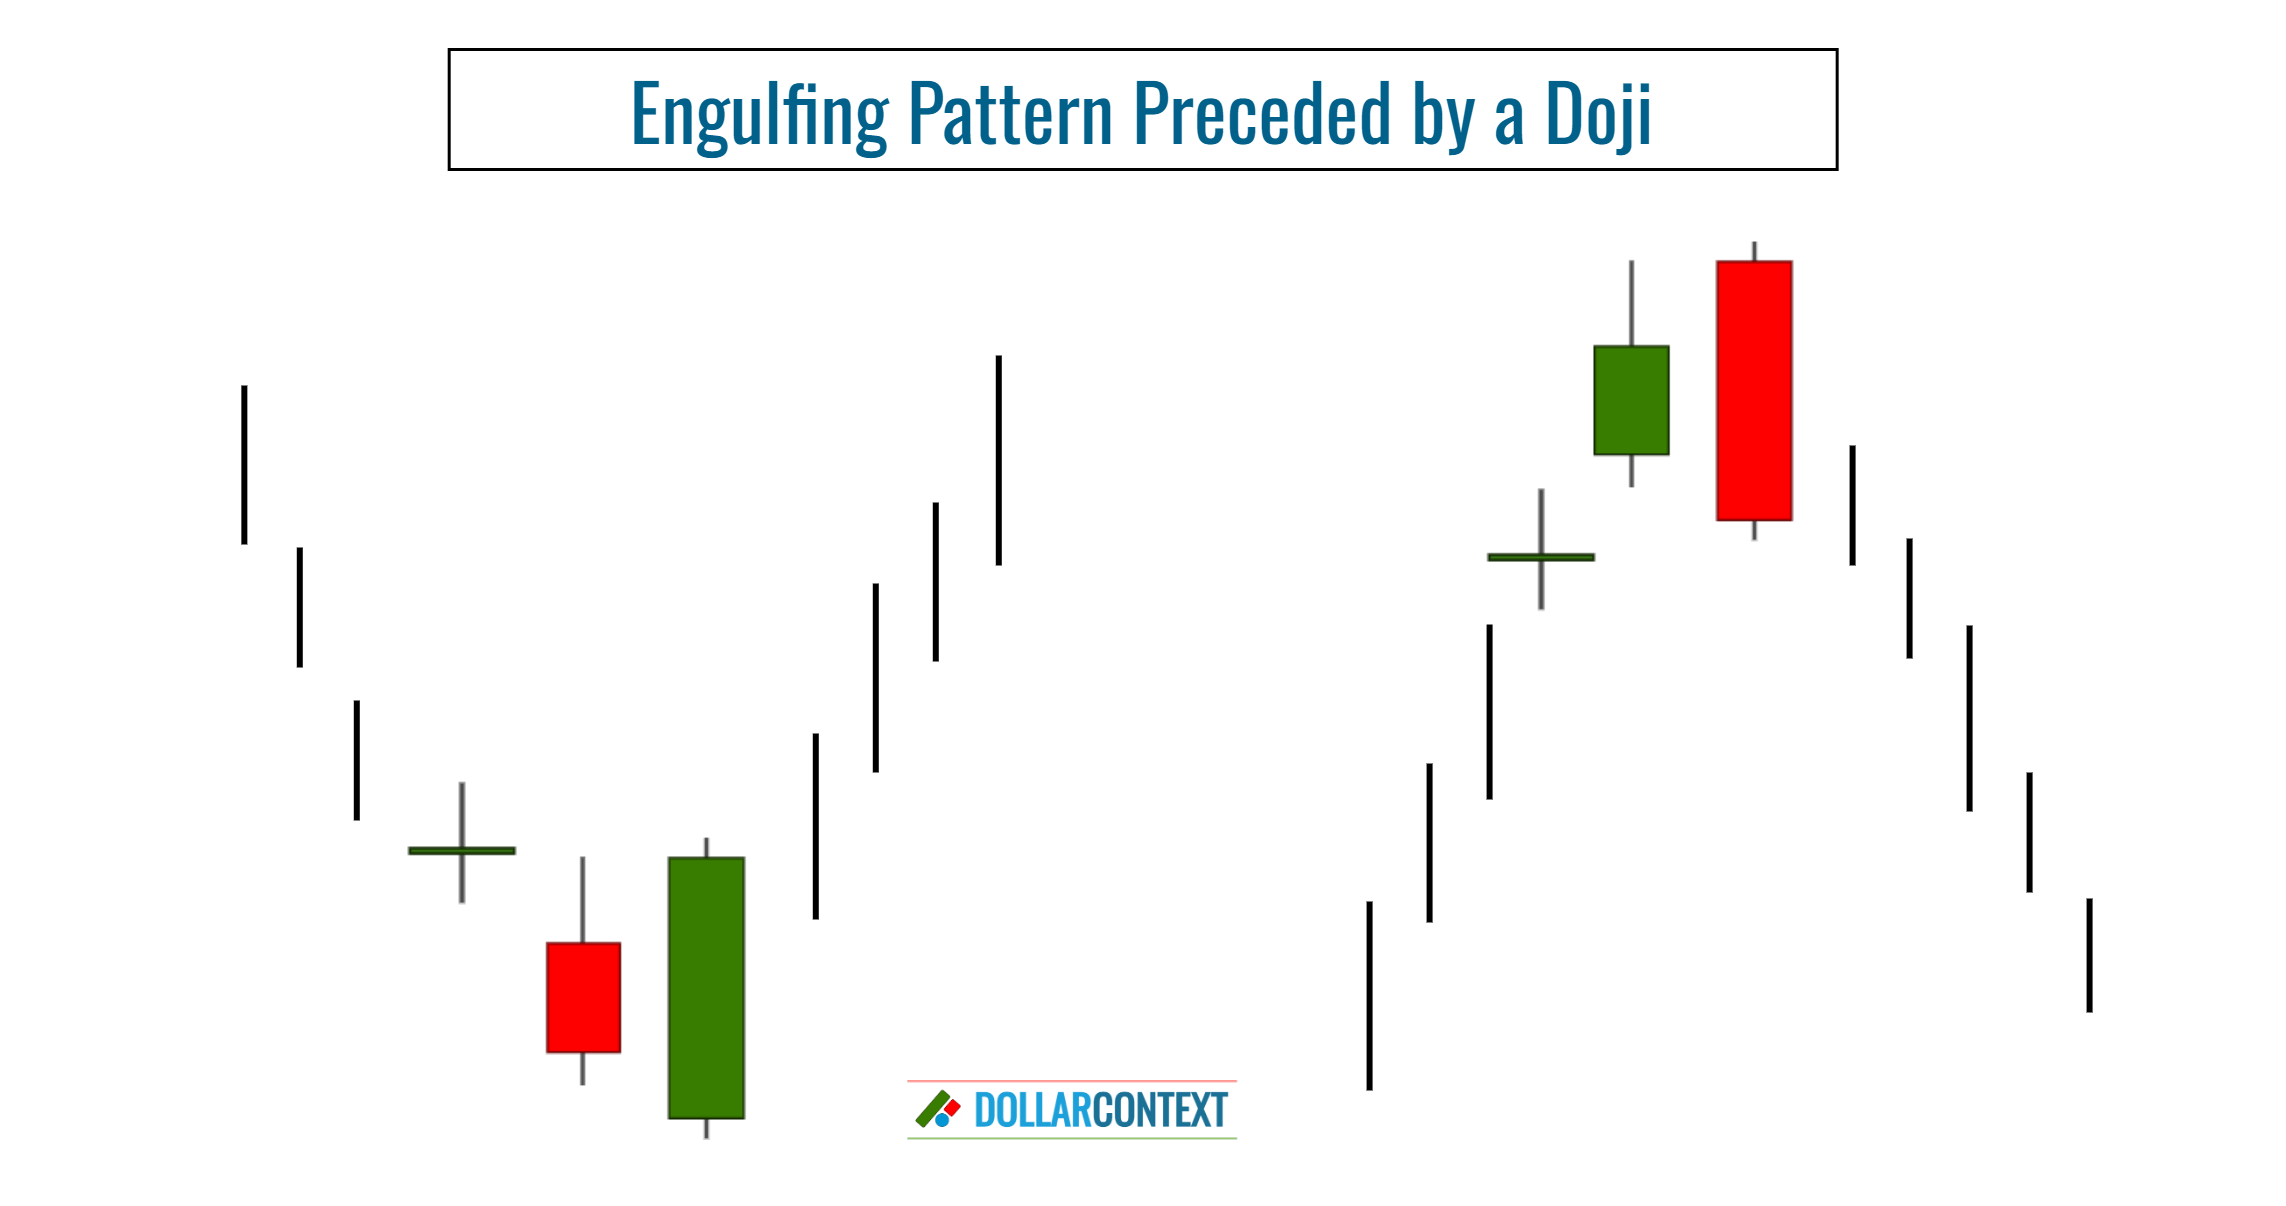
An engulfing pattern becomes particularly relevant when it arises after a doji. In this scenario, the pattern is considered a strong reversal signal.
When determining the reliability of the engulfing pattern as a reversal indicator, consider these additional contextual elements:
- Disparity in Body Size: A more significant engulfing pattern will have a smaller first body and a larger second body. If the two candles are nearly identical in size, the market may move into a sideways trend rather than reversing.
- Engulfing Multiple Prior Sessions: An engulfing pattern that envelops the real bodies of several previous sessions is seen as more impactful. This is because the strength needed to overshadow multiple sessions suggests a potent shift in market sentiment.
- Presence in Support/Resistance Zones: An engulfing pattern that appears in an established support or resistance area greatly enhances its reversal implications.
- Confluence with Other Reversal Patterns: Sometimes, an engulfing pattern is accompanied by other reversal patterns in the same price range. The combined presence of these patterns increases the chances of an authentic reversal.
- Market Extremes: The likelihood of a reversal is higher if the market is approaching extreme oversold or overbought levels.
3. Psychology Behind an Engulfing Pattern
Psychologically, an engulfing pattern reflects a potential shift in market sentiment.
The pattern graphically illustrates a shift in market control between opposing forces. In the case of a bullish engulfing pattern, it signifies that the bulls have successfully overtaken the bears. Conversely, a bearish engulfing pattern indicates that the bears, backed by a surge in supply, have taken the reins from the bulls.
4. Entry Points
When opening a position based on an engulfing pattern, you can implement the strategies detailed below.
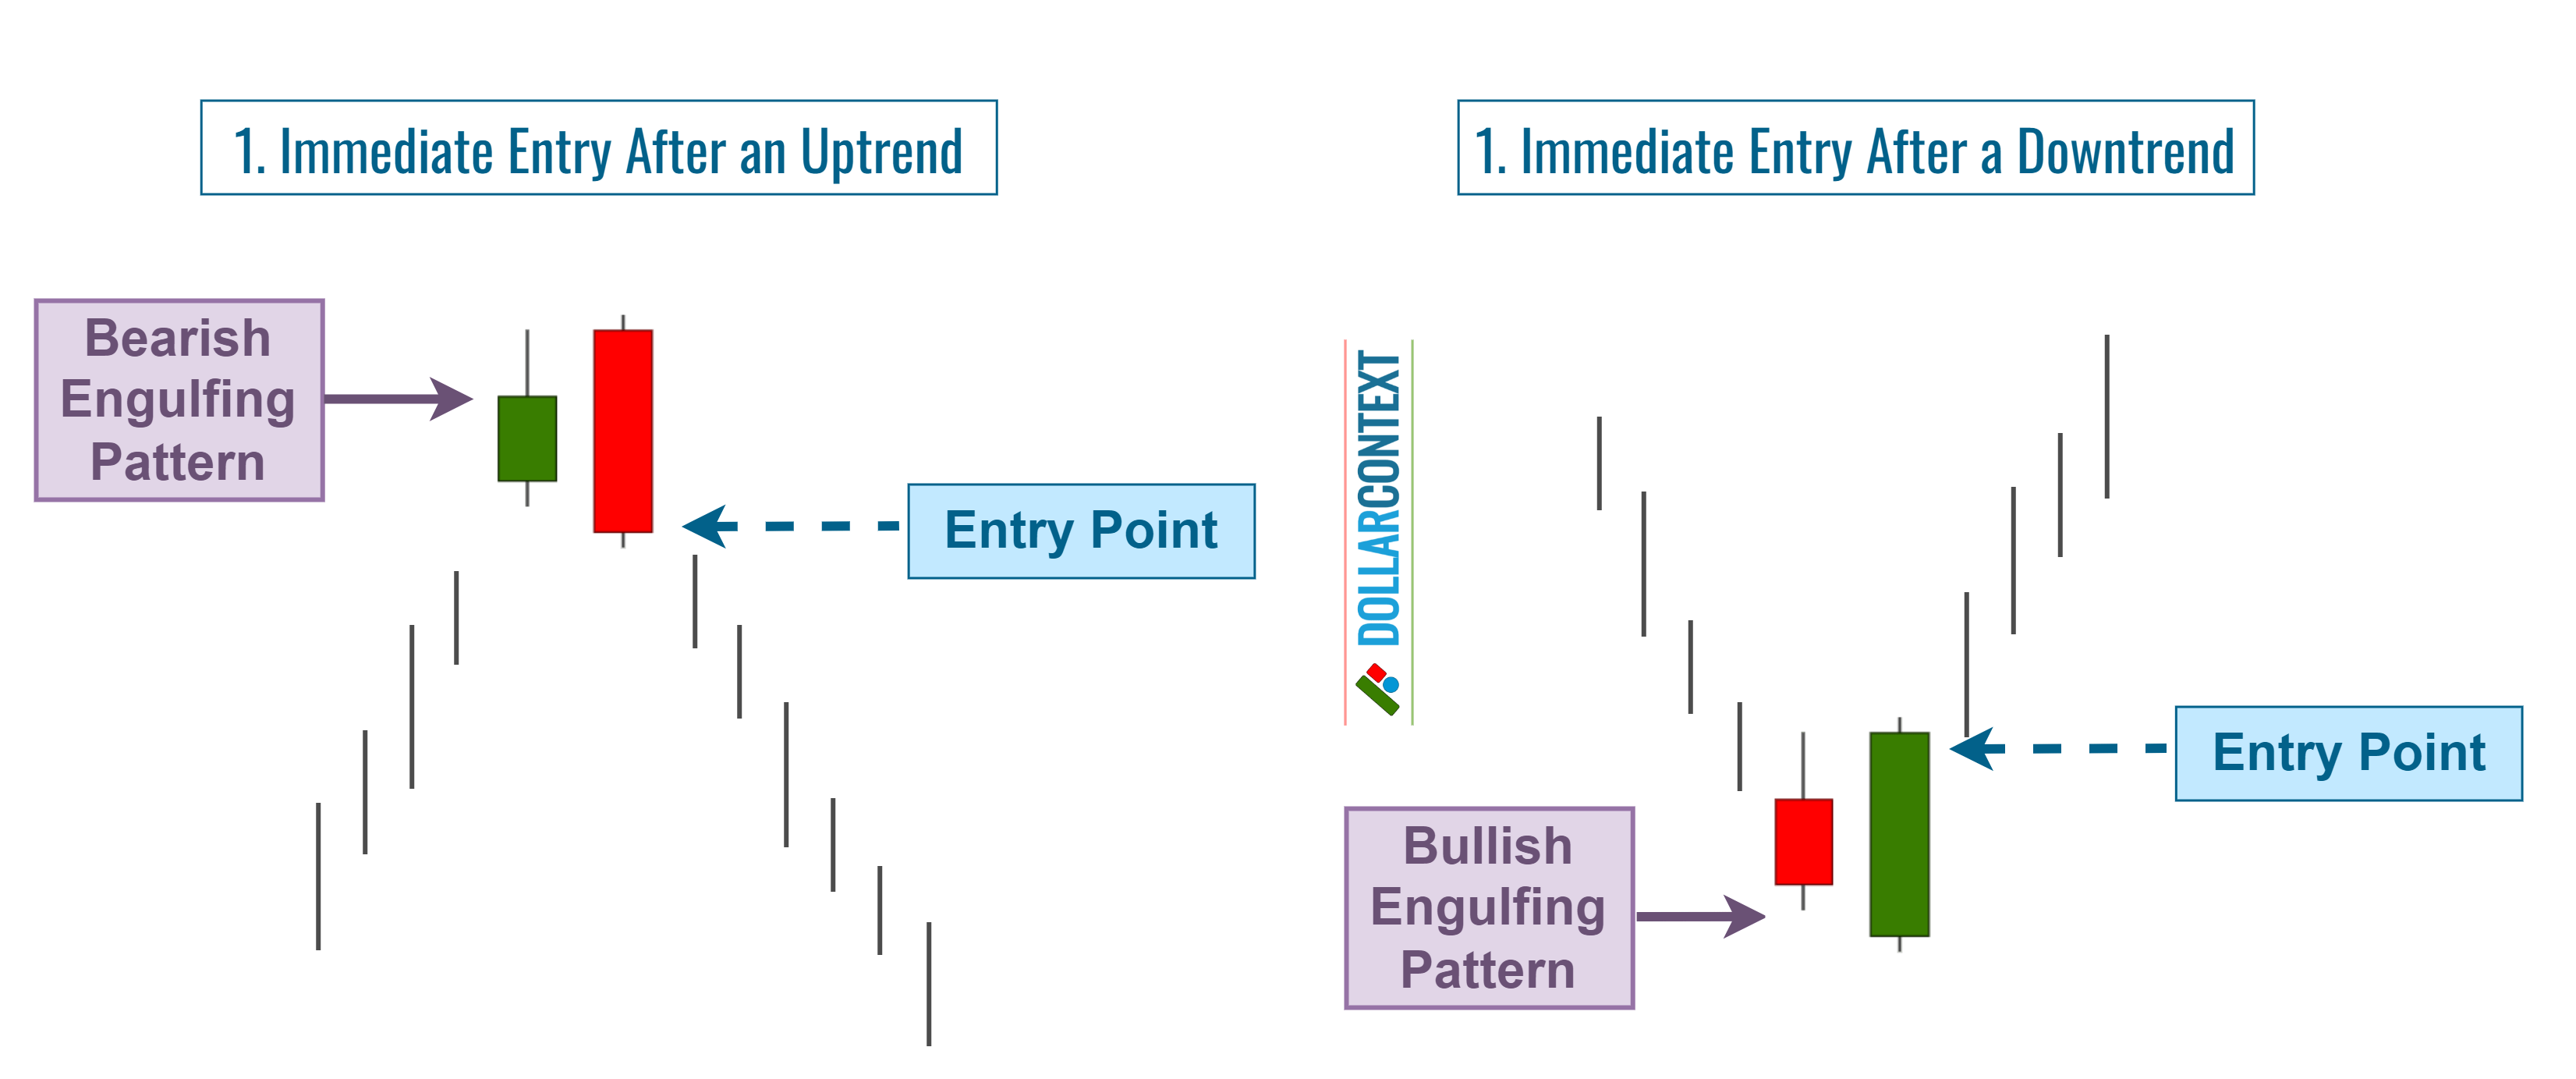
4.1 Immediate Entry
After the formation of the engulfing pattern, you could consider entering a position if the preceding trend is well-established and additional technical indicators suggest an impending reversal. This approach is more aggressive and relies on anticipating a quick market turnaround.
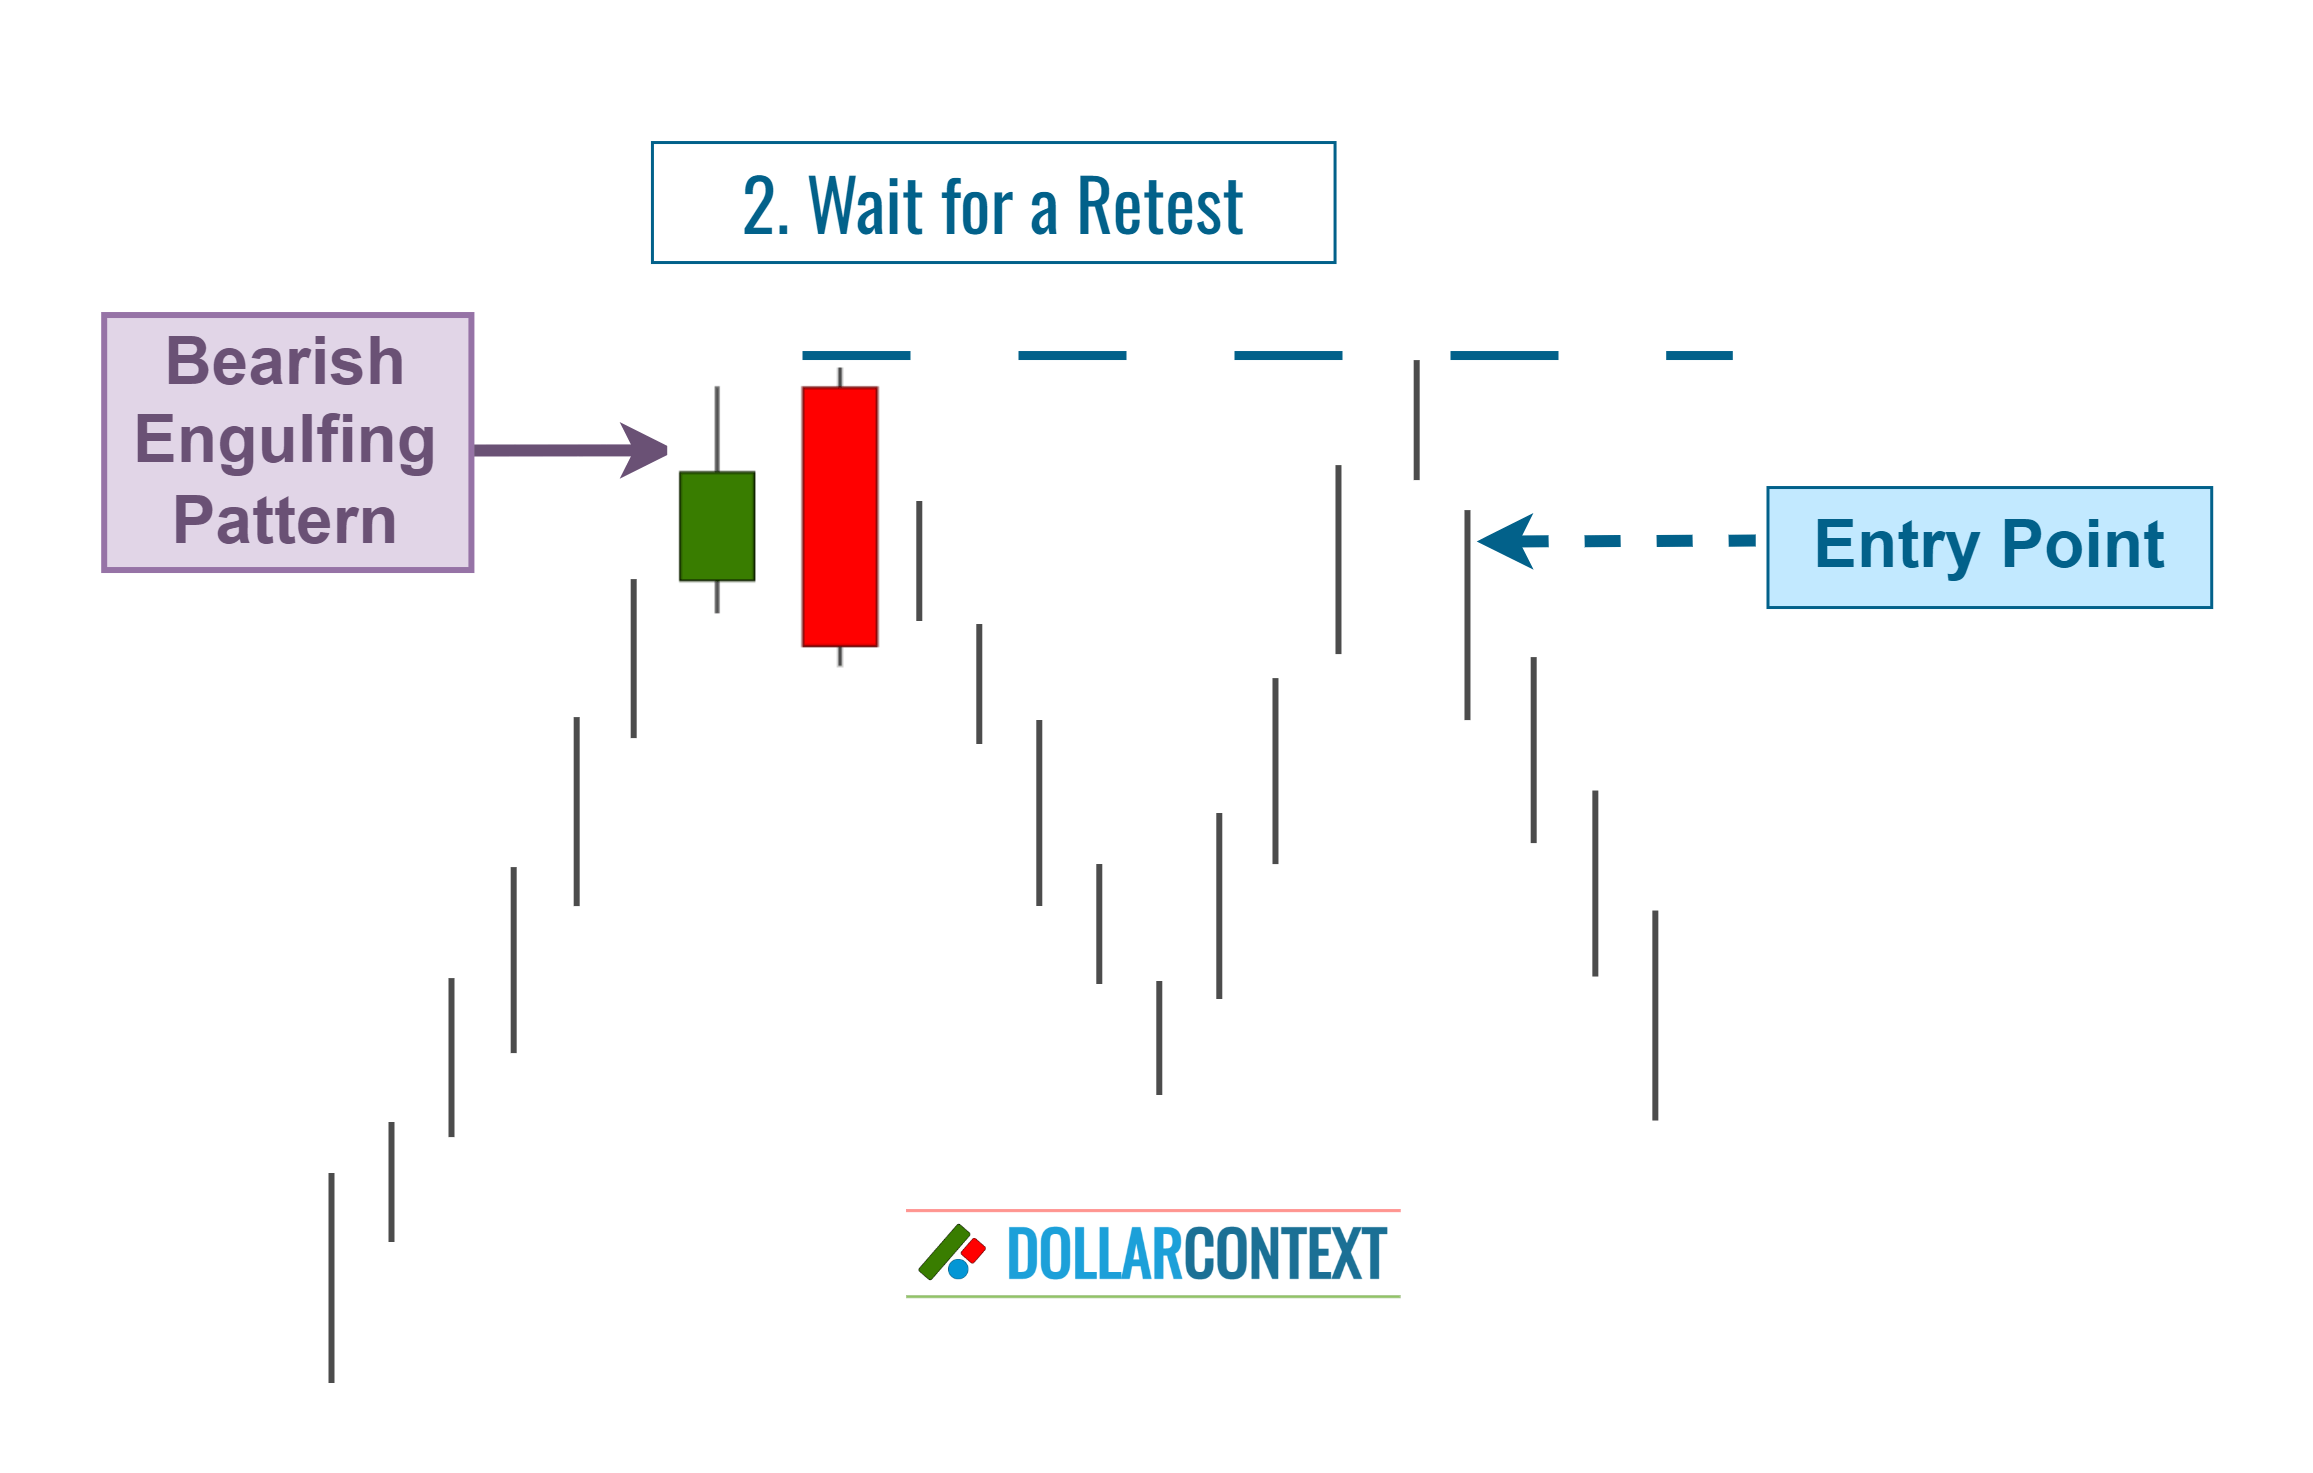
4.2 Wait for a Retest
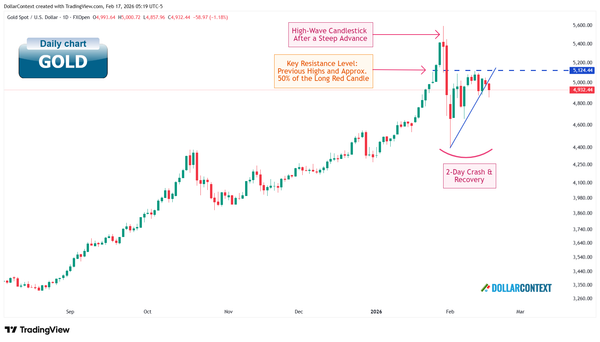
It's important to recognize that after a robust or mature downtrend, the appearance of a bullish engulfing pattern might still face residual selling pressure in the short term. As a result, the initial upward move may not be trustworthy, causing the market to retest the lows of the bullish engulfing pattern. This is why some traders prefer to wait for the market to revisit the lows of the engulfing pattern before opening a long position.
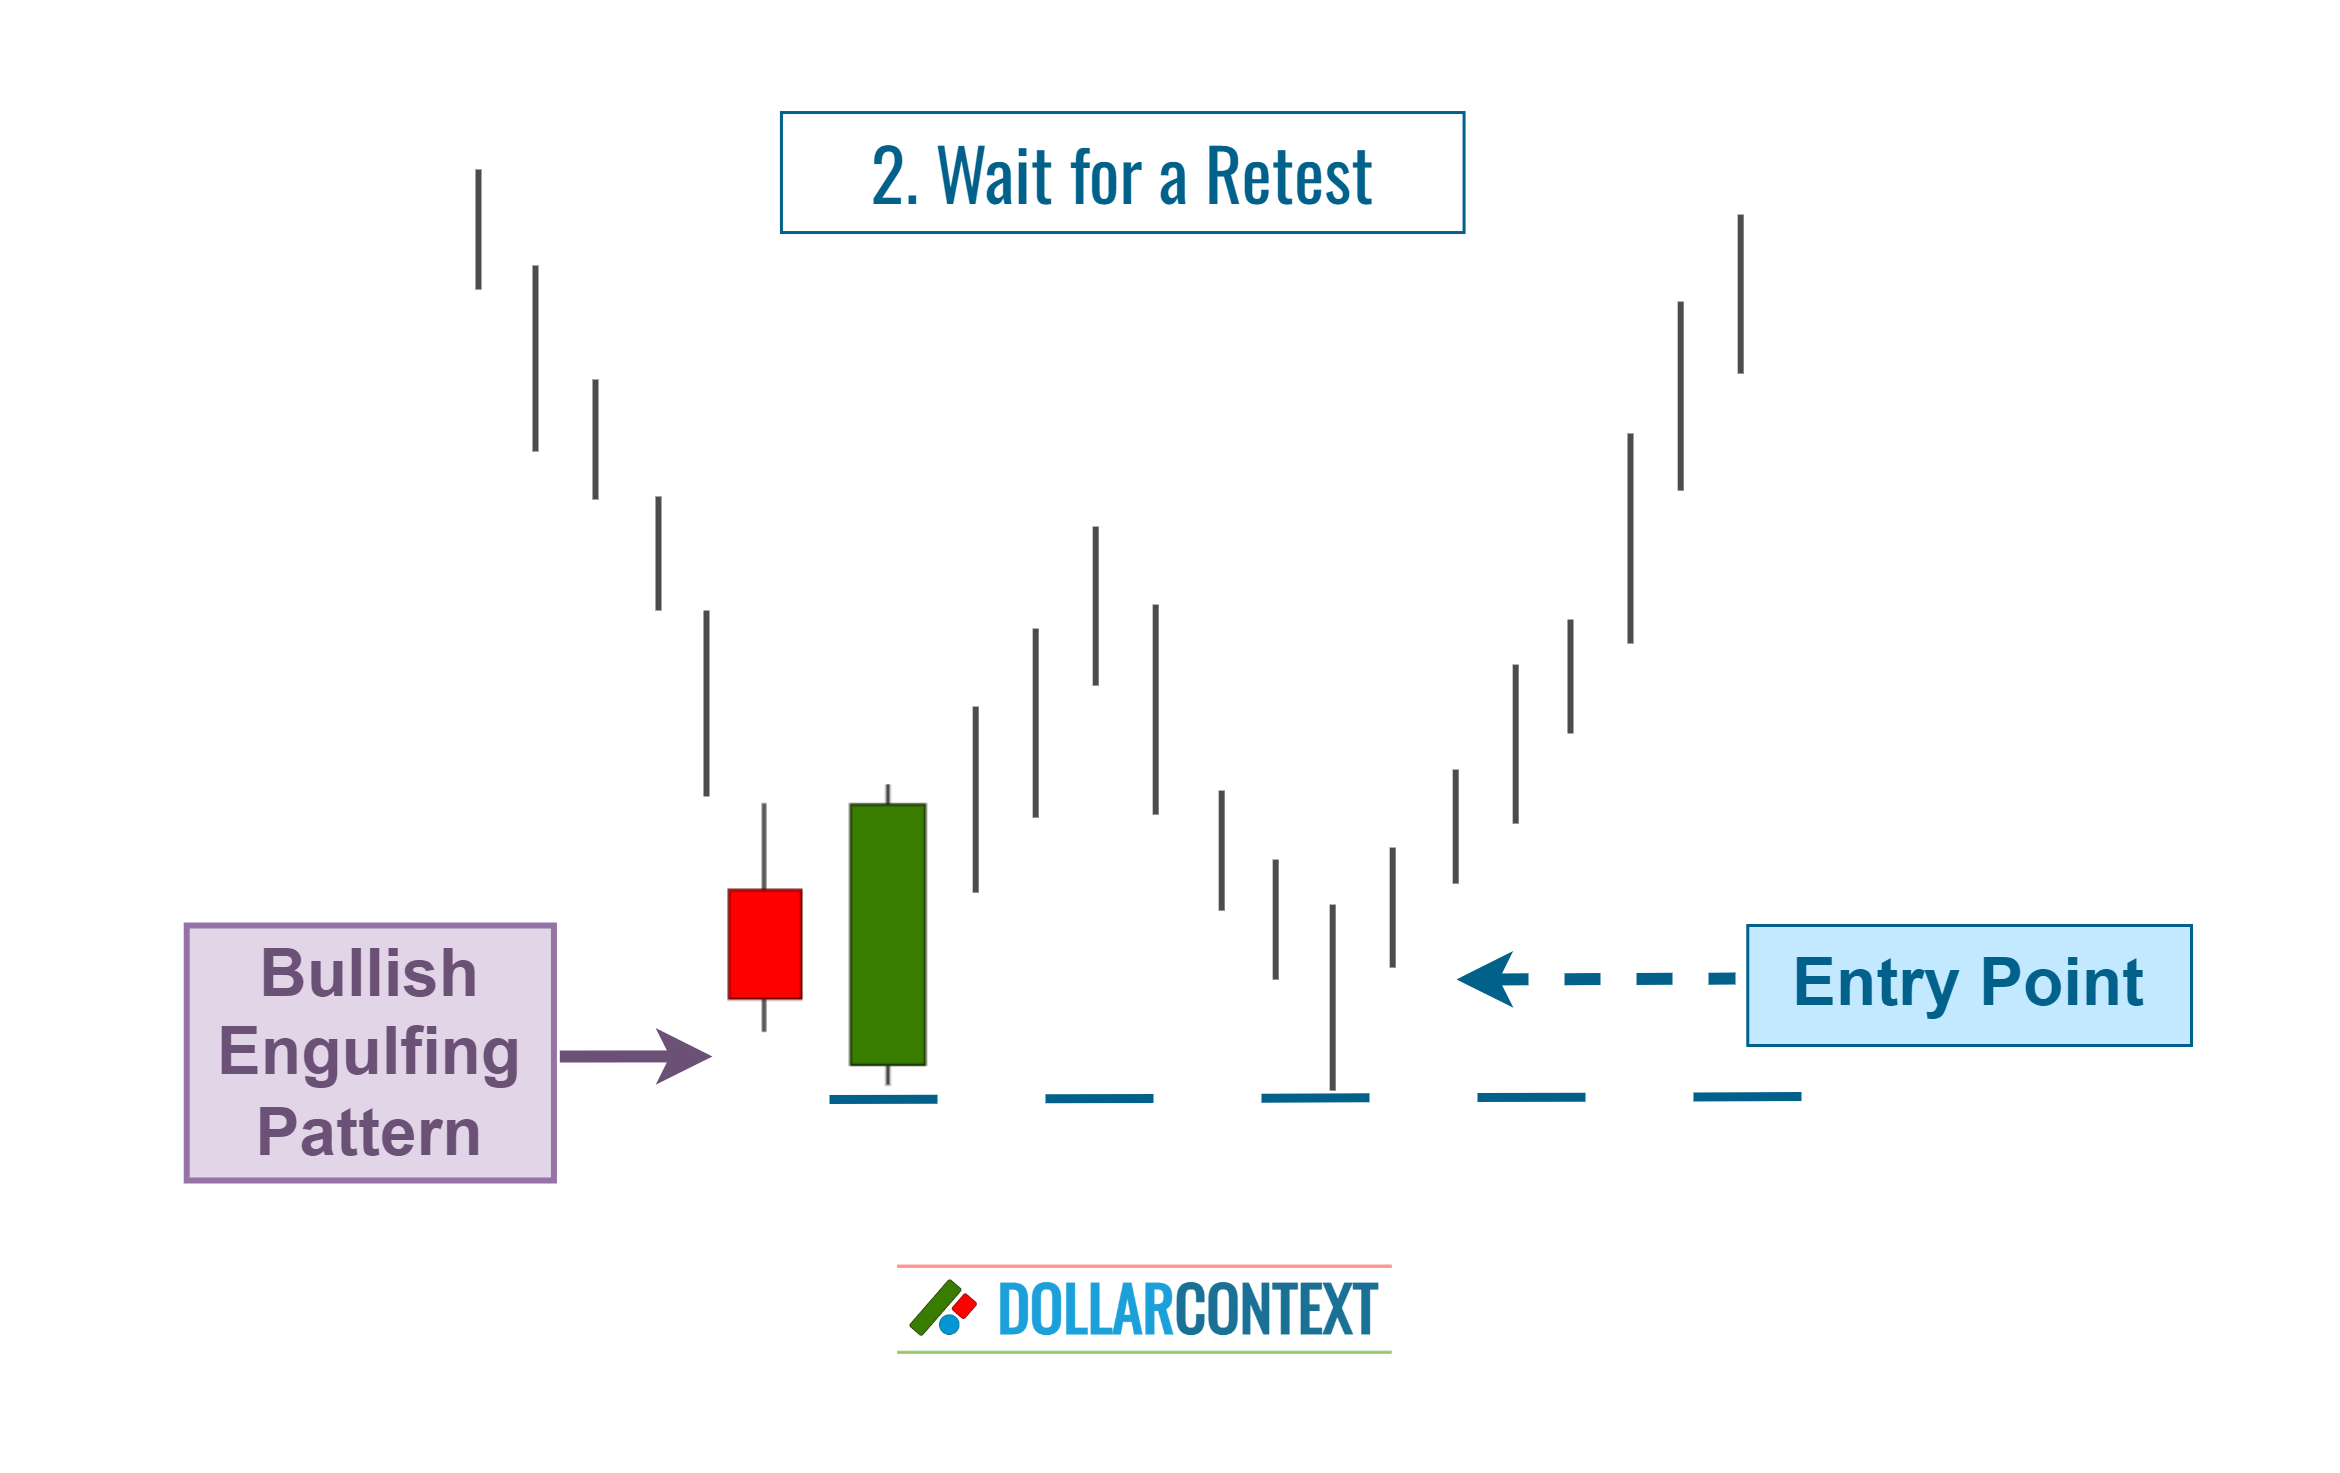
The image below illustrates the same concept in the opposite scenario.
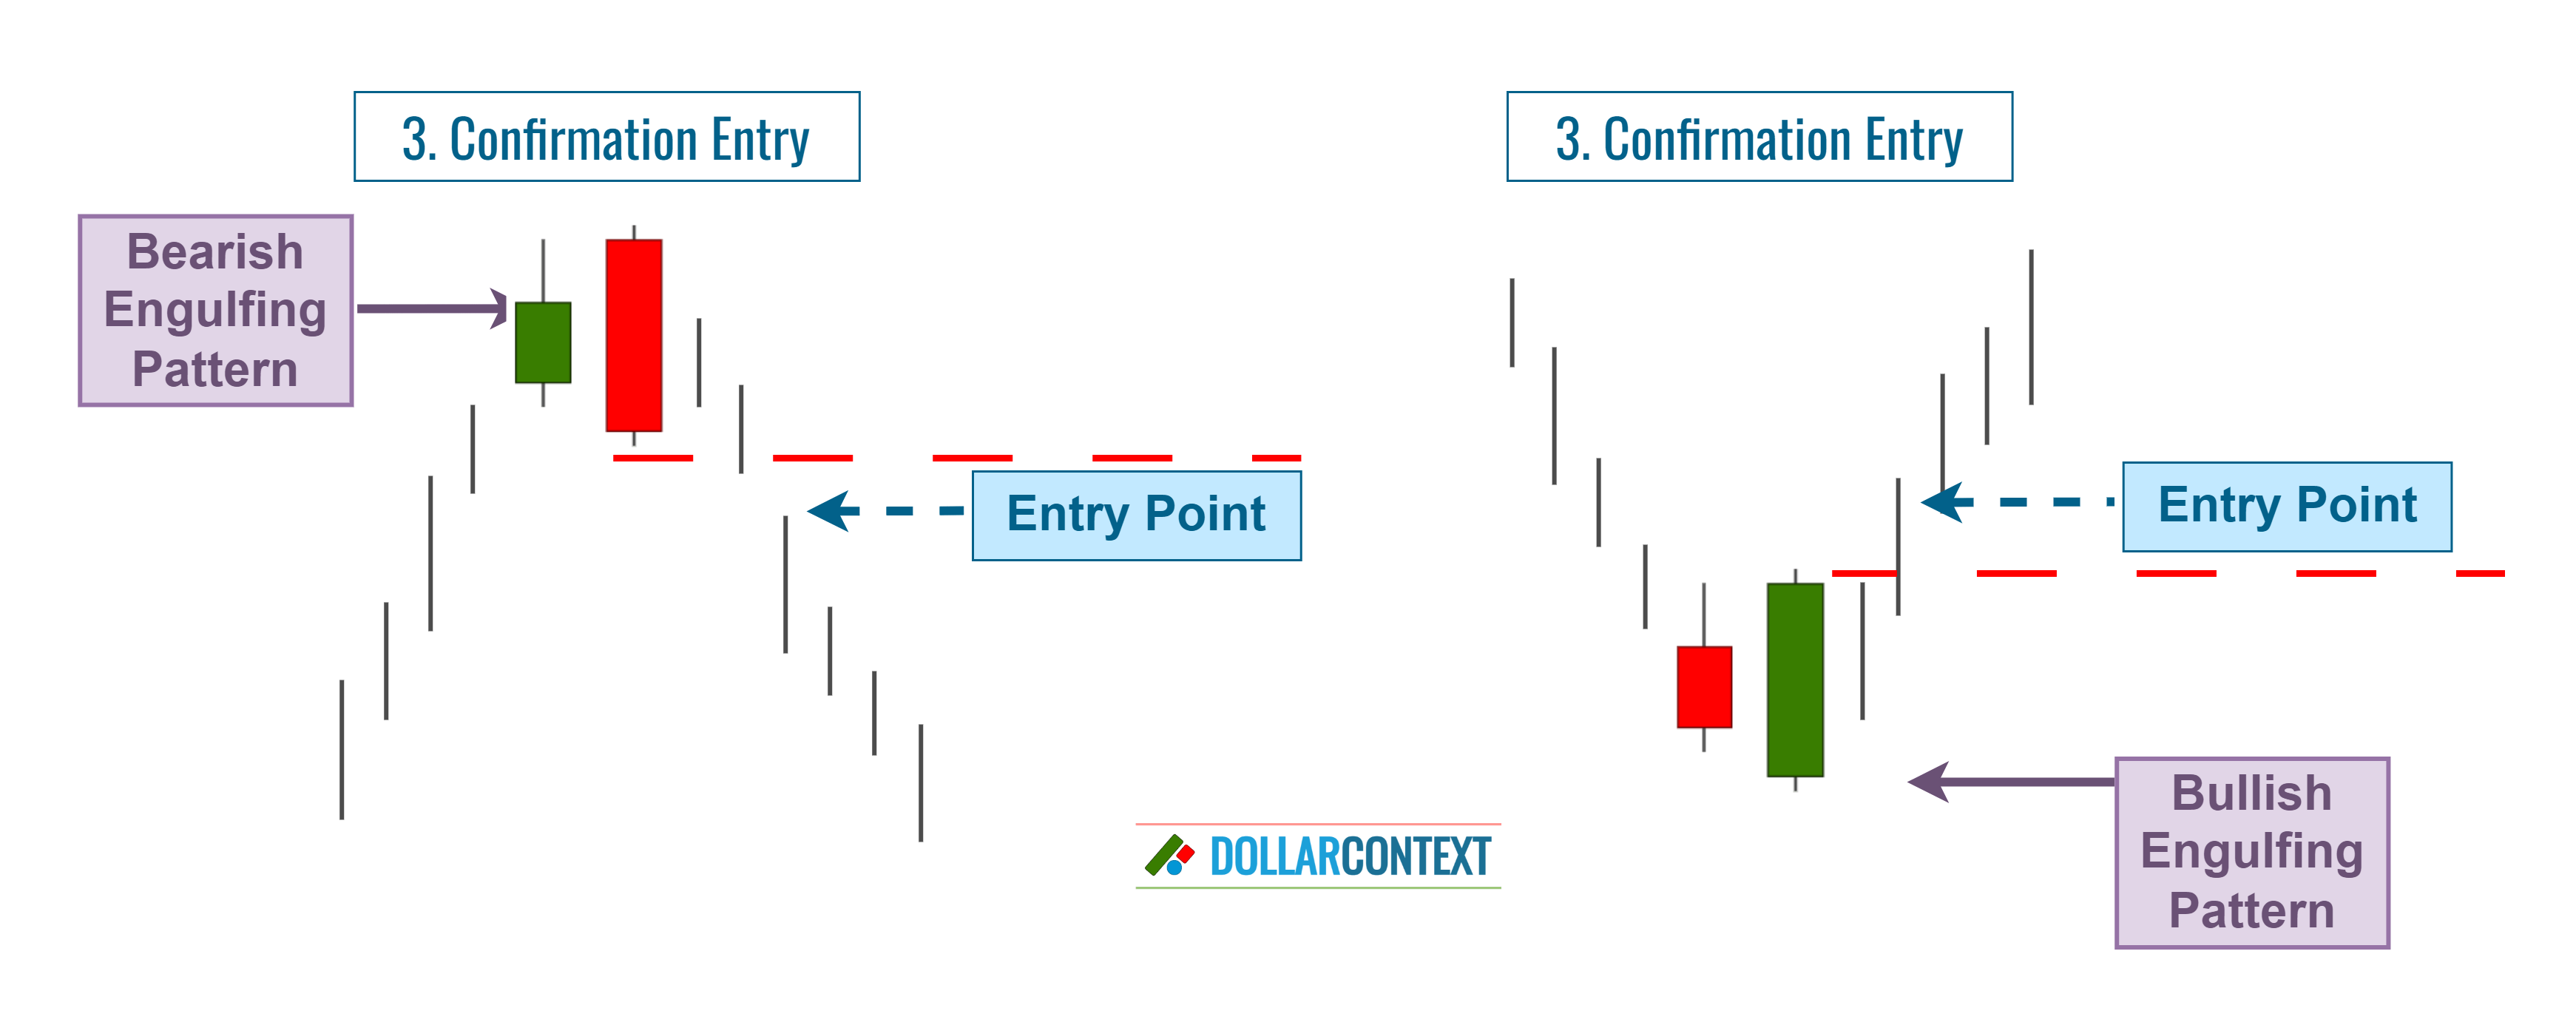
4.3 Confirmation
Begin a position when the price validates the direction of the new, emerging trend. This strategy seeks to confirm a strong momentum shift before committing.
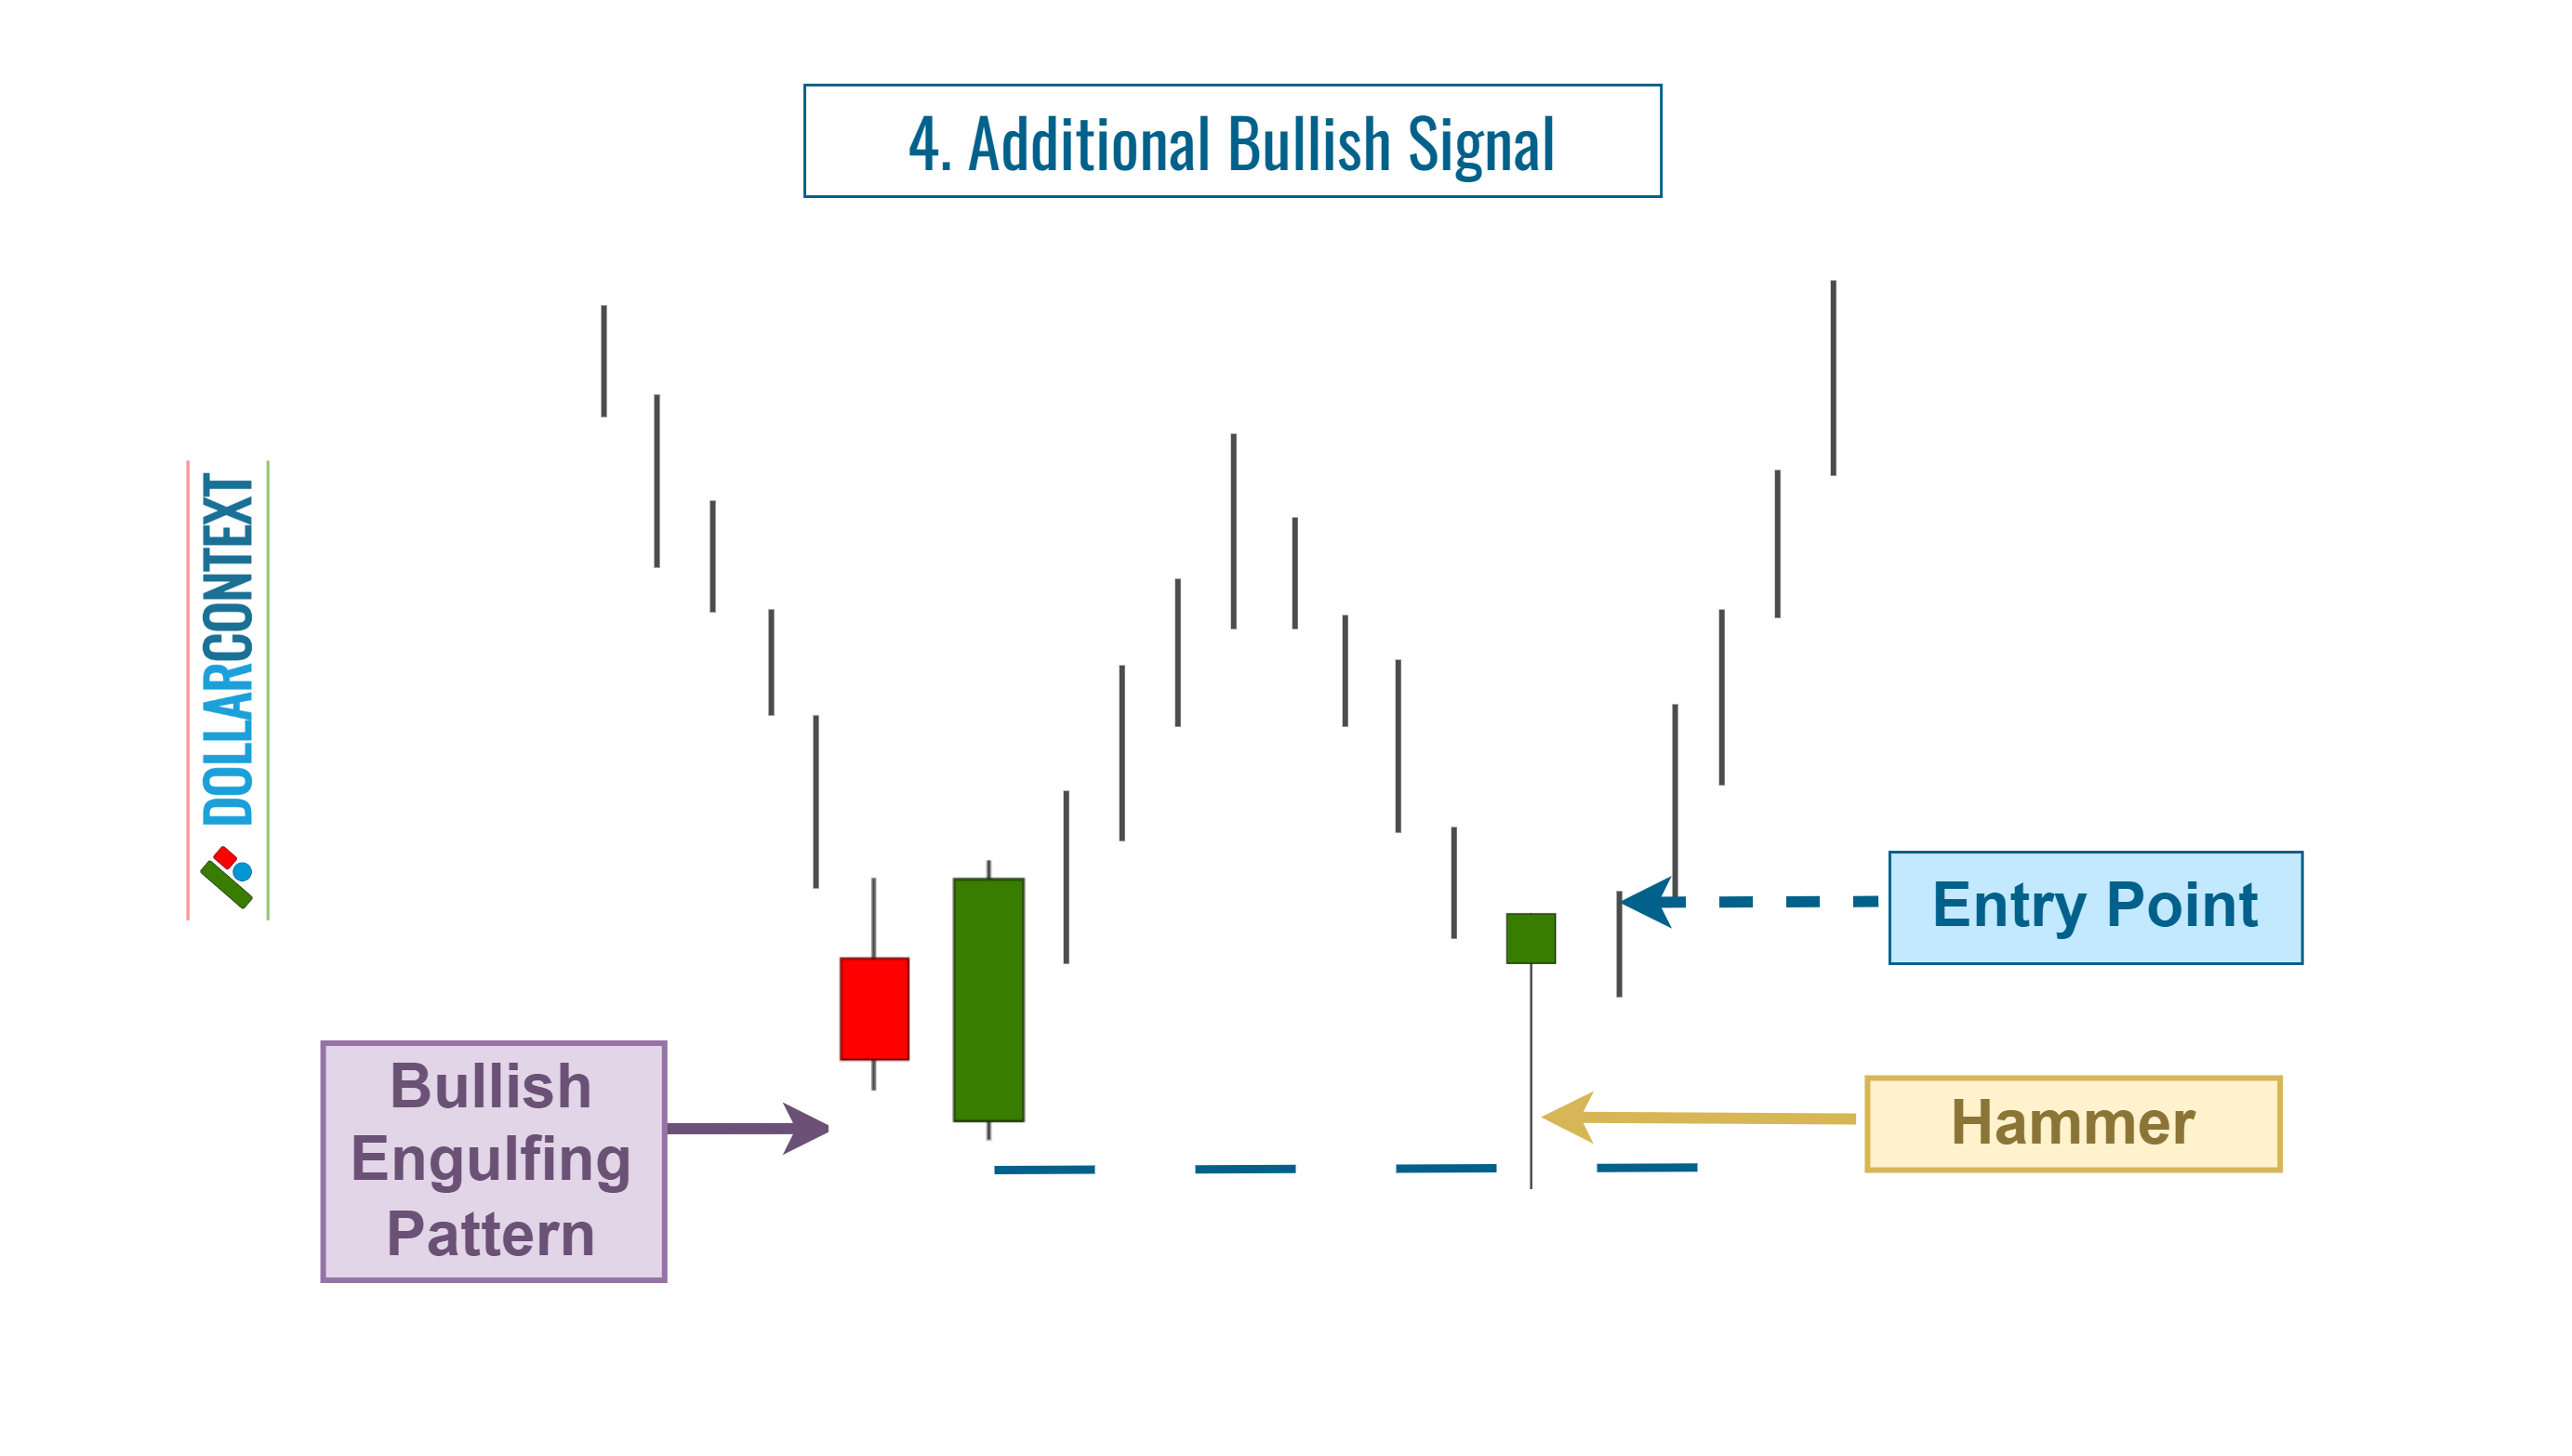
4.4 On an Additional Bullish Signal
After the engulfing session, wait until another reversal candlestick pattern or signal emerges, increasing the probability of a trend shift. This could take the form of a hammer, shooting star, or another reversal pattern. Be aware that the pattern that reinforces the probability of the reversal may emerge before the engulfing formation as well.
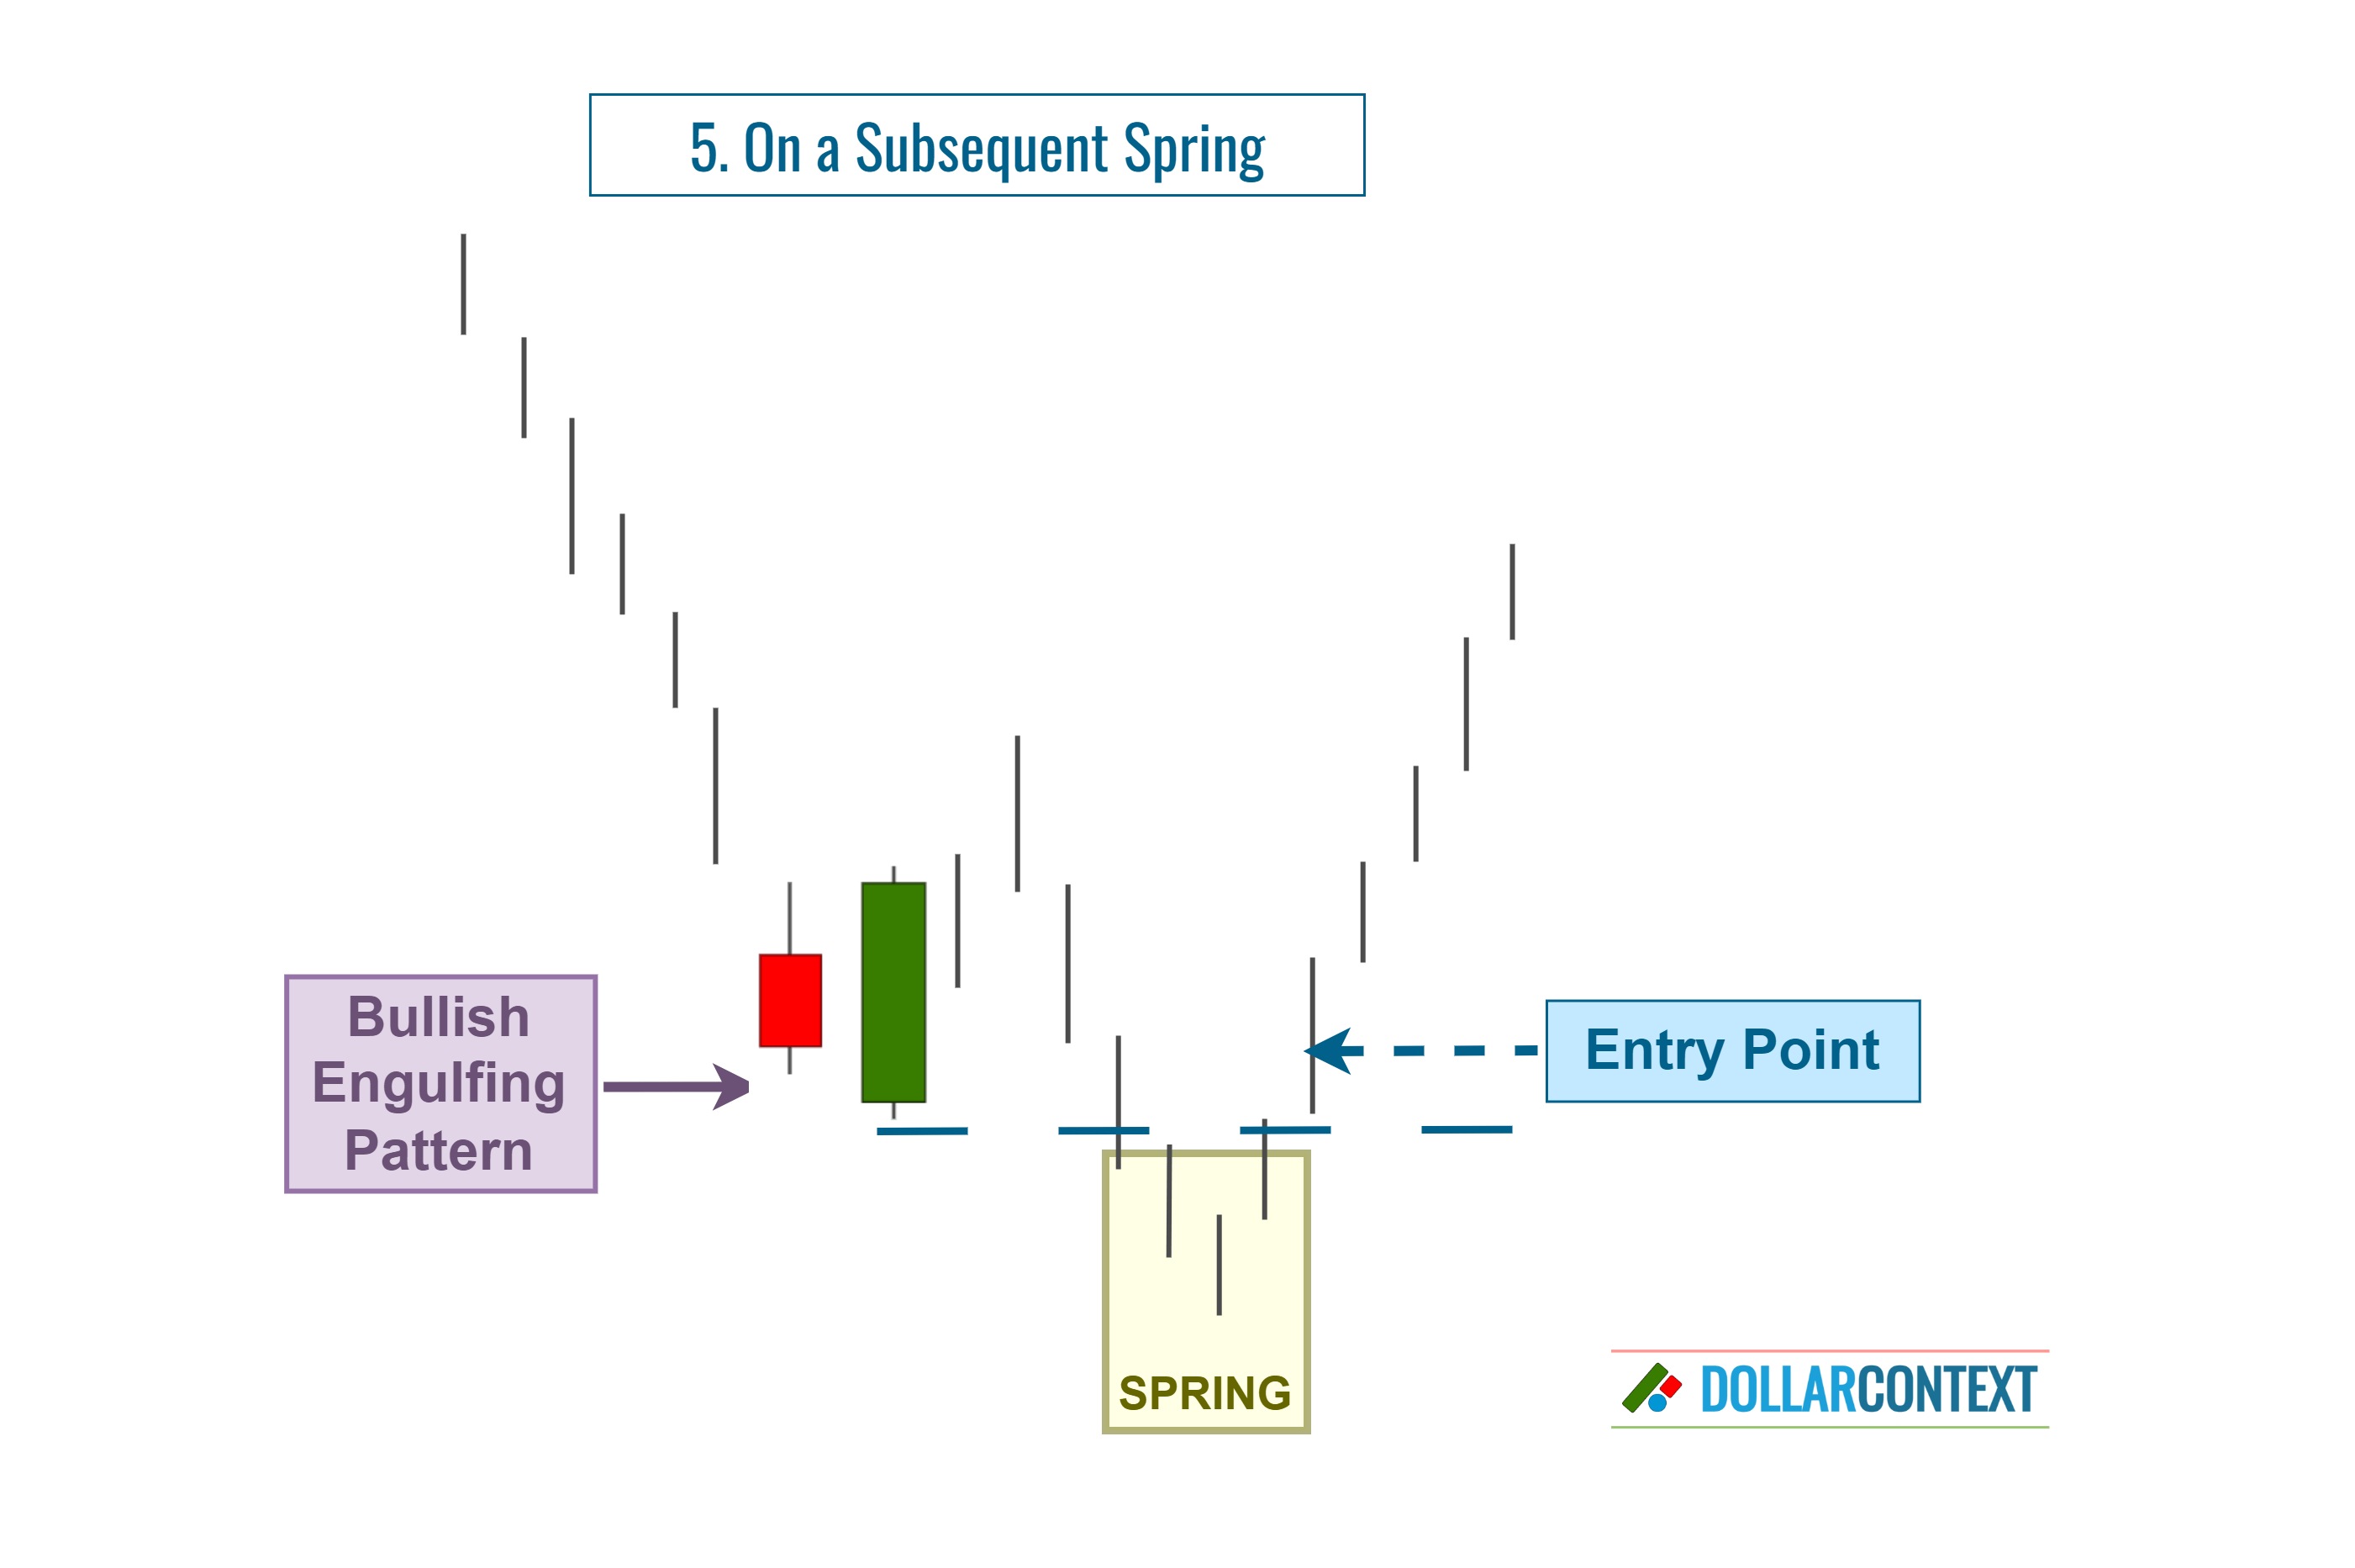
4.5 After a False Breakout (Spring or Upthrust)
A spring represents a situation where the market briefly breaks through a support level, but quickly reverses course to move in the opposite direction. In essence, it's a false downward breakout.
On the flip side, an upthrust takes place when the market briefly exhibits a deceptive breakout to the upside.
Both springs and upthrusts indicate that the breakout might not be sustained, and a reversal into the opposite direction could be imminent.
4.6 Mixed Strategy
A hybrid strategy involves making an initial entry upon spotting an engulfing pattern, and then expanding the position as further confirmation signals appear in the market.
5. Stop-loss
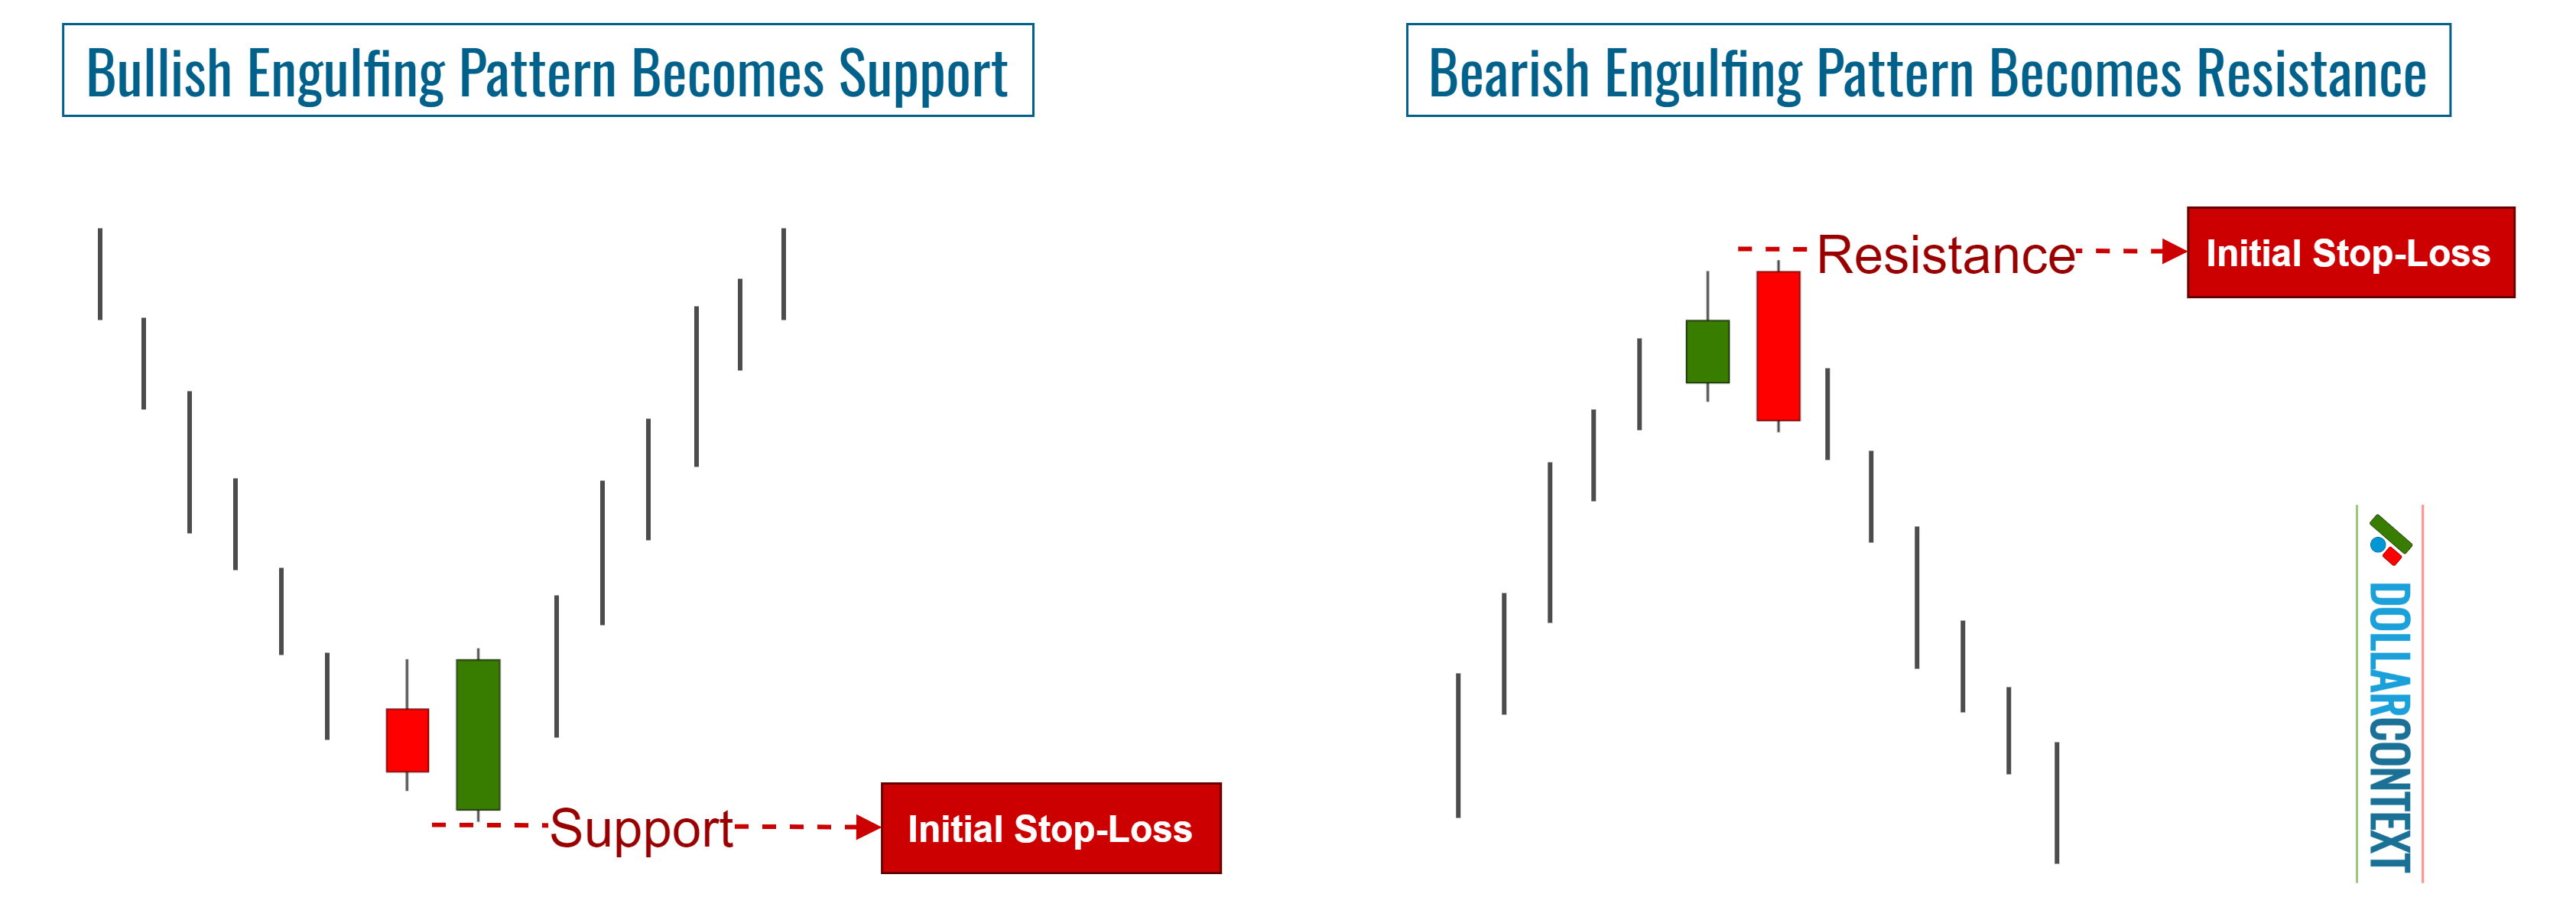
Following a downtrend, the price range of a bullish engulfing pattern becomes support. Similarly, after an uptrend, the price range corresponding to a bearish engulfing pattern becomes a resistance zone. Traders typically use those levels to identify their initial stop-loss for an engulfing pattern.
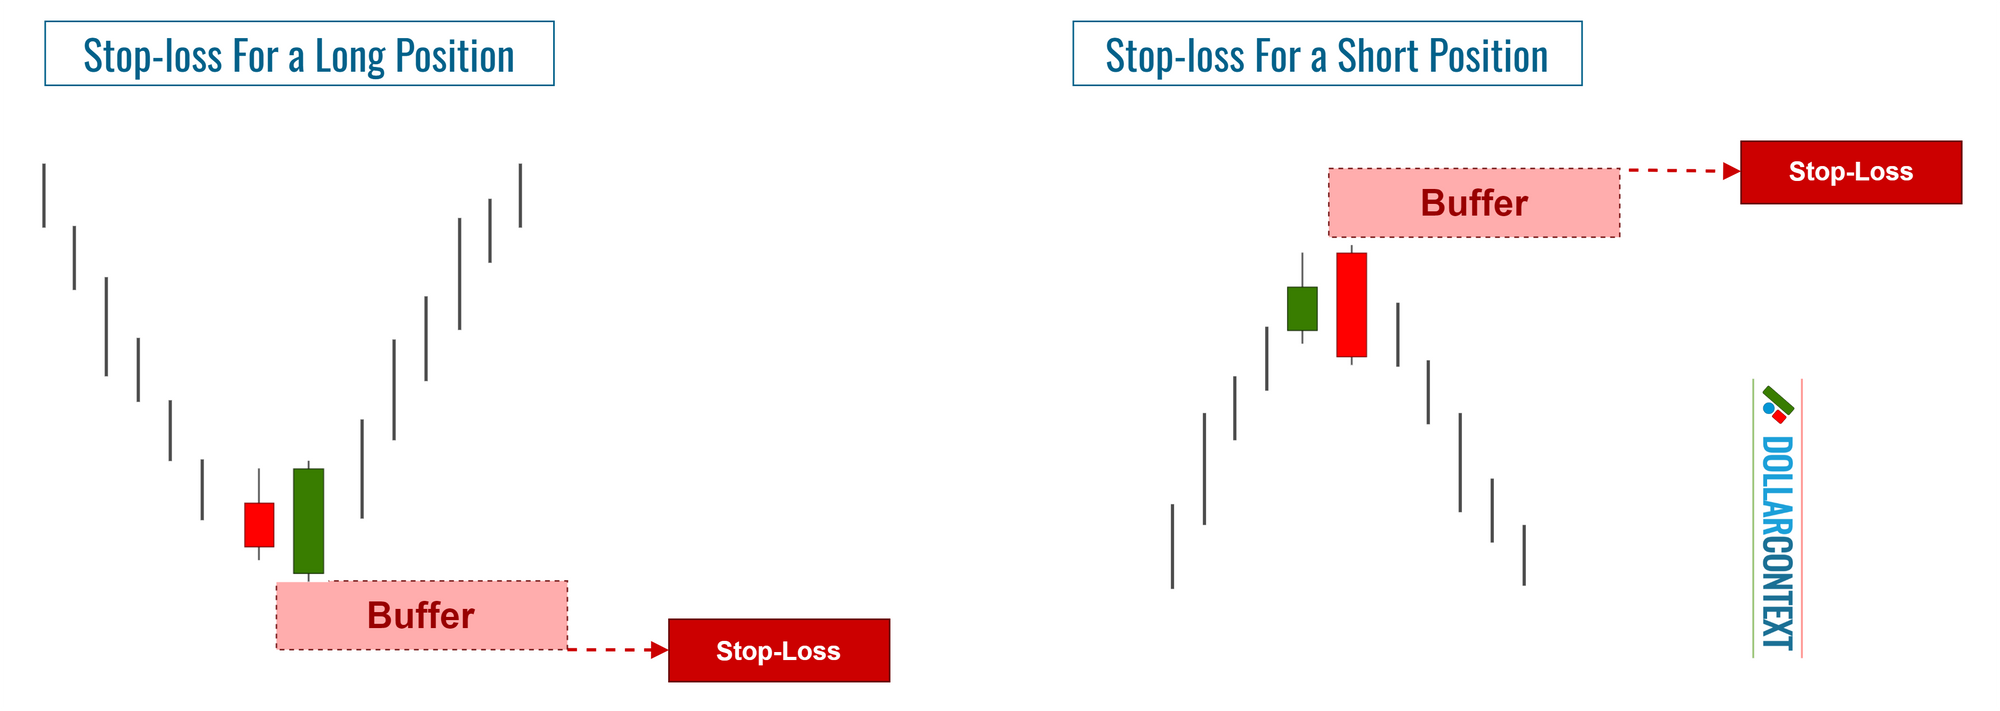
However, to protect against premature exits during volatile sessions or because of false breakouts, consider these two additional elements:
- Add a cushion to counteract the impact of false breakouts.
- Place a stop based on closing prices, rather than relying solely on intra-session price movements.
As your trade unfolds, you might notice further candlestick patterns that strengthen the initial support or resistance set by the engulfing pattern. In these cases, think about modifying your stop-loss to cover the extreme low or high points across these subsequent patterns.
6. Profit Target
While candlestick patterns often serve as valuable indicators for trend changes and possible entry points, they don't inherently offer guidance on when to take profits. For that, you might turn to other techniques like moving averages, traditional chart patterns, or Fibonacci tools, among others.
That being said, if you find yourself in a profitable position initiated by an engulfing pattern, and a new candlestick pattern surfaces suggesting a change in market sentiment, you may want to take this new pattern as a signal to exit your trade.
7. Examples
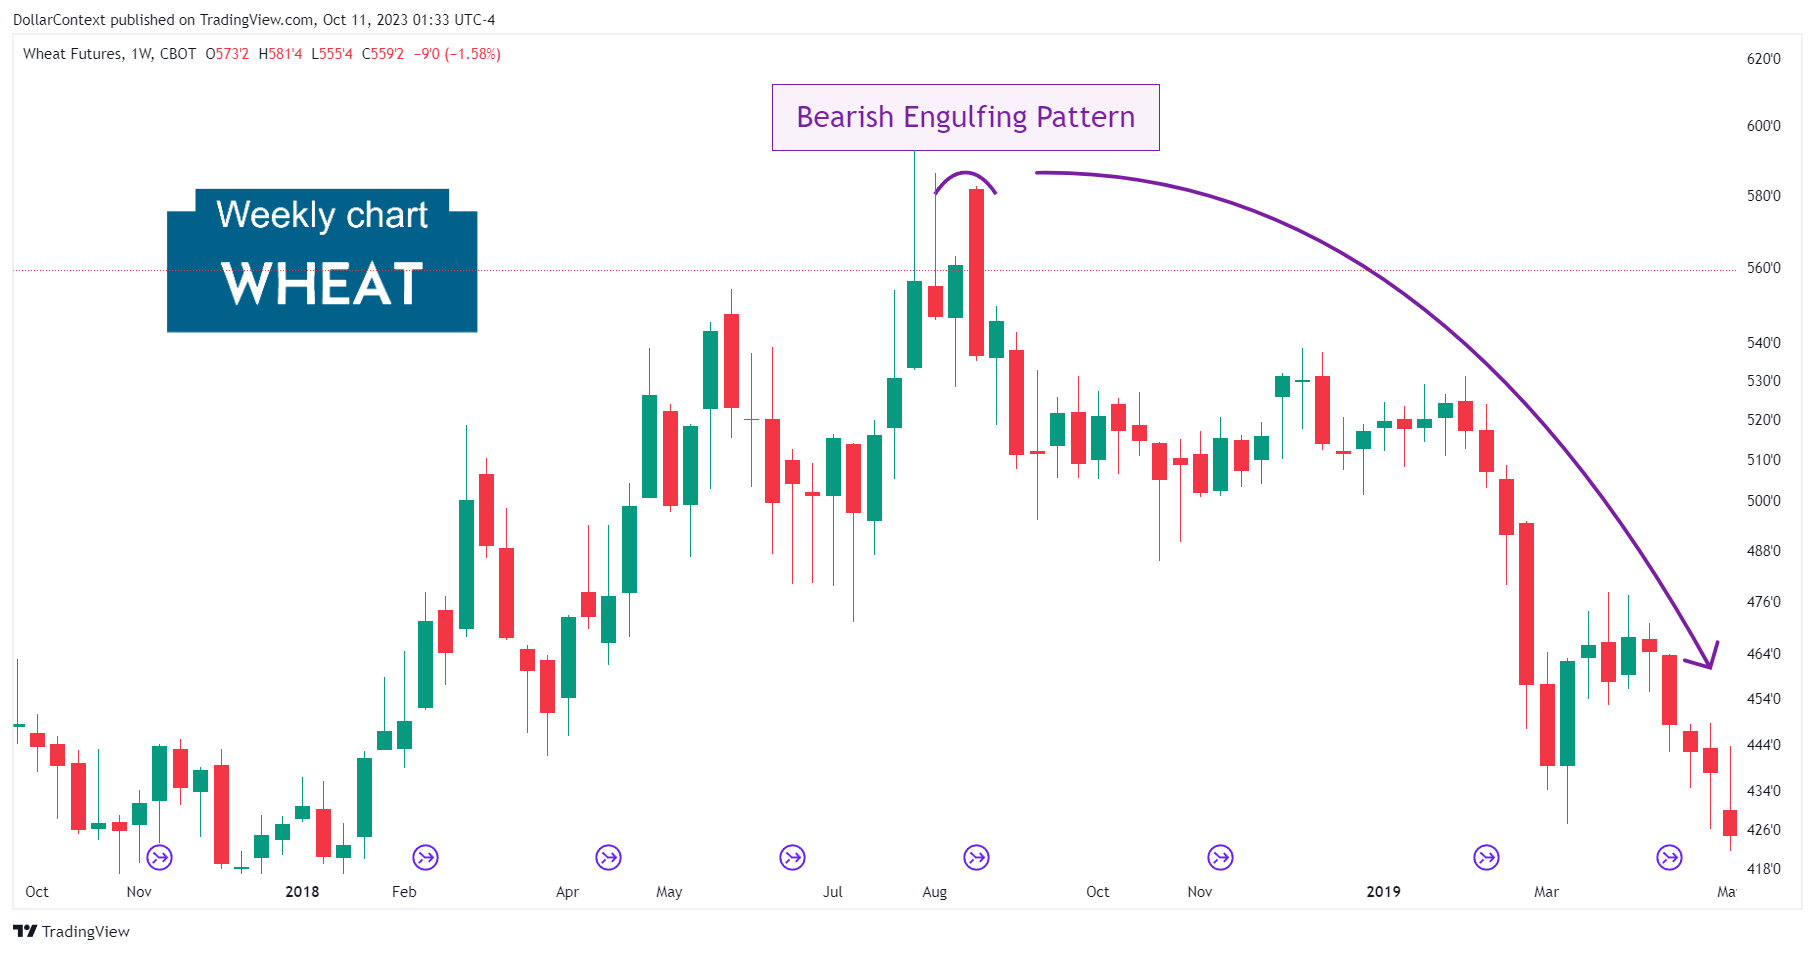
7.1 Wheat Futures (Weekly Chart)
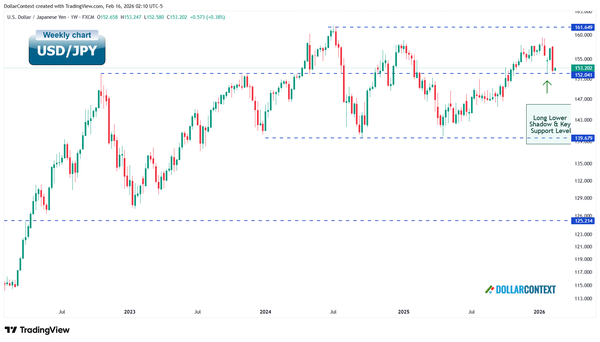
The chart below shows how wheat prices displayed a bearish engulfing pattern after an uptrend and the subsequent decline of the market. It's important to underscore that the long upper shadows exhibited by the preceding sessions could be used to validate the engulfing pattern and determine the likelihood of a bearish reversal.
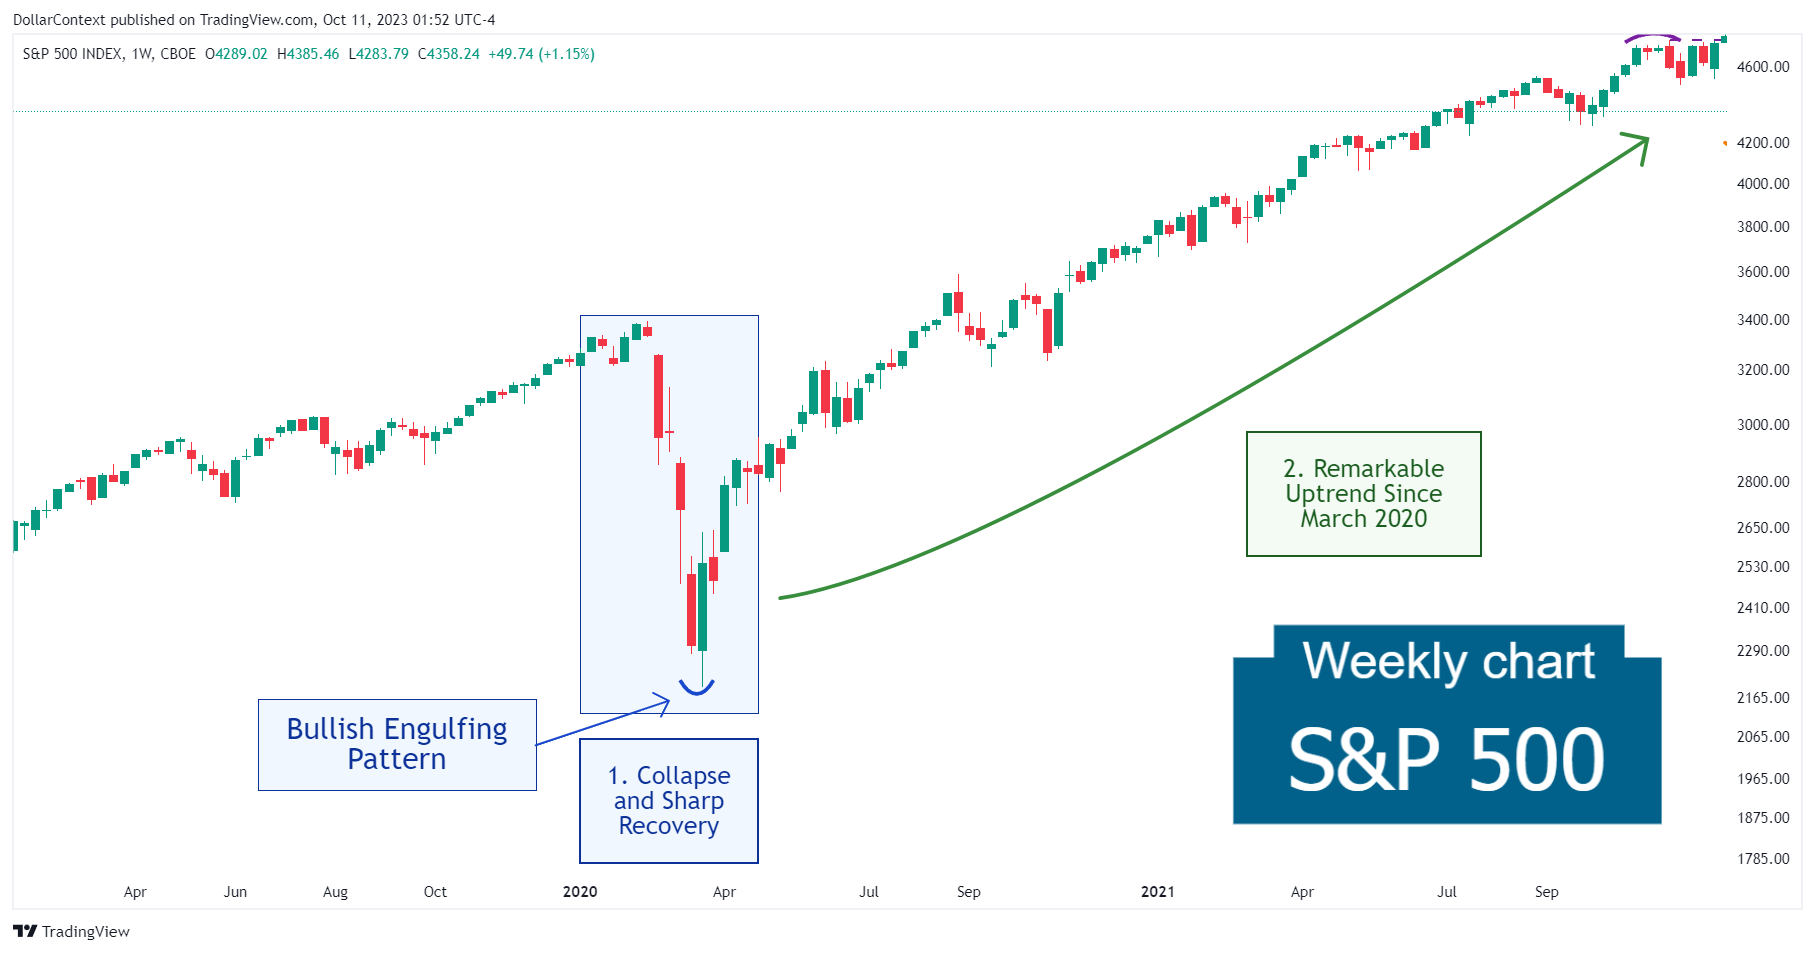
7.2 S&P 500 (Weekly Chart)
The steep decline of the S&P 500 in early 2020, during the height of the pandemic, ultimately culminated in a bullish engulfing pattern. The significant uptrend that ensued underscores the importance of taking such candle formations seriously, especially after a period of an oversold market.
7.3 More Examples (Case Studies)
- Case Study 0002: Weak Engulfing Pattern Transitions Into a Pullback (10-Year Treasury)
- Case Study 0008: High-Wave and Engulfing Pattern at the Bottom of a Window (WTI)
- Case Study 0024: Bullish Engulfing Pattern and Inverted Hammer (Nasdaq-100)
- Case Study 0025: Evening Star, Long Upper Shadow, Engulfing Pattern, and Long Red Real Body (EUR/USD)
- Case Study 0027: Evening Star and Bearish Engulfing Pattern (DXY)