The Psychology Behind a Piercing Pattern
Understanding the psychology behind the piercing pattern requires dissecting its two-candle formation and the investor sentiment driving each candlestick.

This article is part of the Piercing Pattern candlestick tutorial series. For the complete guide, see the Piercing Pattern — Complete Guide.
The piercing pattern is a bullish reversal pattern, typically occurring after a downtrend. While the shape of a piercing pattern is easily recognizable, understanding the psychology behind it requires dissecting its two-candle formation and the investor sentiment driving each candlestick.
1. First Candlestick (Bearish Session):
The first session of a piercing pattern can be described as follows:
- The market was initially in a downtrend or has been experiencing a series of bearish sessions. This sets a negative sentiment in the market.
- The first candlestick in the pattern is a long bearish (down) candlestick, representing a continuation of the prior negative sentiment.
- Investors and traders are selling their positions due to a combination of factors, which might include negative news, weak fundamentals, or simply the continuation of a prevailing downtrend.
2. Second Candlestick (Bullish Session):
These are the implications of the second candlestick of a piercing pattern:
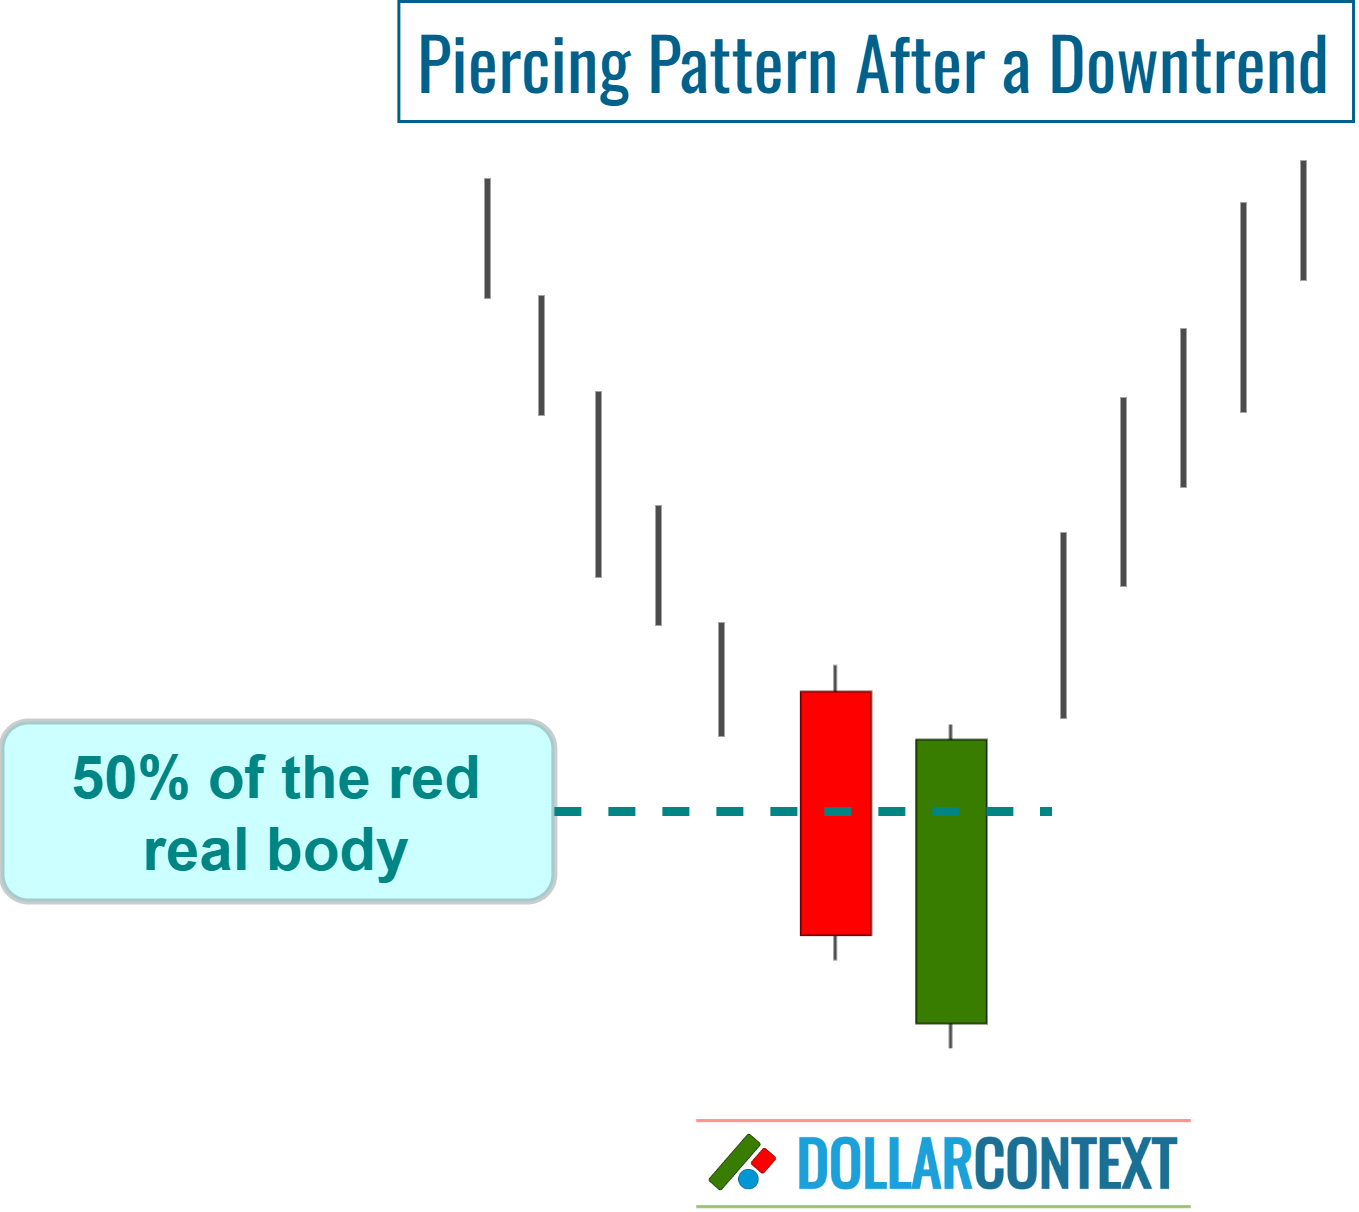
- The second session starts with a gap down, which means the opening price is even lower than the previous session's close. At this point, the bears are still in control, and the sentiment is very negative.
- However, during the session, there's a sentiment shift. Prices start to rise, and the bullish (up) candlestick that forms closes within, but above, the midpoint of the prior session's bearish candlestick. This indicates that bulls have started to step in and buy at lower prices, seeing value.
- The long bullish candlestick of the second session reflects a change in market sentiment. The bears are losing their grip, and the bulls are starting to take control.
Interpretation
The piercing pattern reveals a struggle between bears and bulls. While the bears are initially in control (evident from the continued downtrend and the gap down opening on the second session), the bulls begin to see the lower prices as an attractive entry point. As buying momentum increases, prices start to rise, and by the end of the second session, it becomes evident that the bears are losing their dominance.
This change in sentiment can be attributed to various factors:
- Value Buying: Some investors might see the lowered prices as an attractive point to buy, believing the asset is undervalued.
- Short Covering: Traders who were short (betting on the price going down) might decide to cover their positions (i.e., buy back the asset), especially if they believe the downtrend is coming to an end.
- Contrarian Buying: Some traders like to go against the prevailing trend, betting on reversals.
The piercing pattern, therefore, signals a potential reversal in the downtrend, indicating that the asset might move upward in the subsequent sessions.
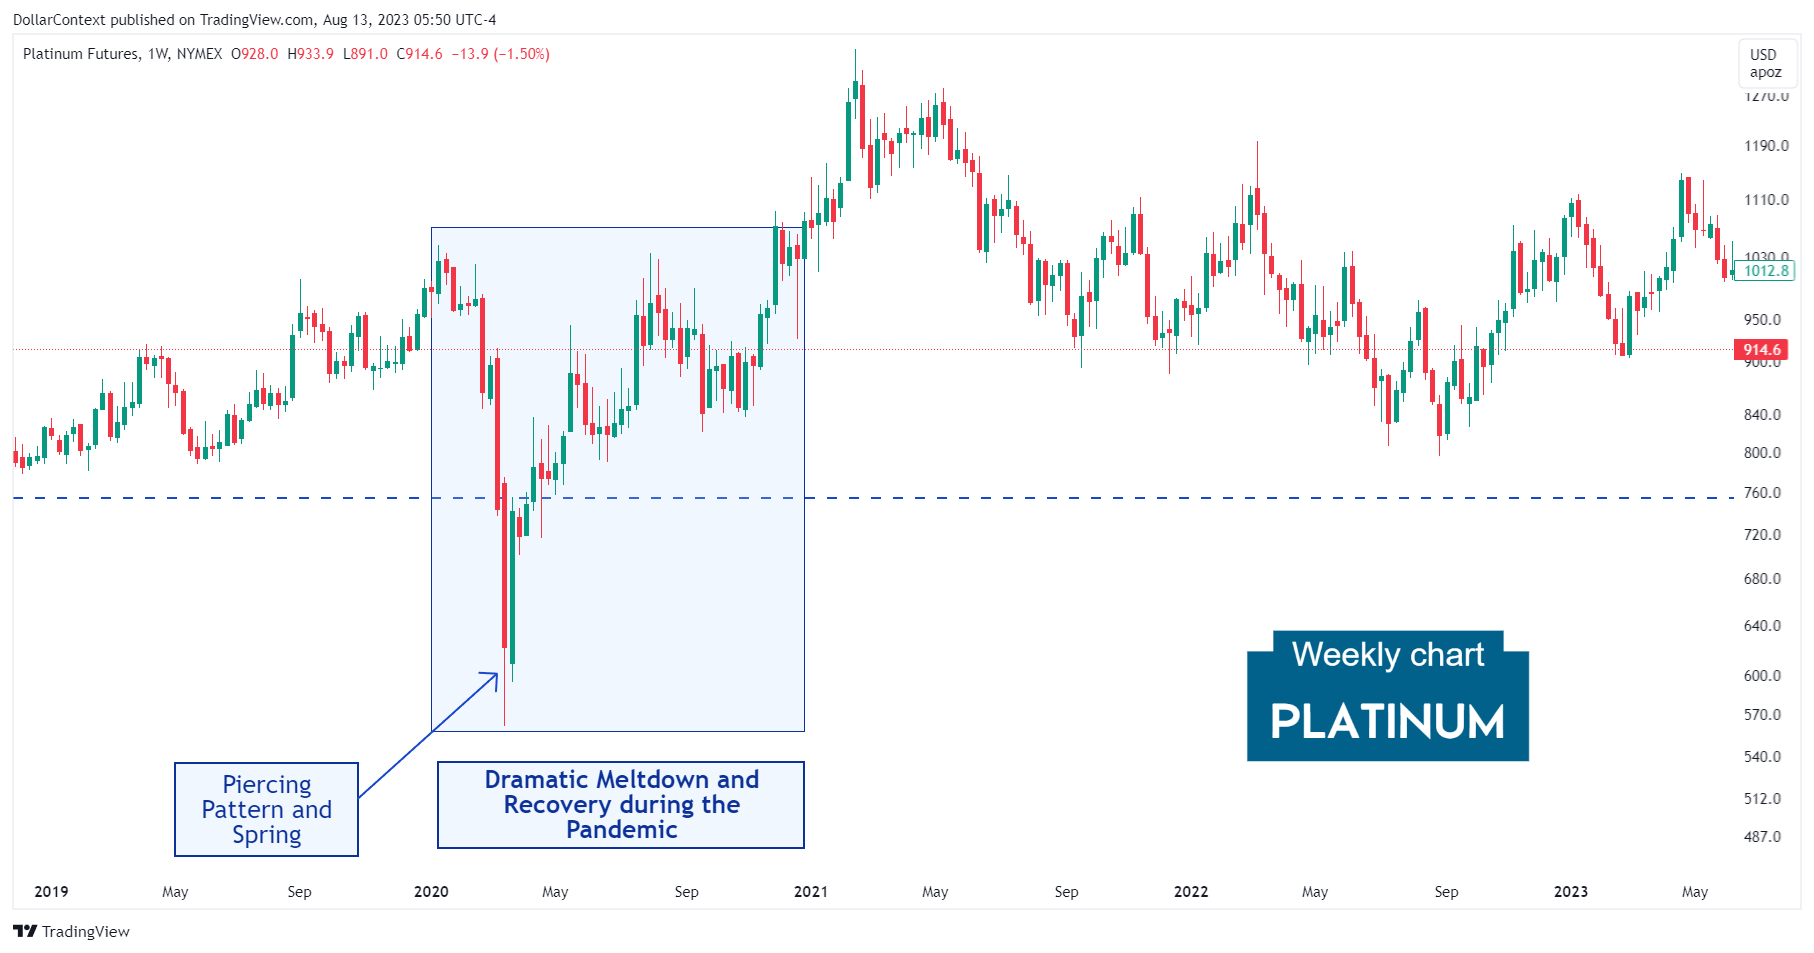
Example
The chart below shows how the piercing pattern displayed by the platinum market in March 2020 signaled a shift in market sentiment. This pattern marked the onset of a strong uptrend that persisted for about a year.