Case Study 0001: Doji After a Pronounced Red Candlestick (USD/JPY)
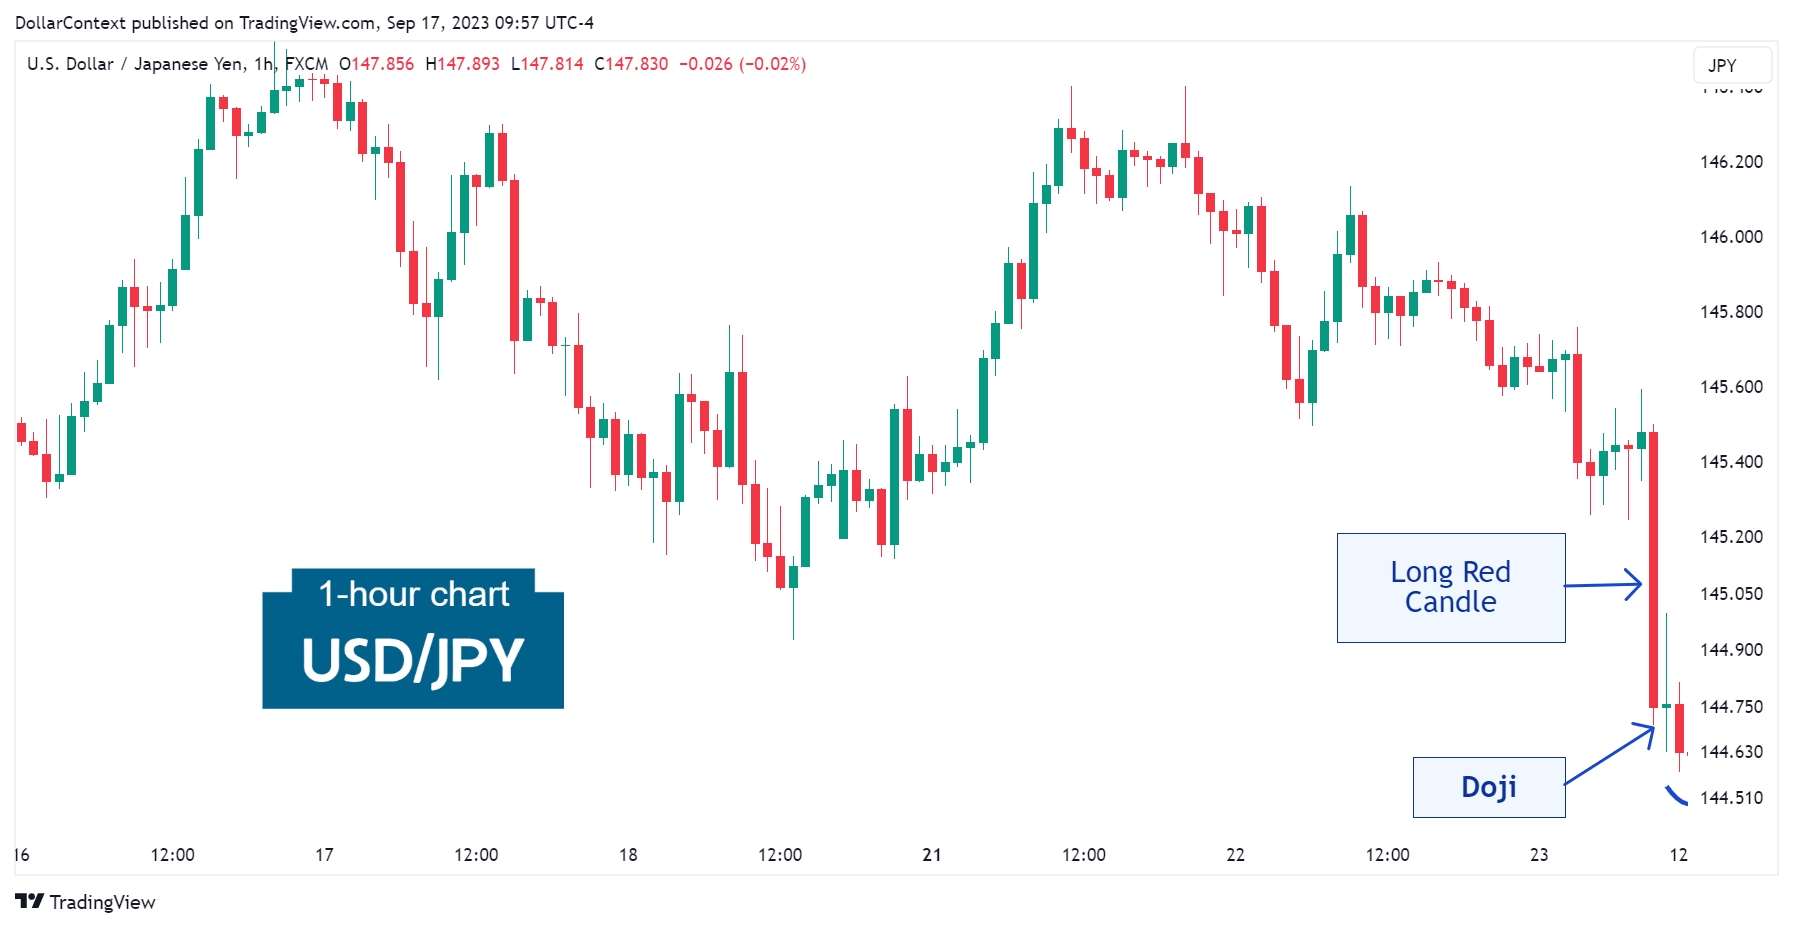
After an extended downtrend, the USD/JPY exhibited an exceptionally long red candle followed by a doji.

This case study examines a historical market setup observed in the USD/JPY in August 2023. It is intended for educational purposes and illustrates how specific candlestick patterns behaved in real market conditions.
Case Study Data Sheet (Historical)
1. Signal Formation
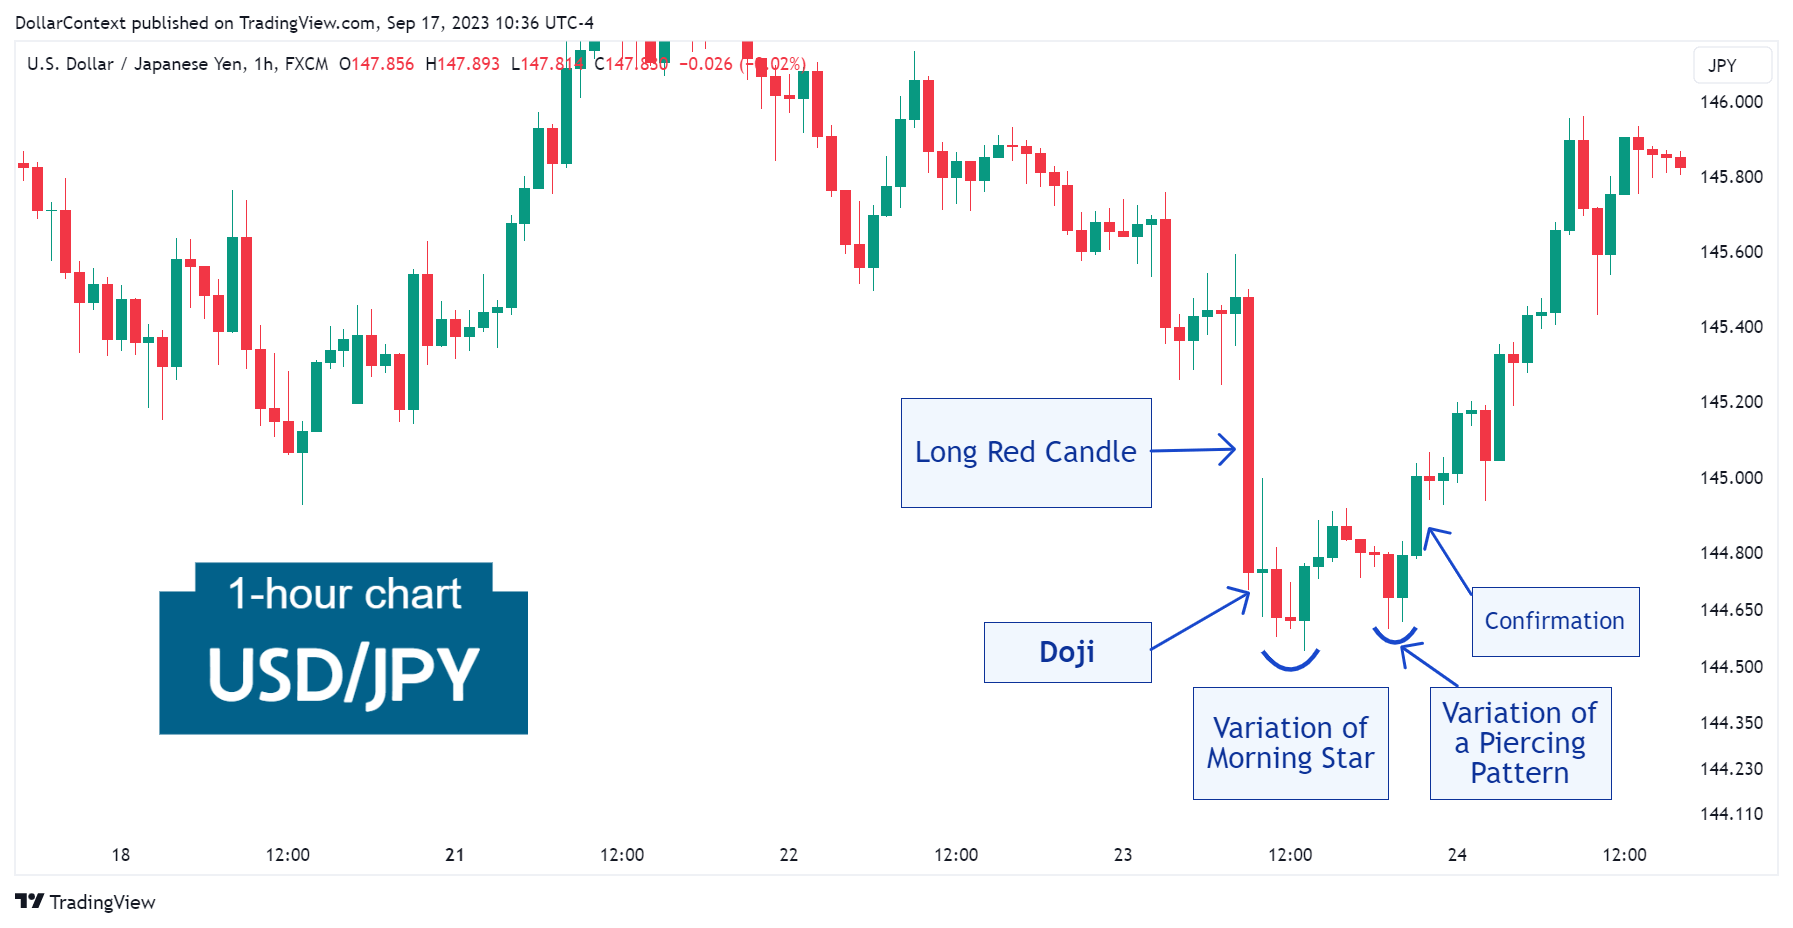
After an extended downtrend, the USD/JPY exhibited an exceptionally long red candle on August 23, 2023. Following the bearish session, the appearance of a doji gave a hint that the previous trend might be over.
2. Early Market Transition
Without delay, the market tested the support set by the lows of the doji session. Instead of breaking through, the USD/JPY quickly reversed, forming a variation of a morning star pattern.
The morning star also acted as a spring (a false breakout to the downside). In the context of an extended downward trend, the combination of a doji and morning star, following a lengthy bearish candle, offers a potent indication of a bullish turnaround.
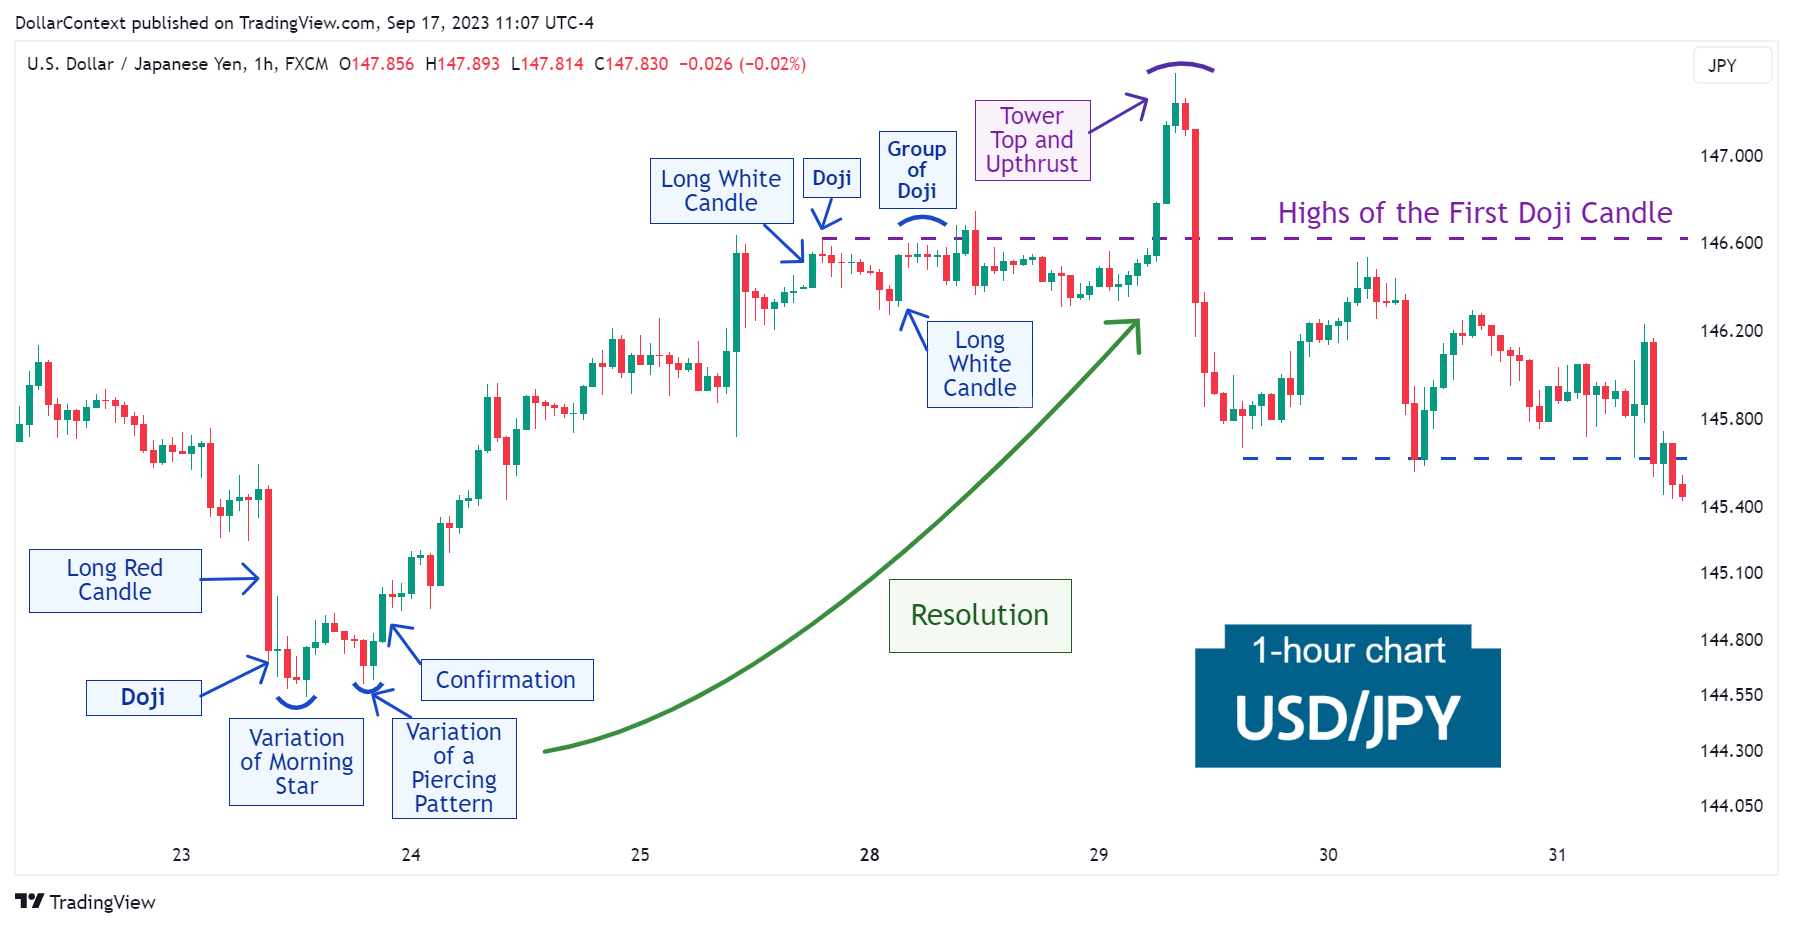
After the morning star, a formation resembling a piercing pattern further suggested a potential turn. The bullish trajectory of the subsequent sessions helped confirm this notion.
3. Resolution
After observing these significant bullish indicators, a pronounced uptrend ensued. The rally hinted at reaching its peak through a sequence of doji sessions, which then transitioned into a sideways movement. Remaining buying momentum resulted in an upthrust (a deceptive upward breakout), culminating in a tower top formation.
4. Conclusion and Retrospective Assessment
4.1 Pattern Development
We can observe an accumulation of candlestick patterns in the vicinity of a doji following a long red candle. This accumulation includes a spring, a variation of a morning star, and a possible piercing pattern.
4.2 Outcome Analysis
A positive outcome was evident as the reversal manifested in a notable uptrend.
Although the market offered multiple indications of the rally's conclusion, a prolonged upthrust made this evaluation more challenging.